
Key Insights
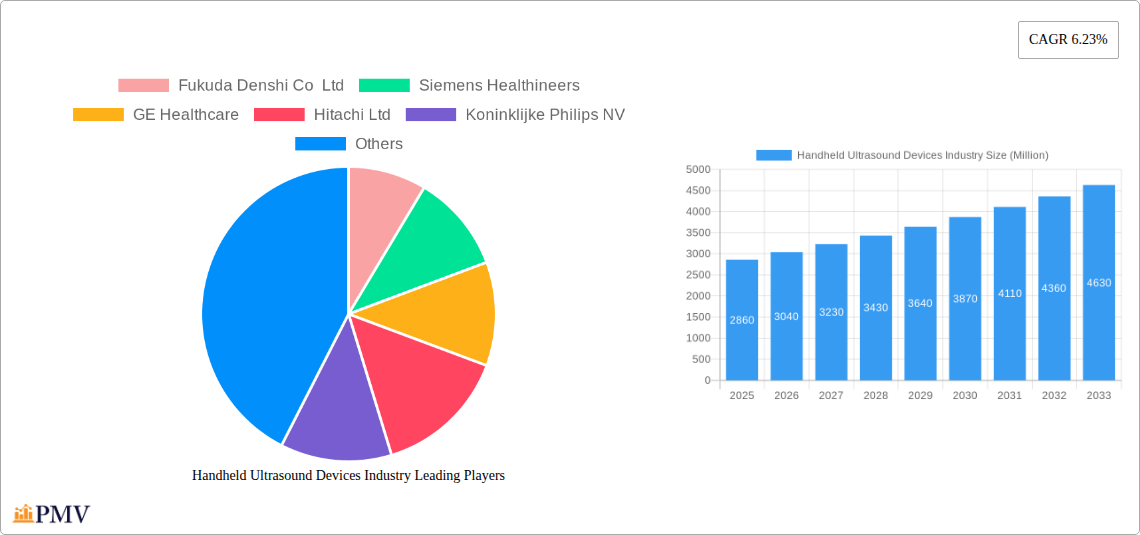
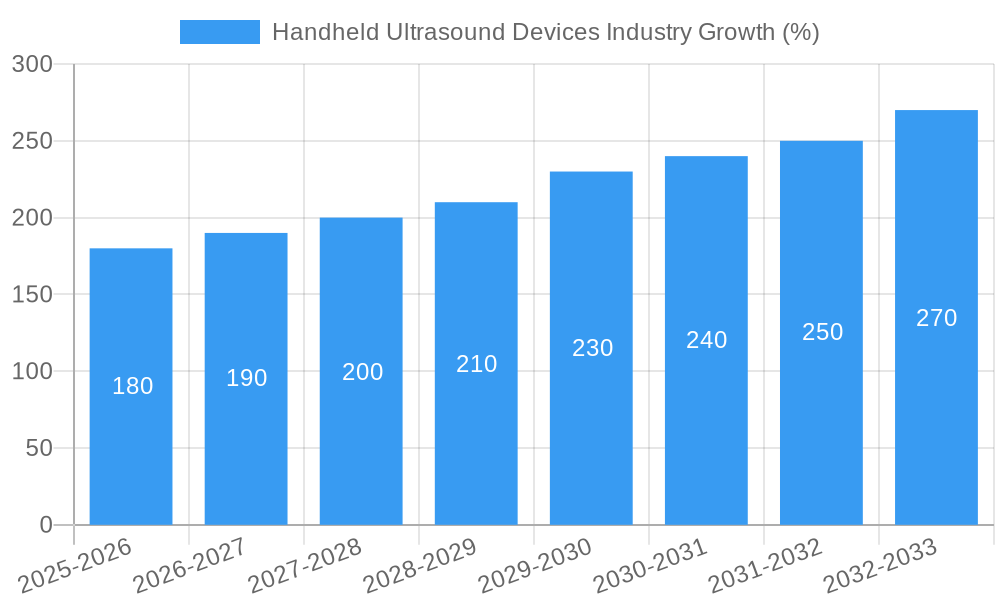
The global handheld ultrasound device market, valued at approximately $2.86 billion in 2025, is poised for robust growth, projected to expand at a compound annual growth rate (CAGR) of 6.23% from 2025 to 2033. This growth is fueled by several key factors. Firstly, the increasing demand for point-of-care diagnostics, particularly in remote areas and underserved communities, is driving adoption. Handheld devices offer portability and ease of use, enabling quick and efficient diagnoses in various settings, including emergency rooms, ambulances, and clinics with limited resources. Secondly, technological advancements resulting in improved image quality, enhanced features, and reduced costs are making these devices more accessible and attractive to healthcare providers. The miniaturization of ultrasound technology, coupled with improved battery life and wireless connectivity options, further enhances their practicality and appeal. Finally, the growing prevalence of chronic diseases necessitating frequent monitoring and the rising emphasis on preventive healthcare contribute significantly to market expansion. The integration of handheld ultrasound devices into various specialties, such as cardiology, gynecology, and emergency medicine, is broadening their application and market reach.
Despite these positive trends, certain challenges exist. Regulatory hurdles in specific markets can impede adoption. Moreover, the initial investment cost of these devices, though declining, can still be a barrier for smaller healthcare facilities. However, the long-term benefits of improved diagnostic accuracy, reduced hospital stays, and enhanced patient outcomes are expected to outweigh these challenges, ensuring continued market growth. The market is segmented by device type (e.g., mobile ultrasound, handheld) and application (e.g., cardiology, gynecology), with significant potential for growth in emerging economies driven by rising healthcare infrastructure development and increasing disposable income. Key players like Fukuda Denshi, Siemens Healthineers, and GE Healthcare are actively engaged in product innovation and strategic partnerships to capitalize on this expanding market.
Handheld Ultrasound Devices Industry: A Comprehensive Market Report (2019-2033)
This meticulously researched report provides a detailed analysis of the Handheld Ultrasound Devices market, offering invaluable insights for stakeholders across the value chain. The report covers the period from 2019 to 2033, with a base year of 2025 and a forecast period spanning 2025-2033. It leverages extensive primary and secondary research to deliver actionable intelligence on market size, growth drivers, competitive dynamics, and future trends. The total market value is estimated at xx Million in 2025 and is projected to reach xx Million by 2033, exhibiting a CAGR of xx% during the forecast period. Key players like Fukuda Denshi Co Ltd, Siemens Healthineers, GE Healthcare, Hitachi Ltd, Koninklijke Philips NV, Fujifilm SonoSite Inc, Canon Medical Systems Corporation, Shenzhen Mindray, and Samsung Healthcare are comprehensively analyzed.
Handheld Ultrasound Devices Industry Market Structure & Competitive Dynamics
The Handheld Ultrasound Devices market exhibits a moderately concentrated structure, with a few major players holding significant market share. However, the market is also characterized by a vibrant ecosystem of smaller companies and innovative startups, driving continuous technological advancements. Regulatory frameworks vary across geographies, impacting market access and product approvals. The market faces competition from substitute technologies, such as MRI and CT scans, particularly in specific applications. End-user trends, notably the increasing preference for point-of-care diagnostics and minimally invasive procedures, are fueling market growth. Mergers and acquisitions (M&A) activities have been moderate in recent years, with deal values averaging approximately xx Million per transaction.
- Market Concentration: The top five players hold approximately xx% of the global market share.
- Innovation Ecosystems: Significant R&D investments are driving innovations in image quality, portability, and software features.
- Regulatory Frameworks: Stringent regulatory approvals in key markets (e.g., FDA in the US, CE marking in Europe) impact market entry.
- Product Substitutes: Competition from other imaging technologies limits market penetration in some segments.
- End-User Trends: Demand for portable and user-friendly devices is increasing in various healthcare settings.
- M&A Activities: Consolidation is expected to continue, driven by the pursuit of scale and technological synergies.
Handheld Ultrasound Devices Industry Industry Trends & Insights
The Handheld Ultrasound Devices market is experiencing robust growth, driven by several factors. Technological advancements, such as improved image resolution and miniaturization, are enhancing the diagnostic capabilities and usability of these devices. The increasing prevalence of chronic diseases and the growing demand for point-of-care diagnostics are also contributing to market expansion. Consumer preferences are shifting towards portable, easy-to-use, and cost-effective solutions. Competitive dynamics are shaping innovation, with companies focusing on differentiated products and services to gain market share. The market penetration of handheld ultrasound devices is particularly high in applications such as emergency medicine and point-of-care diagnostics.
Dominant Markets & Segments in Handheld Ultrasound Devices Industry
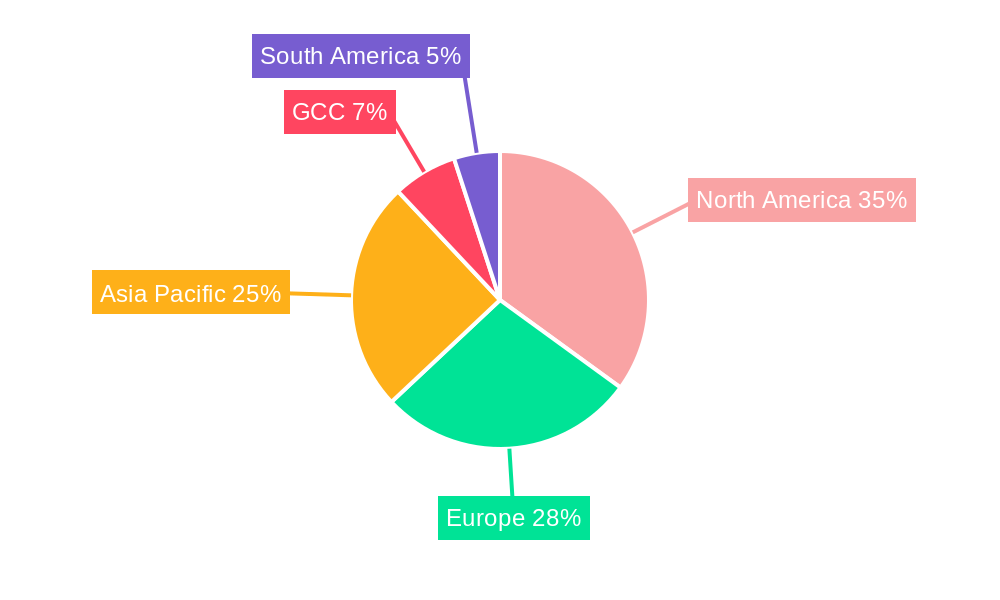
The North American region currently holds the largest market share in the Handheld Ultrasound Devices industry, driven by strong healthcare infrastructure, high adoption rates, and favorable reimbursement policies. Within the application segments, cardiology and gynecology demonstrate substantial growth potential, primarily due to the increasing need for rapid and accessible diagnostics. Handheld ultrasound devices are experiencing rapid adoption, largely due to their portability and ease of use in these areas.
- Leading Region: North America
- Key Drivers: Advanced healthcare infrastructure, high disposable incomes, favorable reimbursement policies.
- Leading Application Segments: Cardiology and Gynecology
- Key Drivers: High demand for point-of-care diagnostics, increasing prevalence of cardiovascular and gynecological diseases.
- Leading Device Type: Handheld Ultrasound Devices
- Key Drivers: Portability, ease of use, cost-effectiveness.
Handheld Ultrasound Devices Industry Product Innovations
Recent innovations focus on enhancing image quality, improving portability, and integrating advanced features such as AI-powered image analysis. This has led to the development of more user-friendly and cost-effective devices, catering to the growing need for point-of-care diagnostics across various specialties. The market is witnessing a trend towards wireless connectivity and integration with electronic health records (EHR) systems.
Report Segmentation & Scope
The report segments the Handheld Ultrasound Devices market based on device type (Mobile Ultrasound Device, Handheld Ultrasound Device) and application (Gynecology, Cardiovascular, Urology, Musculoskeletal, Anesthesiology, Others). Each segment's growth trajectory, market size, and competitive landscape are analyzed in detail. Growth projections for each segment are provided for the forecast period. Competitive dynamics within each segment are analyzed based on market share, product offerings, and strategic initiatives.
Key Drivers of Handheld Ultrasound Devices Industry Growth
Several factors are driving the growth of the Handheld Ultrasound Devices market. These include the increasing demand for point-of-care diagnostics, technological advancements leading to improved image quality and portability, rising prevalence of chronic diseases, and favorable regulatory frameworks in certain regions. Growing adoption in emerging economies is also expected to contribute significantly to market expansion.
Challenges in the Handheld Ultrasound Devices Industry Sector
The Handheld Ultrasound Devices market faces several challenges, including stringent regulatory hurdles for new product approvals, supply chain disruptions affecting component availability, and intense competition from established players and new entrants. Price pressure from healthcare providers and fluctuations in currency exchange rates also pose significant barriers to market growth.
Leading Players in the Handheld Ultrasound Devices Industry Market
- Fukuda Denshi Co Ltd
- Siemens Healthineers
- GE Healthcare
- Hitachi Ltd
- Koninklijke Philips NV
- Fujifilm SonoSite Inc
- Canon Medical Systems Corporation
- Shenzhen Mindray
- Samsung Healthcare
Key Developments in Handheld Ultrasound Devices Industry Sector
- 2023-06: Company X launched a new handheld ultrasound device with AI-powered image analysis capabilities.
- 2022-11: Company Y acquired Company Z, expanding its product portfolio and market reach.
- 2021-03: New regulatory guidelines were implemented in region A, impacting product approvals.
Strategic Handheld Ultrasound Devices Industry Market Outlook
The Handheld Ultrasound Devices market is poised for sustained growth, driven by ongoing technological innovations, increasing demand for portable diagnostic tools, and expanding applications across various healthcare settings. Strategic opportunities exist for companies focusing on developing user-friendly, cost-effective, and AI-enabled devices. The focus on point-of-care diagnostics and integration with telemedicine platforms will further drive market expansion in the coming years.
Handheld Ultrasound Devices Industry Segmentation
-
1. Type of Device
- 1.1. Mobile Ultrasound Device
- 1.2. Handheld Ultrasound Device
-
2. Application
- 2.1. Gynecology
- 2.2. Cardiovascular
- 2.3. Urology
- 2.4. Musculoskeletal
- 2.5. Anesthesiology
- 2.6. Others
Handheld Ultrasound Devices Industry Segmentation By Geography
-
1. North America
- 1.1. United States
- 1.2. Canada
- 1.3. Mexico
-
2. Europe
- 2.1. Germany
- 2.2. United Kingdom
- 2.3. France
- 2.4. Italy
- 2.5. Spain
- 2.6. Rest of Europe
-
3. Asia Pacific
- 3.1. China
- 3.2. Japan
- 3.3. India
- 3.4. Australia
- 3.5. South Korea
- 3.6. Rest of Asia Pacific
- 4. Middle East
-
5. GCC
- 5.1. South Africa
- 5.2. Rest of Middle East
-
6. South America
- 6.1. Brazil
- 6.2. Argentina
- 6.3. Rest of South America
Handheld Ultrasound Devices Industry REPORT HIGHLIGHTS
| Aspects | Details |
|---|---|
| Study Period | 2019-2033 |
| Base Year | 2024 |
| Estimated Year | 2025 |
| Forecast Period | 2025-2033 |
| Historical Period | 2019-2024 |
| Growth Rate | CAGR of 6.23% from 2019-2033 |
| Segmentation |
|
Table of Contents
- 1. Introduction
- 1.1. Research Scope
- 1.2. Market Segmentation
- 1.3. Research Methodology
- 1.4. Definitions and Assumptions
- 2. Executive Summary
- 2.1. Introduction
- 3. Market Dynamics
- 3.1. Introduction
- 3.2. Market Drivers
- 3.2.1. ; Increasing Spectrum of Applications of Portable Ultrasound; Rising Advancements in Technology; Increasing Prevalence of Chronic Diseases
- 3.3. Market Restrains
- 3.3.1. ; High Cost of Portable Ultrasound Systems; Lack of Dedicated Training Programs by Companies
- 3.4. Market Trends
- 3.4.1. Mobile Ultrasound Devices is Expected to Grow with High CAGR Over the Forecast Period
- 4. Market Factor Analysis
- 4.1. Porters Five Forces
- 4.2. Supply/Value Chain
- 4.3. PESTEL analysis
- 4.4. Market Entropy
- 4.5. Patent/Trademark Analysis
- 5. Global Handheld Ultrasound Devices Industry Analysis, Insights and Forecast, 2019-2031
- 5.1. Market Analysis, Insights and Forecast - by Type of Device
- 5.1.1. Mobile Ultrasound Device
- 5.1.2. Handheld Ultrasound Device
- 5.2. Market Analysis, Insights and Forecast - by Application
- 5.2.1. Gynecology
- 5.2.2. Cardiovascular
- 5.2.3. Urology
- 5.2.4. Musculoskeletal
- 5.2.5. Anesthesiology
- 5.2.6. Others
- 5.3. Market Analysis, Insights and Forecast - by Region
- 5.3.1. North America
- 5.3.2. Europe
- 5.3.3. Asia Pacific
- 5.3.4. Middle East
- 5.3.5. GCC
- 5.3.6. South America
- 5.1. Market Analysis, Insights and Forecast - by Type of Device
- 6. North America Handheld Ultrasound Devices Industry Analysis, Insights and Forecast, 2019-2031
- 6.1. Market Analysis, Insights and Forecast - by Type of Device
- 6.1.1. Mobile Ultrasound Device
- 6.1.2. Handheld Ultrasound Device
- 6.2. Market Analysis, Insights and Forecast - by Application
- 6.2.1. Gynecology
- 6.2.2. Cardiovascular
- 6.2.3. Urology
- 6.2.4. Musculoskeletal
- 6.2.5. Anesthesiology
- 6.2.6. Others
- 6.1. Market Analysis, Insights and Forecast - by Type of Device
- 7. Europe Handheld Ultrasound Devices Industry Analysis, Insights and Forecast, 2019-2031
- 7.1. Market Analysis, Insights and Forecast - by Type of Device
- 7.1.1. Mobile Ultrasound Device
- 7.1.2. Handheld Ultrasound Device
- 7.2. Market Analysis, Insights and Forecast - by Application
- 7.2.1. Gynecology
- 7.2.2. Cardiovascular
- 7.2.3. Urology
- 7.2.4. Musculoskeletal
- 7.2.5. Anesthesiology
- 7.2.6. Others
- 7.1. Market Analysis, Insights and Forecast - by Type of Device
- 8. Asia Pacific Handheld Ultrasound Devices Industry Analysis, Insights and Forecast, 2019-2031
- 8.1. Market Analysis, Insights and Forecast - by Type of Device
- 8.1.1. Mobile Ultrasound Device
- 8.1.2. Handheld Ultrasound Device
- 8.2. Market Analysis, Insights and Forecast - by Application
- 8.2.1. Gynecology
- 8.2.2. Cardiovascular
- 8.2.3. Urology
- 8.2.4. Musculoskeletal
- 8.2.5. Anesthesiology
- 8.2.6. Others
- 8.1. Market Analysis, Insights and Forecast - by Type of Device
- 9. Middle East Handheld Ultrasound Devices Industry Analysis, Insights and Forecast, 2019-2031
- 9.1. Market Analysis, Insights and Forecast - by Type of Device
- 9.1.1. Mobile Ultrasound Device
- 9.1.2. Handheld Ultrasound Device
- 9.2. Market Analysis, Insights and Forecast - by Application
- 9.2.1. Gynecology
- 9.2.2. Cardiovascular
- 9.2.3. Urology
- 9.2.4. Musculoskeletal
- 9.2.5. Anesthesiology
- 9.2.6. Others
- 9.1. Market Analysis, Insights and Forecast - by Type of Device
- 10. GCC Handheld Ultrasound Devices Industry Analysis, Insights and Forecast, 2019-2031
- 10.1. Market Analysis, Insights and Forecast - by Type of Device
- 10.1.1. Mobile Ultrasound Device
- 10.1.2. Handheld Ultrasound Device
- 10.2. Market Analysis, Insights and Forecast - by Application
- 10.2.1. Gynecology
- 10.2.2. Cardiovascular
- 10.2.3. Urology
- 10.2.4. Musculoskeletal
- 10.2.5. Anesthesiology
- 10.2.6. Others
- 10.1. Market Analysis, Insights and Forecast - by Type of Device
- 11. South America Handheld Ultrasound Devices Industry Analysis, Insights and Forecast, 2019-2031
- 11.1. Market Analysis, Insights and Forecast - by Type of Device
- 11.1.1. Mobile Ultrasound Device
- 11.1.2. Handheld Ultrasound Device
- 11.2. Market Analysis, Insights and Forecast - by Application
- 11.2.1. Gynecology
- 11.2.2. Cardiovascular
- 11.2.3. Urology
- 11.2.4. Musculoskeletal
- 11.2.5. Anesthesiology
- 11.2.6. Others
- 11.1. Market Analysis, Insights and Forecast - by Type of Device
- 12. North America Handheld Ultrasound Devices Industry Analysis, Insights and Forecast, 2019-2031
- 12.1. Market Analysis, Insights and Forecast - By Country/Sub-region
- 12.1.1 United States
- 12.1.2 Canada
- 12.1.3 Mexico
- 13. Europe Handheld Ultrasound Devices Industry Analysis, Insights and Forecast, 2019-2031
- 13.1. Market Analysis, Insights and Forecast - By Country/Sub-region
- 13.1.1 Germany
- 13.1.2 United Kingdom
- 13.1.3 France
- 13.1.4 Italy
- 13.1.5 Spain
- 13.1.6 Rest of Europe
- 14. Asia Pacific Handheld Ultrasound Devices Industry Analysis, Insights and Forecast, 2019-2031
- 14.1. Market Analysis, Insights and Forecast - By Country/Sub-region
- 14.1.1 China
- 14.1.2 Japan
- 14.1.3 India
- 14.1.4 Australia
- 14.1.5 South Korea
- 14.1.6 Rest of Asia Pacific
- 15. GCC Handheld Ultrasound Devices Industry Analysis, Insights and Forecast, 2019-2031
- 15.1. Market Analysis, Insights and Forecast - By Country/Sub-region
- 15.1.1 South Africa
- 15.1.2 Rest of Middle East
- 16. South America Handheld Ultrasound Devices Industry Analysis, Insights and Forecast, 2019-2031
- 16.1. Market Analysis, Insights and Forecast - By Country/Sub-region
- 16.1.1 Brazil
- 16.1.2 Argentina
- 16.1.3 Rest of South America
- 17. Competitive Analysis
- 17.1. Global Market Share Analysis 2024
- 17.2. Company Profiles
- 17.2.1 Fukuda Denshi Co Ltd
- 17.2.1.1. Overview
- 17.2.1.2. Products
- 17.2.1.3. SWOT Analysis
- 17.2.1.4. Recent Developments
- 17.2.1.5. Financials (Based on Availability)
- 17.2.2 Siemens Healthineers
- 17.2.2.1. Overview
- 17.2.2.2. Products
- 17.2.2.3. SWOT Analysis
- 17.2.2.4. Recent Developments
- 17.2.2.5. Financials (Based on Availability)
- 17.2.3 GE Healthcare
- 17.2.3.1. Overview
- 17.2.3.2. Products
- 17.2.3.3. SWOT Analysis
- 17.2.3.4. Recent Developments
- 17.2.3.5. Financials (Based on Availability)
- 17.2.4 Hitachi Ltd
- 17.2.4.1. Overview
- 17.2.4.2. Products
- 17.2.4.3. SWOT Analysis
- 17.2.4.4. Recent Developments
- 17.2.4.5. Financials (Based on Availability)
- 17.2.5 Koninklijke Philips NV
- 17.2.5.1. Overview
- 17.2.5.2. Products
- 17.2.5.3. SWOT Analysis
- 17.2.5.4. Recent Developments
- 17.2.5.5. Financials (Based on Availability)
- 17.2.6 Fujifilm SonoSite Inc
- 17.2.6.1. Overview
- 17.2.6.2. Products
- 17.2.6.3. SWOT Analysis
- 17.2.6.4. Recent Developments
- 17.2.6.5. Financials (Based on Availability)
- 17.2.7 Canon Medical Systems Corporation
- 17.2.7.1. Overview
- 17.2.7.2. Products
- 17.2.7.3. SWOT Analysis
- 17.2.7.4. Recent Developments
- 17.2.7.5. Financials (Based on Availability)
- 17.2.8 Shenzhen Mindray
- 17.2.8.1. Overview
- 17.2.8.2. Products
- 17.2.8.3. SWOT Analysis
- 17.2.8.4. Recent Developments
- 17.2.8.5. Financials (Based on Availability)
- 17.2.9 Samsung Healthcare
- 17.2.9.1. Overview
- 17.2.9.2. Products
- 17.2.9.3. SWOT Analysis
- 17.2.9.4. Recent Developments
- 17.2.9.5. Financials (Based on Availability)
- 17.2.1 Fukuda Denshi Co Ltd
List of Figures
- Figure 1: Global Handheld Ultrasound Devices Industry Revenue Breakdown (Million, %) by Region 2024 & 2032
- Figure 2: Global Handheld Ultrasound Devices Industry Volume Breakdown (K Unit, %) by Region 2024 & 2032
- Figure 3: North America Handheld Ultrasound Devices Industry Revenue (Million), by Country 2024 & 2032
- Figure 4: North America Handheld Ultrasound Devices Industry Volume (K Unit), by Country 2024 & 2032
- Figure 5: North America Handheld Ultrasound Devices Industry Revenue Share (%), by Country 2024 & 2032
- Figure 6: North America Handheld Ultrasound Devices Industry Volume Share (%), by Country 2024 & 2032
- Figure 7: Europe Handheld Ultrasound Devices Industry Revenue (Million), by Country 2024 & 2032
- Figure 8: Europe Handheld Ultrasound Devices Industry Volume (K Unit), by Country 2024 & 2032
- Figure 9: Europe Handheld Ultrasound Devices Industry Revenue Share (%), by Country 2024 & 2032
- Figure 10: Europe Handheld Ultrasound Devices Industry Volume Share (%), by Country 2024 & 2032
- Figure 11: Asia Pacific Handheld Ultrasound Devices Industry Revenue (Million), by Country 2024 & 2032
- Figure 12: Asia Pacific Handheld Ultrasound Devices Industry Volume (K Unit), by Country 2024 & 2032
- Figure 13: Asia Pacific Handheld Ultrasound Devices Industry Revenue Share (%), by Country 2024 & 2032
- Figure 14: Asia Pacific Handheld Ultrasound Devices Industry Volume Share (%), by Country 2024 & 2032
- Figure 15: GCC Handheld Ultrasound Devices Industry Revenue (Million), by Country 2024 & 2032
- Figure 16: GCC Handheld Ultrasound Devices Industry Volume (K Unit), by Country 2024 & 2032
- Figure 17: GCC Handheld Ultrasound Devices Industry Revenue Share (%), by Country 2024 & 2032
- Figure 18: GCC Handheld Ultrasound Devices Industry Volume Share (%), by Country 2024 & 2032
- Figure 19: South America Handheld Ultrasound Devices Industry Revenue (Million), by Country 2024 & 2032
- Figure 20: South America Handheld Ultrasound Devices Industry Volume (K Unit), by Country 2024 & 2032
- Figure 21: South America Handheld Ultrasound Devices Industry Revenue Share (%), by Country 2024 & 2032
- Figure 22: South America Handheld Ultrasound Devices Industry Volume Share (%), by Country 2024 & 2032
- Figure 23: North America Handheld Ultrasound Devices Industry Revenue (Million), by Type of Device 2024 & 2032
- Figure 24: North America Handheld Ultrasound Devices Industry Volume (K Unit), by Type of Device 2024 & 2032
- Figure 25: North America Handheld Ultrasound Devices Industry Revenue Share (%), by Type of Device 2024 & 2032
- Figure 26: North America Handheld Ultrasound Devices Industry Volume Share (%), by Type of Device 2024 & 2032
- Figure 27: North America Handheld Ultrasound Devices Industry Revenue (Million), by Application 2024 & 2032
- Figure 28: North America Handheld Ultrasound Devices Industry Volume (K Unit), by Application 2024 & 2032
- Figure 29: North America Handheld Ultrasound Devices Industry Revenue Share (%), by Application 2024 & 2032
- Figure 30: North America Handheld Ultrasound Devices Industry Volume Share (%), by Application 2024 & 2032
- Figure 31: North America Handheld Ultrasound Devices Industry Revenue (Million), by Country 2024 & 2032
- Figure 32: North America Handheld Ultrasound Devices Industry Volume (K Unit), by Country 2024 & 2032
- Figure 33: North America Handheld Ultrasound Devices Industry Revenue Share (%), by Country 2024 & 2032
- Figure 34: North America Handheld Ultrasound Devices Industry Volume Share (%), by Country 2024 & 2032
- Figure 35: Europe Handheld Ultrasound Devices Industry Revenue (Million), by Type of Device 2024 & 2032
- Figure 36: Europe Handheld Ultrasound Devices Industry Volume (K Unit), by Type of Device 2024 & 2032
- Figure 37: Europe Handheld Ultrasound Devices Industry Revenue Share (%), by Type of Device 2024 & 2032
- Figure 38: Europe Handheld Ultrasound Devices Industry Volume Share (%), by Type of Device 2024 & 2032
- Figure 39: Europe Handheld Ultrasound Devices Industry Revenue (Million), by Application 2024 & 2032
- Figure 40: Europe Handheld Ultrasound Devices Industry Volume (K Unit), by Application 2024 & 2032
- Figure 41: Europe Handheld Ultrasound Devices Industry Revenue Share (%), by Application 2024 & 2032
- Figure 42: Europe Handheld Ultrasound Devices Industry Volume Share (%), by Application 2024 & 2032
- Figure 43: Europe Handheld Ultrasound Devices Industry Revenue (Million), by Country 2024 & 2032
- Figure 44: Europe Handheld Ultrasound Devices Industry Volume (K Unit), by Country 2024 & 2032
- Figure 45: Europe Handheld Ultrasound Devices Industry Revenue Share (%), by Country 2024 & 2032
- Figure 46: Europe Handheld Ultrasound Devices Industry Volume Share (%), by Country 2024 & 2032
- Figure 47: Asia Pacific Handheld Ultrasound Devices Industry Revenue (Million), by Type of Device 2024 & 2032
- Figure 48: Asia Pacific Handheld Ultrasound Devices Industry Volume (K Unit), by Type of Device 2024 & 2032
- Figure 49: Asia Pacific Handheld Ultrasound Devices Industry Revenue Share (%), by Type of Device 2024 & 2032
- Figure 50: Asia Pacific Handheld Ultrasound Devices Industry Volume Share (%), by Type of Device 2024 & 2032
- Figure 51: Asia Pacific Handheld Ultrasound Devices Industry Revenue (Million), by Application 2024 & 2032
- Figure 52: Asia Pacific Handheld Ultrasound Devices Industry Volume (K Unit), by Application 2024 & 2032
- Figure 53: Asia Pacific Handheld Ultrasound Devices Industry Revenue Share (%), by Application 2024 & 2032
- Figure 54: Asia Pacific Handheld Ultrasound Devices Industry Volume Share (%), by Application 2024 & 2032
- Figure 55: Asia Pacific Handheld Ultrasound Devices Industry Revenue (Million), by Country 2024 & 2032
- Figure 56: Asia Pacific Handheld Ultrasound Devices Industry Volume (K Unit), by Country 2024 & 2032
- Figure 57: Asia Pacific Handheld Ultrasound Devices Industry Revenue Share (%), by Country 2024 & 2032
- Figure 58: Asia Pacific Handheld Ultrasound Devices Industry Volume Share (%), by Country 2024 & 2032
- Figure 59: Middle East Handheld Ultrasound Devices Industry Revenue (Million), by Type of Device 2024 & 2032
- Figure 60: Middle East Handheld Ultrasound Devices Industry Volume (K Unit), by Type of Device 2024 & 2032
- Figure 61: Middle East Handheld Ultrasound Devices Industry Revenue Share (%), by Type of Device 2024 & 2032
- Figure 62: Middle East Handheld Ultrasound Devices Industry Volume Share (%), by Type of Device 2024 & 2032
- Figure 63: Middle East Handheld Ultrasound Devices Industry Revenue (Million), by Application 2024 & 2032
- Figure 64: Middle East Handheld Ultrasound Devices Industry Volume (K Unit), by Application 2024 & 2032
- Figure 65: Middle East Handheld Ultrasound Devices Industry Revenue Share (%), by Application 2024 & 2032
- Figure 66: Middle East Handheld Ultrasound Devices Industry Volume Share (%), by Application 2024 & 2032
- Figure 67: Middle East Handheld Ultrasound Devices Industry Revenue (Million), by Country 2024 & 2032
- Figure 68: Middle East Handheld Ultrasound Devices Industry Volume (K Unit), by Country 2024 & 2032
- Figure 69: Middle East Handheld Ultrasound Devices Industry Revenue Share (%), by Country 2024 & 2032
- Figure 70: Middle East Handheld Ultrasound Devices Industry Volume Share (%), by Country 2024 & 2032
- Figure 71: GCC Handheld Ultrasound Devices Industry Revenue (Million), by Type of Device 2024 & 2032
- Figure 72: GCC Handheld Ultrasound Devices Industry Volume (K Unit), by Type of Device 2024 & 2032
- Figure 73: GCC Handheld Ultrasound Devices Industry Revenue Share (%), by Type of Device 2024 & 2032
- Figure 74: GCC Handheld Ultrasound Devices Industry Volume Share (%), by Type of Device 2024 & 2032
- Figure 75: GCC Handheld Ultrasound Devices Industry Revenue (Million), by Application 2024 & 2032
- Figure 76: GCC Handheld Ultrasound Devices Industry Volume (K Unit), by Application 2024 & 2032
- Figure 77: GCC Handheld Ultrasound Devices Industry Revenue Share (%), by Application 2024 & 2032
- Figure 78: GCC Handheld Ultrasound Devices Industry Volume Share (%), by Application 2024 & 2032
- Figure 79: GCC Handheld Ultrasound Devices Industry Revenue (Million), by Country 2024 & 2032
- Figure 80: GCC Handheld Ultrasound Devices Industry Volume (K Unit), by Country 2024 & 2032
- Figure 81: GCC Handheld Ultrasound Devices Industry Revenue Share (%), by Country 2024 & 2032
- Figure 82: GCC Handheld Ultrasound Devices Industry Volume Share (%), by Country 2024 & 2032
- Figure 83: South America Handheld Ultrasound Devices Industry Revenue (Million), by Type of Device 2024 & 2032
- Figure 84: South America Handheld Ultrasound Devices Industry Volume (K Unit), by Type of Device 2024 & 2032
- Figure 85: South America Handheld Ultrasound Devices Industry Revenue Share (%), by Type of Device 2024 & 2032
- Figure 86: South America Handheld Ultrasound Devices Industry Volume Share (%), by Type of Device 2024 & 2032
- Figure 87: South America Handheld Ultrasound Devices Industry Revenue (Million), by Application 2024 & 2032
- Figure 88: South America Handheld Ultrasound Devices Industry Volume (K Unit), by Application 2024 & 2032
- Figure 89: South America Handheld Ultrasound Devices Industry Revenue Share (%), by Application 2024 & 2032
- Figure 90: South America Handheld Ultrasound Devices Industry Volume Share (%), by Application 2024 & 2032
- Figure 91: South America Handheld Ultrasound Devices Industry Revenue (Million), by Country 2024 & 2032
- Figure 92: South America Handheld Ultrasound Devices Industry Volume (K Unit), by Country 2024 & 2032
- Figure 93: South America Handheld Ultrasound Devices Industry Revenue Share (%), by Country 2024 & 2032
- Figure 94: South America Handheld Ultrasound Devices Industry Volume Share (%), by Country 2024 & 2032
List of Tables
- Table 1: Global Handheld Ultrasound Devices Industry Revenue Million Forecast, by Region 2019 & 2032
- Table 2: Global Handheld Ultrasound Devices Industry Volume K Unit Forecast, by Region 2019 & 2032
- Table 3: Global Handheld Ultrasound Devices Industry Revenue Million Forecast, by Type of Device 2019 & 2032
- Table 4: Global Handheld Ultrasound Devices Industry Volume K Unit Forecast, by Type of Device 2019 & 2032
- Table 5: Global Handheld Ultrasound Devices Industry Revenue Million Forecast, by Application 2019 & 2032
- Table 6: Global Handheld Ultrasound Devices Industry Volume K Unit Forecast, by Application 2019 & 2032
- Table 7: Global Handheld Ultrasound Devices Industry Revenue Million Forecast, by Region 2019 & 2032
- Table 8: Global Handheld Ultrasound Devices Industry Volume K Unit Forecast, by Region 2019 & 2032
- Table 9: Global Handheld Ultrasound Devices Industry Revenue Million Forecast, by Country 2019 & 2032
- Table 10: Global Handheld Ultrasound Devices Industry Volume K Unit Forecast, by Country 2019 & 2032
- Table 11: United States Handheld Ultrasound Devices Industry Revenue (Million) Forecast, by Application 2019 & 2032
- Table 12: United States Handheld Ultrasound Devices Industry Volume (K Unit) Forecast, by Application 2019 & 2032
- Table 13: Canada Handheld Ultrasound Devices Industry Revenue (Million) Forecast, by Application 2019 & 2032
- Table 14: Canada Handheld Ultrasound Devices Industry Volume (K Unit) Forecast, by Application 2019 & 2032
- Table 15: Mexico Handheld Ultrasound Devices Industry Revenue (Million) Forecast, by Application 2019 & 2032
- Table 16: Mexico Handheld Ultrasound Devices Industry Volume (K Unit) Forecast, by Application 2019 & 2032
- Table 17: Global Handheld Ultrasound Devices Industry Revenue Million Forecast, by Country 2019 & 2032
- Table 18: Global Handheld Ultrasound Devices Industry Volume K Unit Forecast, by Country 2019 & 2032
- Table 19: Germany Handheld Ultrasound Devices Industry Revenue (Million) Forecast, by Application 2019 & 2032
- Table 20: Germany Handheld Ultrasound Devices Industry Volume (K Unit) Forecast, by Application 2019 & 2032
- Table 21: United Kingdom Handheld Ultrasound Devices Industry Revenue (Million) Forecast, by Application 2019 & 2032
- Table 22: United Kingdom Handheld Ultrasound Devices Industry Volume (K Unit) Forecast, by Application 2019 & 2032
- Table 23: France Handheld Ultrasound Devices Industry Revenue (Million) Forecast, by Application 2019 & 2032
- Table 24: France Handheld Ultrasound Devices Industry Volume (K Unit) Forecast, by Application 2019 & 2032
- Table 25: Italy Handheld Ultrasound Devices Industry Revenue (Million) Forecast, by Application 2019 & 2032
- Table 26: Italy Handheld Ultrasound Devices Industry Volume (K Unit) Forecast, by Application 2019 & 2032
- Table 27: Spain Handheld Ultrasound Devices Industry Revenue (Million) Forecast, by Application 2019 & 2032
- Table 28: Spain Handheld Ultrasound Devices Industry Volume (K Unit) Forecast, by Application 2019 & 2032
- Table 29: Rest of Europe Handheld Ultrasound Devices Industry Revenue (Million) Forecast, by Application 2019 & 2032
- Table 30: Rest of Europe Handheld Ultrasound Devices Industry Volume (K Unit) Forecast, by Application 2019 & 2032
- Table 31: Global Handheld Ultrasound Devices Industry Revenue Million Forecast, by Country 2019 & 2032
- Table 32: Global Handheld Ultrasound Devices Industry Volume K Unit Forecast, by Country 2019 & 2032
- Table 33: China Handheld Ultrasound Devices Industry Revenue (Million) Forecast, by Application 2019 & 2032
- Table 34: China Handheld Ultrasound Devices Industry Volume (K Unit) Forecast, by Application 2019 & 2032
- Table 35: Japan Handheld Ultrasound Devices Industry Revenue (Million) Forecast, by Application 2019 & 2032
- Table 36: Japan Handheld Ultrasound Devices Industry Volume (K Unit) Forecast, by Application 2019 & 2032
- Table 37: India Handheld Ultrasound Devices Industry Revenue (Million) Forecast, by Application 2019 & 2032
- Table 38: India Handheld Ultrasound Devices Industry Volume (K Unit) Forecast, by Application 2019 & 2032
- Table 39: Australia Handheld Ultrasound Devices Industry Revenue (Million) Forecast, by Application 2019 & 2032
- Table 40: Australia Handheld Ultrasound Devices Industry Volume (K Unit) Forecast, by Application 2019 & 2032
- Table 41: South Korea Handheld Ultrasound Devices Industry Revenue (Million) Forecast, by Application 2019 & 2032
- Table 42: South Korea Handheld Ultrasound Devices Industry Volume (K Unit) Forecast, by Application 2019 & 2032
- Table 43: Rest of Asia Pacific Handheld Ultrasound Devices Industry Revenue (Million) Forecast, by Application 2019 & 2032
- Table 44: Rest of Asia Pacific Handheld Ultrasound Devices Industry Volume (K Unit) Forecast, by Application 2019 & 2032
- Table 45: Global Handheld Ultrasound Devices Industry Revenue Million Forecast, by Country 2019 & 2032
- Table 46: Global Handheld Ultrasound Devices Industry Volume K Unit Forecast, by Country 2019 & 2032
- Table 47: South Africa Handheld Ultrasound Devices Industry Revenue (Million) Forecast, by Application 2019 & 2032
- Table 48: South Africa Handheld Ultrasound Devices Industry Volume (K Unit) Forecast, by Application 2019 & 2032
- Table 49: Rest of Middle East Handheld Ultrasound Devices Industry Revenue (Million) Forecast, by Application 2019 & 2032
- Table 50: Rest of Middle East Handheld Ultrasound Devices Industry Volume (K Unit) Forecast, by Application 2019 & 2032
- Table 51: Global Handheld Ultrasound Devices Industry Revenue Million Forecast, by Country 2019 & 2032
- Table 52: Global Handheld Ultrasound Devices Industry Volume K Unit Forecast, by Country 2019 & 2032
- Table 53: Brazil Handheld Ultrasound Devices Industry Revenue (Million) Forecast, by Application 2019 & 2032
- Table 54: Brazil Handheld Ultrasound Devices Industry Volume (K Unit) Forecast, by Application 2019 & 2032
- Table 55: Argentina Handheld Ultrasound Devices Industry Revenue (Million) Forecast, by Application 2019 & 2032
- Table 56: Argentina Handheld Ultrasound Devices Industry Volume (K Unit) Forecast, by Application 2019 & 2032
- Table 57: Rest of South America Handheld Ultrasound Devices Industry Revenue (Million) Forecast, by Application 2019 & 2032
- Table 58: Rest of South America Handheld Ultrasound Devices Industry Volume (K Unit) Forecast, by Application 2019 & 2032
- Table 59: Global Handheld Ultrasound Devices Industry Revenue Million Forecast, by Type of Device 2019 & 2032
- Table 60: Global Handheld Ultrasound Devices Industry Volume K Unit Forecast, by Type of Device 2019 & 2032
- Table 61: Global Handheld Ultrasound Devices Industry Revenue Million Forecast, by Application 2019 & 2032
- Table 62: Global Handheld Ultrasound Devices Industry Volume K Unit Forecast, by Application 2019 & 2032
- Table 63: Global Handheld Ultrasound Devices Industry Revenue Million Forecast, by Country 2019 & 2032
- Table 64: Global Handheld Ultrasound Devices Industry Volume K Unit Forecast, by Country 2019 & 2032
- Table 65: United States Handheld Ultrasound Devices Industry Revenue (Million) Forecast, by Application 2019 & 2032
- Table 66: United States Handheld Ultrasound Devices Industry Volume (K Unit) Forecast, by Application 2019 & 2032
- Table 67: Canada Handheld Ultrasound Devices Industry Revenue (Million) Forecast, by Application 2019 & 2032
- Table 68: Canada Handheld Ultrasound Devices Industry Volume (K Unit) Forecast, by Application 2019 & 2032
- Table 69: Mexico Handheld Ultrasound Devices Industry Revenue (Million) Forecast, by Application 2019 & 2032
- Table 70: Mexico Handheld Ultrasound Devices Industry Volume (K Unit) Forecast, by Application 2019 & 2032
- Table 71: Global Handheld Ultrasound Devices Industry Revenue Million Forecast, by Type of Device 2019 & 2032
- Table 72: Global Handheld Ultrasound Devices Industry Volume K Unit Forecast, by Type of Device 2019 & 2032
- Table 73: Global Handheld Ultrasound Devices Industry Revenue Million Forecast, by Application 2019 & 2032
- Table 74: Global Handheld Ultrasound Devices Industry Volume K Unit Forecast, by Application 2019 & 2032
- Table 75: Global Handheld Ultrasound Devices Industry Revenue Million Forecast, by Country 2019 & 2032
- Table 76: Global Handheld Ultrasound Devices Industry Volume K Unit Forecast, by Country 2019 & 2032
- Table 77: Germany Handheld Ultrasound Devices Industry Revenue (Million) Forecast, by Application 2019 & 2032
- Table 78: Germany Handheld Ultrasound Devices Industry Volume (K Unit) Forecast, by Application 2019 & 2032
- Table 79: United Kingdom Handheld Ultrasound Devices Industry Revenue (Million) Forecast, by Application 2019 & 2032
- Table 80: United Kingdom Handheld Ultrasound Devices Industry Volume (K Unit) Forecast, by Application 2019 & 2032
- Table 81: France Handheld Ultrasound Devices Industry Revenue (Million) Forecast, by Application 2019 & 2032
- Table 82: France Handheld Ultrasound Devices Industry Volume (K Unit) Forecast, by Application 2019 & 2032
- Table 83: Italy Handheld Ultrasound Devices Industry Revenue (Million) Forecast, by Application 2019 & 2032
- Table 84: Italy Handheld Ultrasound Devices Industry Volume (K Unit) Forecast, by Application 2019 & 2032
- Table 85: Spain Handheld Ultrasound Devices Industry Revenue (Million) Forecast, by Application 2019 & 2032
- Table 86: Spain Handheld Ultrasound Devices Industry Volume (K Unit) Forecast, by Application 2019 & 2032
- Table 87: Rest of Europe Handheld Ultrasound Devices Industry Revenue (Million) Forecast, by Application 2019 & 2032
- Table 88: Rest of Europe Handheld Ultrasound Devices Industry Volume (K Unit) Forecast, by Application 2019 & 2032
- Table 89: Global Handheld Ultrasound Devices Industry Revenue Million Forecast, by Type of Device 2019 & 2032
- Table 90: Global Handheld Ultrasound Devices Industry Volume K Unit Forecast, by Type of Device 2019 & 2032
- Table 91: Global Handheld Ultrasound Devices Industry Revenue Million Forecast, by Application 2019 & 2032
- Table 92: Global Handheld Ultrasound Devices Industry Volume K Unit Forecast, by Application 2019 & 2032
- Table 93: Global Handheld Ultrasound Devices Industry Revenue Million Forecast, by Country 2019 & 2032
- Table 94: Global Handheld Ultrasound Devices Industry Volume K Unit Forecast, by Country 2019 & 2032
- Table 95: China Handheld Ultrasound Devices Industry Revenue (Million) Forecast, by Application 2019 & 2032
- Table 96: China Handheld Ultrasound Devices Industry Volume (K Unit) Forecast, by Application 2019 & 2032
- Table 97: Japan Handheld Ultrasound Devices Industry Revenue (Million) Forecast, by Application 2019 & 2032
- Table 98: Japan Handheld Ultrasound Devices Industry Volume (K Unit) Forecast, by Application 2019 & 2032
- Table 99: India Handheld Ultrasound Devices Industry Revenue (Million) Forecast, by Application 2019 & 2032
- Table 100: India Handheld Ultrasound Devices Industry Volume (K Unit) Forecast, by Application 2019 & 2032
- Table 101: Australia Handheld Ultrasound Devices Industry Revenue (Million) Forecast, by Application 2019 & 2032
- Table 102: Australia Handheld Ultrasound Devices Industry Volume (K Unit) Forecast, by Application 2019 & 2032
- Table 103: South Korea Handheld Ultrasound Devices Industry Revenue (Million) Forecast, by Application 2019 & 2032
- Table 104: South Korea Handheld Ultrasound Devices Industry Volume (K Unit) Forecast, by Application 2019 & 2032
- Table 105: Rest of Asia Pacific Handheld Ultrasound Devices Industry Revenue (Million) Forecast, by Application 2019 & 2032
- Table 106: Rest of Asia Pacific Handheld Ultrasound Devices Industry Volume (K Unit) Forecast, by Application 2019 & 2032
- Table 107: Global Handheld Ultrasound Devices Industry Revenue Million Forecast, by Type of Device 2019 & 2032
- Table 108: Global Handheld Ultrasound Devices Industry Volume K Unit Forecast, by Type of Device 2019 & 2032
- Table 109: Global Handheld Ultrasound Devices Industry Revenue Million Forecast, by Application 2019 & 2032
- Table 110: Global Handheld Ultrasound Devices Industry Volume K Unit Forecast, by Application 2019 & 2032
- Table 111: Global Handheld Ultrasound Devices Industry Revenue Million Forecast, by Country 2019 & 2032
- Table 112: Global Handheld Ultrasound Devices Industry Volume K Unit Forecast, by Country 2019 & 2032
- Table 113: Global Handheld Ultrasound Devices Industry Revenue Million Forecast, by Type of Device 2019 & 2032
- Table 114: Global Handheld Ultrasound Devices Industry Volume K Unit Forecast, by Type of Device 2019 & 2032
- Table 115: Global Handheld Ultrasound Devices Industry Revenue Million Forecast, by Application 2019 & 2032
- Table 116: Global Handheld Ultrasound Devices Industry Volume K Unit Forecast, by Application 2019 & 2032
- Table 117: Global Handheld Ultrasound Devices Industry Revenue Million Forecast, by Country 2019 & 2032
- Table 118: Global Handheld Ultrasound Devices Industry Volume K Unit Forecast, by Country 2019 & 2032
- Table 119: South Africa Handheld Ultrasound Devices Industry Revenue (Million) Forecast, by Application 2019 & 2032
- Table 120: South Africa Handheld Ultrasound Devices Industry Volume (K Unit) Forecast, by Application 2019 & 2032
- Table 121: Rest of Middle East Handheld Ultrasound Devices Industry Revenue (Million) Forecast, by Application 2019 & 2032
- Table 122: Rest of Middle East Handheld Ultrasound Devices Industry Volume (K Unit) Forecast, by Application 2019 & 2032
- Table 123: Global Handheld Ultrasound Devices Industry Revenue Million Forecast, by Type of Device 2019 & 2032
- Table 124: Global Handheld Ultrasound Devices Industry Volume K Unit Forecast, by Type of Device 2019 & 2032
- Table 125: Global Handheld Ultrasound Devices Industry Revenue Million Forecast, by Application 2019 & 2032
- Table 126: Global Handheld Ultrasound Devices Industry Volume K Unit Forecast, by Application 2019 & 2032
- Table 127: Global Handheld Ultrasound Devices Industry Revenue Million Forecast, by Country 2019 & 2032
- Table 128: Global Handheld Ultrasound Devices Industry Volume K Unit Forecast, by Country 2019 & 2032
- Table 129: Brazil Handheld Ultrasound Devices Industry Revenue (Million) Forecast, by Application 2019 & 2032
- Table 130: Brazil Handheld Ultrasound Devices Industry Volume (K Unit) Forecast, by Application 2019 & 2032
- Table 131: Argentina Handheld Ultrasound Devices Industry Revenue (Million) Forecast, by Application 2019 & 2032
- Table 132: Argentina Handheld Ultrasound Devices Industry Volume (K Unit) Forecast, by Application 2019 & 2032
- Table 133: Rest of South America Handheld Ultrasound Devices Industry Revenue (Million) Forecast, by Application 2019 & 2032
- Table 134: Rest of South America Handheld Ultrasound Devices Industry Volume (K Unit) Forecast, by Application 2019 & 2032
Frequently Asked Questions
1. What is the projected Compound Annual Growth Rate (CAGR) of the Handheld Ultrasound Devices Industry?
The projected CAGR is approximately 6.23%.
2. Which companies are prominent players in the Handheld Ultrasound Devices Industry?
Key companies in the market include Fukuda Denshi Co Ltd, Siemens Healthineers, GE Healthcare, Hitachi Ltd, Koninklijke Philips NV, Fujifilm SonoSite Inc, Canon Medical Systems Corporation, Shenzhen Mindray, Samsung Healthcare.
3. What are the main segments of the Handheld Ultrasound Devices Industry?
The market segments include Type of Device, Application.
4. Can you provide details about the market size?
The market size is estimated to be USD 2.86 Million as of 2022.
5. What are some drivers contributing to market growth?
; Increasing Spectrum of Applications of Portable Ultrasound; Rising Advancements in Technology; Increasing Prevalence of Chronic Diseases.
6. What are the notable trends driving market growth?
Mobile Ultrasound Devices is Expected to Grow with High CAGR Over the Forecast Period.
7. Are there any restraints impacting market growth?
; High Cost of Portable Ultrasound Systems; Lack of Dedicated Training Programs by Companies.
8. Can you provide examples of recent developments in the market?
N/A
9. What pricing options are available for accessing the report?
Pricing options include single-user, multi-user, and enterprise licenses priced at USD 4750, USD 5250, and USD 8750 respectively.
10. Is the market size provided in terms of value or volume?
The market size is provided in terms of value, measured in Million and volume, measured in K Unit.
11. Are there any specific market keywords associated with the report?
Yes, the market keyword associated with the report is "Handheld Ultrasound Devices Industry," which aids in identifying and referencing the specific market segment covered.
12. How do I determine which pricing option suits my needs best?
The pricing options vary based on user requirements and access needs. Individual users may opt for single-user licenses, while businesses requiring broader access may choose multi-user or enterprise licenses for cost-effective access to the report.
13. Are there any additional resources or data provided in the Handheld Ultrasound Devices Industry report?
While the report offers comprehensive insights, it's advisable to review the specific contents or supplementary materials provided to ascertain if additional resources or data are available.
14. How can I stay updated on further developments or reports in the Handheld Ultrasound Devices Industry?
To stay informed about further developments, trends, and reports in the Handheld Ultrasound Devices Industry, consider subscribing to industry newsletters, following relevant companies and organizations, or regularly checking reputable industry news sources and publications.
Methodology
Step 1 - Identification of Relevant Samples Size from Population Database


Step 2 - Approaches for Defining Global Market Size (Value, Volume* & Price*)

Note*: In applicable scenarios
Step 3 - Data Sources
Primary Research
- Web Analytics
- Survey Reports
- Research Institute
- Latest Research Reports
- Opinion Leaders
Secondary Research
- Annual Reports
- White Paper
- Latest Press Release
- Industry Association
- Paid Database
- Investor Presentations

Step 4 - Data Triangulation
Involves using different sources of information in order to increase the validity of a study
These sources are likely to be stakeholders in a program - participants, other researchers, program staff, other community members, and so on.
Then we put all data in single framework & apply various statistical tools to find out the dynamic on the market.
During the analysis stage, feedback from the stakeholder groups would be compared to determine areas of agreement as well as areas of divergence


