
Key Insights
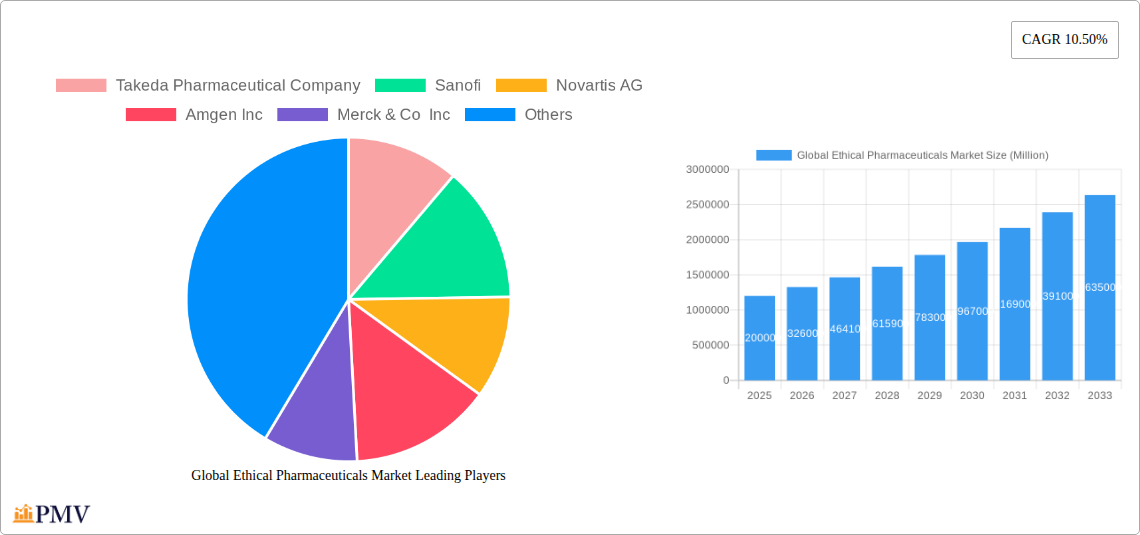
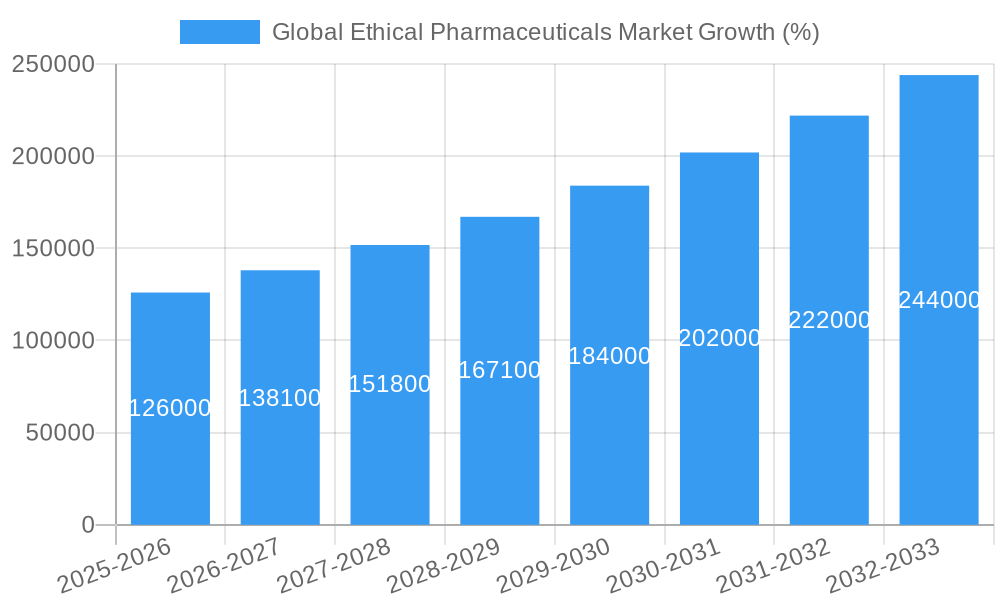
The global ethical pharmaceuticals market, valued at approximately $1.2 trillion in 2025, is projected to experience robust growth, exhibiting a compound annual growth rate (CAGR) of 10.5% from 2025 to 2033. This expansion is driven by several key factors. Firstly, the aging global population necessitates increased demand for chronic disease management medications, particularly within segments like lipid regulators, ACE inhibitors, and respiratory agents. Secondly, rising healthcare expenditure and improved access to healthcare in developing economies fuel market growth. Technological advancements in drug discovery and development, leading to innovative therapies and personalized medicine approaches, further contribute to market expansion. Finally, a growing awareness of health and wellness among consumers, coupled with increased preventative healthcare measures, stimulates demand for ethical pharmaceuticals.
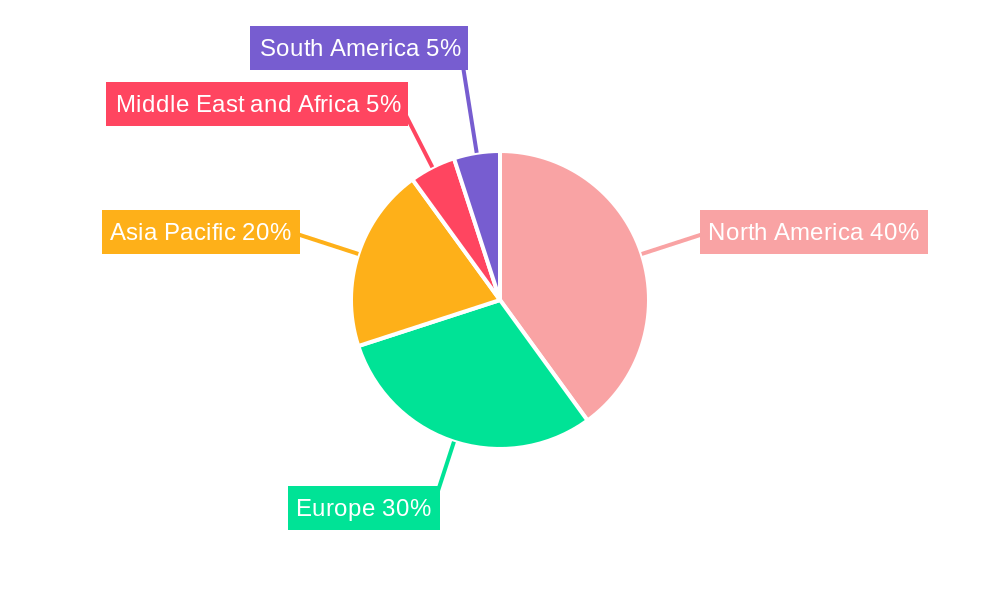
However, the market also faces certain challenges. Stringent regulatory approvals and increasing research and development costs can hinder market entry for new drugs. Furthermore, the growing prevalence of generic drugs and biosimilars poses a competitive threat to innovator pharmaceutical companies. The market is segmented by drug class (with lipid regulators, ACE inhibitors, and respiratory agents representing significant portions), application (hospitals and clinics dominating), and geography, with North America and Europe currently holding the largest market shares. Major players such as Takeda, Sanofi, Novartis, and Pfizer are actively engaged in research and development, strategic acquisitions, and expansion into emerging markets to maintain a competitive edge. The forecast period anticipates continued growth, driven by the factors discussed above, although the rate of growth may fluctuate slightly year-on-year due to economic conditions and regulatory changes.
Global Ethical Pharmaceuticals Market: A Comprehensive Report (2019-2033)
This detailed report provides a comprehensive analysis of the Global Ethical Pharmaceuticals Market, offering invaluable insights for stakeholders across the pharmaceutical industry. The study period covers 2019-2033, with 2025 as the base and estimated year, and a forecast period of 2025-2033. The historical period analyzed is 2019-2024. The report delves into market segmentation, competitive dynamics, industry trends, and future growth prospects, with a focus on key players and significant market developments. The market size is projected to reach xx Million by 2033, exhibiting a CAGR of xx% during the forecast period.
Global Ethical Pharmaceuticals Market Market Structure & Competitive Dynamics
This section analyzes the competitive landscape of the global ethical pharmaceuticals market, examining market concentration, innovation ecosystems, regulatory frameworks, product substitutes, end-user trends, and M&A activities. The market is characterized by a concentrated structure, with a few multinational pharmaceutical companies holding significant market share. For example, the top 5 players – Takeda Pharmaceutical Company, Sanofi, Novartis AG, Amgen Inc, and Merck & Co Inc – collectively account for approximately xx% of the global market in 2025.
- Market Concentration: High, with the top 10 players controlling over 60% of the market.
- Innovation Ecosystems: Robust R&D investments driving continuous innovation in drug discovery and development.
- Regulatory Frameworks: Stringent regulations impacting drug approvals and market entry.
- Product Substitutes: Generics and biosimilars posing competitive pressure on branded drugs.
- End-User Trends: Growing demand for specialized therapies and personalized medicine.
- M&A Activities: Significant M&A activity in the past five years, with deal values exceeding xx Million in aggregate. Examples include [Insert specific examples of M&A deals with values if available, otherwise use "Several large-scale mergers and acquisitions have reshaped the market landscape"].
Global Ethical Pharmaceuticals Market Industry Trends & Insights
This section explores key industry trends influencing the global ethical pharmaceuticals market. The market is driven by factors such as increasing prevalence of chronic diseases, aging global population, rising healthcare expenditure, and technological advancements in drug discovery and development. The market experienced significant growth in the historical period, with a CAGR of xx%. This growth is projected to continue during the forecast period, driven by factors such as the rising prevalence of chronic diseases like diabetes and cardiovascular diseases, increasing demand for innovative therapies, and expansion of healthcare infrastructure in emerging markets. The market penetration of new drugs is expected to be xx% by 2033. Technological disruptions, such as advancements in gene editing and personalized medicine, are creating new opportunities for growth while also posing challenges to established players. Consumer preferences are shifting towards more personalized and convenient healthcare solutions, which is driving innovation in drug delivery systems and digital health technologies. The competitive dynamics are marked by intense rivalry amongst major pharmaceutical companies, leading to strategic alliances, partnerships, and acquisitions.
Dominant Markets & Segments in Global Ethical Pharmaceuticals Market
This section identifies the dominant markets and segments within the global ethical pharmaceuticals market. Based on the analysis, the Respiratory Agents segment is projected as the largest drug class segment in 2025, driven by increasing prevalence of respiratory diseases such as asthma and COPD. Geographically, North America held the largest market share in 2025, primarily due to high healthcare expenditure and advanced healthcare infrastructure.
Leading Segments:
- Drug Class: Respiratory Agents (xx Million), Lipid Regulators (xx Million), Others (xx Million)
- Application: Hospitals and Clinics (xx Million), Others (Pharmaceutical Company, Contract Drug Manufacturing Organization) (xx Million)
Key Drivers for Dominant Segments/Regions:
- Respiratory Agents: High prevalence of respiratory illnesses, robust R&D pipeline for new treatments.
- North America: High healthcare spending, advanced healthcare infrastructure, favorable regulatory environment.
- Hospitals & Clinics: High concentration of patients requiring specialized care.
Global Ethical Pharmaceuticals Market Product Innovations
Recent product innovations are focusing on targeted therapies, personalized medicine, and improved drug delivery systems. This includes advancements in biosimilars, targeted cancer therapies, and improved formulations for better patient compliance. These innovations are aimed at addressing unmet medical needs and enhancing treatment efficacy and safety, leading to improved market fit and competitive advantages.
Report Segmentation & Scope
This report segments the Global Ethical Pharmaceuticals Market by drug class (Lipid Regulators, ACE Inhibitors, Respiratory Agents, Narcotic Analgesics, Diuretics, Calcium Antagonists, Hormonal Contraceptives, Others) and application (Hospitals and Clinics, Others). Each segment is analyzed based on its market size, growth projections, and competitive dynamics. The report provides detailed insights into the market opportunities and challenges associated with each segment. For example, the Respiratory Agents segment is expected to witness significant growth due to the rising prevalence of respiratory diseases and the development of innovative therapies, while the Others segment offers opportunities for niche players specializing in specific therapeutic areas. Similarly, the Hospitals and Clinics segment is expected to grow due to increasing hospital admissions for various illnesses, while the Contract Drug Manufacturing Organization segment presents opportunities for specialized manufacturing capabilities.
Key Drivers of Global Ethical Pharmaceuticals Market Growth
Several key factors are driving the growth of the Global Ethical Pharmaceuticals Market. These include increasing prevalence of chronic diseases, an aging global population, rising healthcare expenditure, technological advancements in drug discovery, and supportive government initiatives. Furthermore, the growing adoption of innovative drug delivery systems and personalized medicine approaches is further fueling market expansion.
Challenges in the Global Ethical Pharmaceuticals Market Sector
The Global Ethical Pharmaceuticals Market faces several challenges, including stringent regulatory approvals, high R&D costs, increasing generic competition, and the complexities of managing global supply chains. Patent expirations on blockbuster drugs contribute to pricing pressures, while the increasing prevalence of counterfeit drugs poses a significant threat to market integrity. These factors are creating pressure on profit margins and hindering market growth.
Leading Players in the Global Ethical Pharmaceuticals Market Market
- Takeda Pharmaceutical Company
- Sanofi
- Novartis AG
- Amgen Inc
- Merck & Co Inc
- F Hoffmann-La Roche Ltd
- GlaxoSmithKline plc
- Otsuka Holdings
- Abbott Laboratories
- Eli Lilly and Company
- Teva Pharmaceutical Industries Ltd
- AbbVie Inc
- Johnson & Johnson
- Pfizer Inc
Key Developments in Global Ethical Pharmaceuticals Market Sector
- March 2022: The United States Food and Drug Administration approved a generic Symbicort inhalation aerosol, expanding treatment options for pulmonary conditions and increasing competition in this segment.
- February 2022: The FDA approved Jardiance (empagliflozin) 10 mg for heart failure, broadening the drug's application and potentially increasing its market share.
Strategic Global Ethical Pharmaceuticals Market Market Outlook
The future of the Global Ethical Pharmaceuticals Market looks promising, driven by ongoing innovation, expanding healthcare infrastructure, and the growing burden of chronic diseases globally. Strategic opportunities exist in developing targeted therapies, personalized medicine approaches, and innovative drug delivery systems. Companies that can successfully navigate the regulatory landscape and adapt to evolving consumer preferences will be well-positioned for future growth.
Global Ethical Pharmaceuticals Market Segmentation
-
1. Drug Class
- 1.1. Lipid Regulators
- 1.2. ACE Inhibitors
- 1.3. Respiratory Agents
- 1.4. Narcotic Analgesics
- 1.5. Diuretics
- 1.6. Calcium Antagonists
- 1.7. Hormonal Contraceptives
- 1.8. Others
-
2. Application
- 2.1. Hospitals and Clinics
- 2.2. Others (
Global Ethical Pharmaceuticals Market Segmentation By Geography
-
1. North America
- 1.1. United States
- 1.2. Canada
- 1.3. Mexico
-
2. Europe
- 2.1. Germany
- 2.2. United Kingdom
- 2.3. France
- 2.4. Italy
- 2.5. Spain
- 2.6. Rest of Europe
-
3. Asia Pacific
- 3.1. China
- 3.2. Japan
- 3.3. India
- 3.4. Australia
- 3.5. South Korea
- 3.6. Rest of Asia Pacific
-
4. Middle East and Africa
- 4.1. GCC
- 4.2. South Africa
- 4.3. Rest of Middle East and Africa
-
5. South America
- 5.1. Brazil
- 5.2. Argentina
- 5.3. Rest of South America
Global Ethical Pharmaceuticals Market REPORT HIGHLIGHTS
| Aspects | Details |
|---|---|
| Study Period | 2019-2033 |
| Base Year | 2024 |
| Estimated Year | 2025 |
| Forecast Period | 2025-2033 |
| Historical Period | 2019-2024 |
| Growth Rate | CAGR of 10.50% from 2019-2033 |
| Segmentation |
|
Table of Contents
- 1. Introduction
- 1.1. Research Scope
- 1.2. Market Segmentation
- 1.3. Research Methodology
- 1.4. Definitions and Assumptions
- 2. Executive Summary
- 2.1. Introduction
- 3. Market Dynamics
- 3.1. Introduction
- 3.2. Market Drivers
- 3.2.1. Rising Burden of Chronic Diseases and Increase in Geriatric Population; Rise in Research Activities For the Development of Novel Ethical Medicines
- 3.3. Market Restrains
- 3.3.1. Patent Expiry of Current Ethical Pharmaceuticals; Lengthy Approval Process
- 3.4. Market Trends
- 3.4.1. Hospitals and Clinics Segment Is Expected To Hold A Major Share In The Market Over The Forecast Period.
- 4. Market Factor Analysis
- 4.1. Porters Five Forces
- 4.2. Supply/Value Chain
- 4.3. PESTEL analysis
- 4.4. Market Entropy
- 4.5. Patent/Trademark Analysis
- 5. Global Ethical Pharmaceuticals Market Analysis, Insights and Forecast, 2019-2031
- 5.1. Market Analysis, Insights and Forecast - by Drug Class
- 5.1.1. Lipid Regulators
- 5.1.2. ACE Inhibitors
- 5.1.3. Respiratory Agents
- 5.1.4. Narcotic Analgesics
- 5.1.5. Diuretics
- 5.1.6. Calcium Antagonists
- 5.1.7. Hormonal Contraceptives
- 5.1.8. Others
- 5.2. Market Analysis, Insights and Forecast - by Application
- 5.2.1. Hospitals and Clinics
- 5.2.2. Others (
- 5.3. Market Analysis, Insights and Forecast - by Region
- 5.3.1. North America
- 5.3.2. Europe
- 5.3.3. Asia Pacific
- 5.3.4. Middle East and Africa
- 5.3.5. South America
- 5.1. Market Analysis, Insights and Forecast - by Drug Class
- 6. North America Global Ethical Pharmaceuticals Market Analysis, Insights and Forecast, 2019-2031
- 6.1. Market Analysis, Insights and Forecast - by Drug Class
- 6.1.1. Lipid Regulators
- 6.1.2. ACE Inhibitors
- 6.1.3. Respiratory Agents
- 6.1.4. Narcotic Analgesics
- 6.1.5. Diuretics
- 6.1.6. Calcium Antagonists
- 6.1.7. Hormonal Contraceptives
- 6.1.8. Others
- 6.2. Market Analysis, Insights and Forecast - by Application
- 6.2.1. Hospitals and Clinics
- 6.2.2. Others (
- 6.1. Market Analysis, Insights and Forecast - by Drug Class
- 7. Europe Global Ethical Pharmaceuticals Market Analysis, Insights and Forecast, 2019-2031
- 7.1. Market Analysis, Insights and Forecast - by Drug Class
- 7.1.1. Lipid Regulators
- 7.1.2. ACE Inhibitors
- 7.1.3. Respiratory Agents
- 7.1.4. Narcotic Analgesics
- 7.1.5. Diuretics
- 7.1.6. Calcium Antagonists
- 7.1.7. Hormonal Contraceptives
- 7.1.8. Others
- 7.2. Market Analysis, Insights and Forecast - by Application
- 7.2.1. Hospitals and Clinics
- 7.2.2. Others (
- 7.1. Market Analysis, Insights and Forecast - by Drug Class
- 8. Asia Pacific Global Ethical Pharmaceuticals Market Analysis, Insights and Forecast, 2019-2031
- 8.1. Market Analysis, Insights and Forecast - by Drug Class
- 8.1.1. Lipid Regulators
- 8.1.2. ACE Inhibitors
- 8.1.3. Respiratory Agents
- 8.1.4. Narcotic Analgesics
- 8.1.5. Diuretics
- 8.1.6. Calcium Antagonists
- 8.1.7. Hormonal Contraceptives
- 8.1.8. Others
- 8.2. Market Analysis, Insights and Forecast - by Application
- 8.2.1. Hospitals and Clinics
- 8.2.2. Others (
- 8.1. Market Analysis, Insights and Forecast - by Drug Class
- 9. Middle East and Africa Global Ethical Pharmaceuticals Market Analysis, Insights and Forecast, 2019-2031
- 9.1. Market Analysis, Insights and Forecast - by Drug Class
- 9.1.1. Lipid Regulators
- 9.1.2. ACE Inhibitors
- 9.1.3. Respiratory Agents
- 9.1.4. Narcotic Analgesics
- 9.1.5. Diuretics
- 9.1.6. Calcium Antagonists
- 9.1.7. Hormonal Contraceptives
- 9.1.8. Others
- 9.2. Market Analysis, Insights and Forecast - by Application
- 9.2.1. Hospitals and Clinics
- 9.2.2. Others (
- 9.1. Market Analysis, Insights and Forecast - by Drug Class
- 10. South America Global Ethical Pharmaceuticals Market Analysis, Insights and Forecast, 2019-2031
- 10.1. Market Analysis, Insights and Forecast - by Drug Class
- 10.1.1. Lipid Regulators
- 10.1.2. ACE Inhibitors
- 10.1.3. Respiratory Agents
- 10.1.4. Narcotic Analgesics
- 10.1.5. Diuretics
- 10.1.6. Calcium Antagonists
- 10.1.7. Hormonal Contraceptives
- 10.1.8. Others
- 10.2. Market Analysis, Insights and Forecast - by Application
- 10.2.1. Hospitals and Clinics
- 10.2.2. Others (
- 10.1. Market Analysis, Insights and Forecast - by Drug Class
- 11. North America Global Ethical Pharmaceuticals Market Analysis, Insights and Forecast, 2019-2031
- 11.1. Market Analysis, Insights and Forecast - By Country/Sub-region
- 11.1.1 United States
- 11.1.2 Canada
- 11.1.3 Mexico
- 12. Europe Global Ethical Pharmaceuticals Market Analysis, Insights and Forecast, 2019-2031
- 12.1. Market Analysis, Insights and Forecast - By Country/Sub-region
- 12.1.1 Germany
- 12.1.2 United Kingdom
- 12.1.3 France
- 12.1.4 Italy
- 12.1.5 Spain
- 12.1.6 Rest of Europe
- 13. Asia Pacific Global Ethical Pharmaceuticals Market Analysis, Insights and Forecast, 2019-2031
- 13.1. Market Analysis, Insights and Forecast - By Country/Sub-region
- 13.1.1 China
- 13.1.2 Japan
- 13.1.3 India
- 13.1.4 Australia
- 13.1.5 South Korea
- 13.1.6 Rest of Asia Pacific
- 14. Middle East and Africa Global Ethical Pharmaceuticals Market Analysis, Insights and Forecast, 2019-2031
- 14.1. Market Analysis, Insights and Forecast - By Country/Sub-region
- 14.1.1 GCC
- 14.1.2 South Africa
- 14.1.3 Rest of Middle East and Africa
- 15. South America Global Ethical Pharmaceuticals Market Analysis, Insights and Forecast, 2019-2031
- 15.1. Market Analysis, Insights and Forecast - By Country/Sub-region
- 15.1.1 Brazil
- 15.1.2 Argentina
- 15.1.3 Rest of South America
- 16. Competitive Analysis
- 16.1. Market Share Analysis 2024
- 16.2. Company Profiles
- 16.2.1 Takeda Pharmaceutical Company
- 16.2.1.1. Overview
- 16.2.1.2. Products
- 16.2.1.3. SWOT Analysis
- 16.2.1.4. Recent Developments
- 16.2.1.5. Financials (Based on Availability)
- 16.2.2 Sanofi
- 16.2.2.1. Overview
- 16.2.2.2. Products
- 16.2.2.3. SWOT Analysis
- 16.2.2.4. Recent Developments
- 16.2.2.5. Financials (Based on Availability)
- 16.2.3 Novartis AG
- 16.2.3.1. Overview
- 16.2.3.2. Products
- 16.2.3.3. SWOT Analysis
- 16.2.3.4. Recent Developments
- 16.2.3.5. Financials (Based on Availability)
- 16.2.4 Amgen Inc
- 16.2.4.1. Overview
- 16.2.4.2. Products
- 16.2.4.3. SWOT Analysis
- 16.2.4.4. Recent Developments
- 16.2.4.5. Financials (Based on Availability)
- 16.2.5 Merck & Co Inc
- 16.2.5.1. Overview
- 16.2.5.2. Products
- 16.2.5.3. SWOT Analysis
- 16.2.5.4. Recent Developments
- 16.2.5.5. Financials (Based on Availability)
- 16.2.6 F Hoffmann-La Roche Ltd
- 16.2.6.1. Overview
- 16.2.6.2. Products
- 16.2.6.3. SWOT Analysis
- 16.2.6.4. Recent Developments
- 16.2.6.5. Financials (Based on Availability)
- 16.2.7 GlaxoSmithKline plc
- 16.2.7.1. Overview
- 16.2.7.2. Products
- 16.2.7.3. SWOT Analysis
- 16.2.7.4. Recent Developments
- 16.2.7.5. Financials (Based on Availability)
- 16.2.8 Otsuka Holdings
- 16.2.8.1. Overview
- 16.2.8.2. Products
- 16.2.8.3. SWOT Analysis
- 16.2.8.4. Recent Developments
- 16.2.8.5. Financials (Based on Availability)
- 16.2.9 Abbott Laboratories
- 16.2.9.1. Overview
- 16.2.9.2. Products
- 16.2.9.3. SWOT Analysis
- 16.2.9.4. Recent Developments
- 16.2.9.5. Financials (Based on Availability)
- 16.2.10 Eli Lilly and Company
- 16.2.10.1. Overview
- 16.2.10.2. Products
- 16.2.10.3. SWOT Analysis
- 16.2.10.4. Recent Developments
- 16.2.10.5. Financials (Based on Availability)
- 16.2.11 Teva Pharmaceutical Industries Ltd
- 16.2.11.1. Overview
- 16.2.11.2. Products
- 16.2.11.3. SWOT Analysis
- 16.2.11.4. Recent Developments
- 16.2.11.5. Financials (Based on Availability)
- 16.2.12 AbbVie Inc
- 16.2.12.1. Overview
- 16.2.12.2. Products
- 16.2.12.3. SWOT Analysis
- 16.2.12.4. Recent Developments
- 16.2.12.5. Financials (Based on Availability)
- 16.2.13 Johnson & Johnson
- 16.2.13.1. Overview
- 16.2.13.2. Products
- 16.2.13.3. SWOT Analysis
- 16.2.13.4. Recent Developments
- 16.2.13.5. Financials (Based on Availability)
- 16.2.14 Pfizer Inc
- 16.2.14.1. Overview
- 16.2.14.2. Products
- 16.2.14.3. SWOT Analysis
- 16.2.14.4. Recent Developments
- 16.2.14.5. Financials (Based on Availability)
- 16.2.1 Takeda Pharmaceutical Company
List of Figures
- Figure 1: Global Global Ethical Pharmaceuticals Market Revenue Breakdown (Million, %) by Region 2024 & 2032
- Figure 2: Global Global Ethical Pharmaceuticals Market Volume Breakdown (K Unit, %) by Region 2024 & 2032
- Figure 3: North America Global Ethical Pharmaceuticals Market Revenue (Million), by Country 2024 & 2032
- Figure 4: North America Global Ethical Pharmaceuticals Market Volume (K Unit), by Country 2024 & 2032
- Figure 5: North America Global Ethical Pharmaceuticals Market Revenue Share (%), by Country 2024 & 2032
- Figure 6: North America Global Ethical Pharmaceuticals Market Volume Share (%), by Country 2024 & 2032
- Figure 7: Europe Global Ethical Pharmaceuticals Market Revenue (Million), by Country 2024 & 2032
- Figure 8: Europe Global Ethical Pharmaceuticals Market Volume (K Unit), by Country 2024 & 2032
- Figure 9: Europe Global Ethical Pharmaceuticals Market Revenue Share (%), by Country 2024 & 2032
- Figure 10: Europe Global Ethical Pharmaceuticals Market Volume Share (%), by Country 2024 & 2032
- Figure 11: Asia Pacific Global Ethical Pharmaceuticals Market Revenue (Million), by Country 2024 & 2032
- Figure 12: Asia Pacific Global Ethical Pharmaceuticals Market Volume (K Unit), by Country 2024 & 2032
- Figure 13: Asia Pacific Global Ethical Pharmaceuticals Market Revenue Share (%), by Country 2024 & 2032
- Figure 14: Asia Pacific Global Ethical Pharmaceuticals Market Volume Share (%), by Country 2024 & 2032
- Figure 15: Middle East and Africa Global Ethical Pharmaceuticals Market Revenue (Million), by Country 2024 & 2032
- Figure 16: Middle East and Africa Global Ethical Pharmaceuticals Market Volume (K Unit), by Country 2024 & 2032
- Figure 17: Middle East and Africa Global Ethical Pharmaceuticals Market Revenue Share (%), by Country 2024 & 2032
- Figure 18: Middle East and Africa Global Ethical Pharmaceuticals Market Volume Share (%), by Country 2024 & 2032
- Figure 19: South America Global Ethical Pharmaceuticals Market Revenue (Million), by Country 2024 & 2032
- Figure 20: South America Global Ethical Pharmaceuticals Market Volume (K Unit), by Country 2024 & 2032
- Figure 21: South America Global Ethical Pharmaceuticals Market Revenue Share (%), by Country 2024 & 2032
- Figure 22: South America Global Ethical Pharmaceuticals Market Volume Share (%), by Country 2024 & 2032
- Figure 23: North America Global Ethical Pharmaceuticals Market Revenue (Million), by Drug Class 2024 & 2032
- Figure 24: North America Global Ethical Pharmaceuticals Market Volume (K Unit), by Drug Class 2024 & 2032
- Figure 25: North America Global Ethical Pharmaceuticals Market Revenue Share (%), by Drug Class 2024 & 2032
- Figure 26: North America Global Ethical Pharmaceuticals Market Volume Share (%), by Drug Class 2024 & 2032
- Figure 27: North America Global Ethical Pharmaceuticals Market Revenue (Million), by Application 2024 & 2032
- Figure 28: North America Global Ethical Pharmaceuticals Market Volume (K Unit), by Application 2024 & 2032
- Figure 29: North America Global Ethical Pharmaceuticals Market Revenue Share (%), by Application 2024 & 2032
- Figure 30: North America Global Ethical Pharmaceuticals Market Volume Share (%), by Application 2024 & 2032
- Figure 31: North America Global Ethical Pharmaceuticals Market Revenue (Million), by Country 2024 & 2032
- Figure 32: North America Global Ethical Pharmaceuticals Market Volume (K Unit), by Country 2024 & 2032
- Figure 33: North America Global Ethical Pharmaceuticals Market Revenue Share (%), by Country 2024 & 2032
- Figure 34: North America Global Ethical Pharmaceuticals Market Volume Share (%), by Country 2024 & 2032
- Figure 35: Europe Global Ethical Pharmaceuticals Market Revenue (Million), by Drug Class 2024 & 2032
- Figure 36: Europe Global Ethical Pharmaceuticals Market Volume (K Unit), by Drug Class 2024 & 2032
- Figure 37: Europe Global Ethical Pharmaceuticals Market Revenue Share (%), by Drug Class 2024 & 2032
- Figure 38: Europe Global Ethical Pharmaceuticals Market Volume Share (%), by Drug Class 2024 & 2032
- Figure 39: Europe Global Ethical Pharmaceuticals Market Revenue (Million), by Application 2024 & 2032
- Figure 40: Europe Global Ethical Pharmaceuticals Market Volume (K Unit), by Application 2024 & 2032
- Figure 41: Europe Global Ethical Pharmaceuticals Market Revenue Share (%), by Application 2024 & 2032
- Figure 42: Europe Global Ethical Pharmaceuticals Market Volume Share (%), by Application 2024 & 2032
- Figure 43: Europe Global Ethical Pharmaceuticals Market Revenue (Million), by Country 2024 & 2032
- Figure 44: Europe Global Ethical Pharmaceuticals Market Volume (K Unit), by Country 2024 & 2032
- Figure 45: Europe Global Ethical Pharmaceuticals Market Revenue Share (%), by Country 2024 & 2032
- Figure 46: Europe Global Ethical Pharmaceuticals Market Volume Share (%), by Country 2024 & 2032
- Figure 47: Asia Pacific Global Ethical Pharmaceuticals Market Revenue (Million), by Drug Class 2024 & 2032
- Figure 48: Asia Pacific Global Ethical Pharmaceuticals Market Volume (K Unit), by Drug Class 2024 & 2032
- Figure 49: Asia Pacific Global Ethical Pharmaceuticals Market Revenue Share (%), by Drug Class 2024 & 2032
- Figure 50: Asia Pacific Global Ethical Pharmaceuticals Market Volume Share (%), by Drug Class 2024 & 2032
- Figure 51: Asia Pacific Global Ethical Pharmaceuticals Market Revenue (Million), by Application 2024 & 2032
- Figure 52: Asia Pacific Global Ethical Pharmaceuticals Market Volume (K Unit), by Application 2024 & 2032
- Figure 53: Asia Pacific Global Ethical Pharmaceuticals Market Revenue Share (%), by Application 2024 & 2032
- Figure 54: Asia Pacific Global Ethical Pharmaceuticals Market Volume Share (%), by Application 2024 & 2032
- Figure 55: Asia Pacific Global Ethical Pharmaceuticals Market Revenue (Million), by Country 2024 & 2032
- Figure 56: Asia Pacific Global Ethical Pharmaceuticals Market Volume (K Unit), by Country 2024 & 2032
- Figure 57: Asia Pacific Global Ethical Pharmaceuticals Market Revenue Share (%), by Country 2024 & 2032
- Figure 58: Asia Pacific Global Ethical Pharmaceuticals Market Volume Share (%), by Country 2024 & 2032
- Figure 59: Middle East and Africa Global Ethical Pharmaceuticals Market Revenue (Million), by Drug Class 2024 & 2032
- Figure 60: Middle East and Africa Global Ethical Pharmaceuticals Market Volume (K Unit), by Drug Class 2024 & 2032
- Figure 61: Middle East and Africa Global Ethical Pharmaceuticals Market Revenue Share (%), by Drug Class 2024 & 2032
- Figure 62: Middle East and Africa Global Ethical Pharmaceuticals Market Volume Share (%), by Drug Class 2024 & 2032
- Figure 63: Middle East and Africa Global Ethical Pharmaceuticals Market Revenue (Million), by Application 2024 & 2032
- Figure 64: Middle East and Africa Global Ethical Pharmaceuticals Market Volume (K Unit), by Application 2024 & 2032
- Figure 65: Middle East and Africa Global Ethical Pharmaceuticals Market Revenue Share (%), by Application 2024 & 2032
- Figure 66: Middle East and Africa Global Ethical Pharmaceuticals Market Volume Share (%), by Application 2024 & 2032
- Figure 67: Middle East and Africa Global Ethical Pharmaceuticals Market Revenue (Million), by Country 2024 & 2032
- Figure 68: Middle East and Africa Global Ethical Pharmaceuticals Market Volume (K Unit), by Country 2024 & 2032
- Figure 69: Middle East and Africa Global Ethical Pharmaceuticals Market Revenue Share (%), by Country 2024 & 2032
- Figure 70: Middle East and Africa Global Ethical Pharmaceuticals Market Volume Share (%), by Country 2024 & 2032
- Figure 71: South America Global Ethical Pharmaceuticals Market Revenue (Million), by Drug Class 2024 & 2032
- Figure 72: South America Global Ethical Pharmaceuticals Market Volume (K Unit), by Drug Class 2024 & 2032
- Figure 73: South America Global Ethical Pharmaceuticals Market Revenue Share (%), by Drug Class 2024 & 2032
- Figure 74: South America Global Ethical Pharmaceuticals Market Volume Share (%), by Drug Class 2024 & 2032
- Figure 75: South America Global Ethical Pharmaceuticals Market Revenue (Million), by Application 2024 & 2032
- Figure 76: South America Global Ethical Pharmaceuticals Market Volume (K Unit), by Application 2024 & 2032
- Figure 77: South America Global Ethical Pharmaceuticals Market Revenue Share (%), by Application 2024 & 2032
- Figure 78: South America Global Ethical Pharmaceuticals Market Volume Share (%), by Application 2024 & 2032
- Figure 79: South America Global Ethical Pharmaceuticals Market Revenue (Million), by Country 2024 & 2032
- Figure 80: South America Global Ethical Pharmaceuticals Market Volume (K Unit), by Country 2024 & 2032
- Figure 81: South America Global Ethical Pharmaceuticals Market Revenue Share (%), by Country 2024 & 2032
- Figure 82: South America Global Ethical Pharmaceuticals Market Volume Share (%), by Country 2024 & 2032
List of Tables
- Table 1: Global Ethical Pharmaceuticals Market Revenue Million Forecast, by Region 2019 & 2032
- Table 2: Global Ethical Pharmaceuticals Market Volume K Unit Forecast, by Region 2019 & 2032
- Table 3: Global Ethical Pharmaceuticals Market Revenue Million Forecast, by Drug Class 2019 & 2032
- Table 4: Global Ethical Pharmaceuticals Market Volume K Unit Forecast, by Drug Class 2019 & 2032
- Table 5: Global Ethical Pharmaceuticals Market Revenue Million Forecast, by Application 2019 & 2032
- Table 6: Global Ethical Pharmaceuticals Market Volume K Unit Forecast, by Application 2019 & 2032
- Table 7: Global Ethical Pharmaceuticals Market Revenue Million Forecast, by Region 2019 & 2032
- Table 8: Global Ethical Pharmaceuticals Market Volume K Unit Forecast, by Region 2019 & 2032
- Table 9: Global Ethical Pharmaceuticals Market Revenue Million Forecast, by Country 2019 & 2032
- Table 10: Global Ethical Pharmaceuticals Market Volume K Unit Forecast, by Country 2019 & 2032
- Table 11: United States Global Ethical Pharmaceuticals Market Revenue (Million) Forecast, by Application 2019 & 2032
- Table 12: United States Global Ethical Pharmaceuticals Market Volume (K Unit) Forecast, by Application 2019 & 2032
- Table 13: Canada Global Ethical Pharmaceuticals Market Revenue (Million) Forecast, by Application 2019 & 2032
- Table 14: Canada Global Ethical Pharmaceuticals Market Volume (K Unit) Forecast, by Application 2019 & 2032
- Table 15: Mexico Global Ethical Pharmaceuticals Market Revenue (Million) Forecast, by Application 2019 & 2032
- Table 16: Mexico Global Ethical Pharmaceuticals Market Volume (K Unit) Forecast, by Application 2019 & 2032
- Table 17: Global Ethical Pharmaceuticals Market Revenue Million Forecast, by Country 2019 & 2032
- Table 18: Global Ethical Pharmaceuticals Market Volume K Unit Forecast, by Country 2019 & 2032
- Table 19: Germany Global Ethical Pharmaceuticals Market Revenue (Million) Forecast, by Application 2019 & 2032
- Table 20: Germany Global Ethical Pharmaceuticals Market Volume (K Unit) Forecast, by Application 2019 & 2032
- Table 21: United Kingdom Global Ethical Pharmaceuticals Market Revenue (Million) Forecast, by Application 2019 & 2032
- Table 22: United Kingdom Global Ethical Pharmaceuticals Market Volume (K Unit) Forecast, by Application 2019 & 2032
- Table 23: France Global Ethical Pharmaceuticals Market Revenue (Million) Forecast, by Application 2019 & 2032
- Table 24: France Global Ethical Pharmaceuticals Market Volume (K Unit) Forecast, by Application 2019 & 2032
- Table 25: Italy Global Ethical Pharmaceuticals Market Revenue (Million) Forecast, by Application 2019 & 2032
- Table 26: Italy Global Ethical Pharmaceuticals Market Volume (K Unit) Forecast, by Application 2019 & 2032
- Table 27: Spain Global Ethical Pharmaceuticals Market Revenue (Million) Forecast, by Application 2019 & 2032
- Table 28: Spain Global Ethical Pharmaceuticals Market Volume (K Unit) Forecast, by Application 2019 & 2032
- Table 29: Rest of Europe Global Ethical Pharmaceuticals Market Revenue (Million) Forecast, by Application 2019 & 2032
- Table 30: Rest of Europe Global Ethical Pharmaceuticals Market Volume (K Unit) Forecast, by Application 2019 & 2032
- Table 31: Global Ethical Pharmaceuticals Market Revenue Million Forecast, by Country 2019 & 2032
- Table 32: Global Ethical Pharmaceuticals Market Volume K Unit Forecast, by Country 2019 & 2032
- Table 33: China Global Ethical Pharmaceuticals Market Revenue (Million) Forecast, by Application 2019 & 2032
- Table 34: China Global Ethical Pharmaceuticals Market Volume (K Unit) Forecast, by Application 2019 & 2032
- Table 35: Japan Global Ethical Pharmaceuticals Market Revenue (Million) Forecast, by Application 2019 & 2032
- Table 36: Japan Global Ethical Pharmaceuticals Market Volume (K Unit) Forecast, by Application 2019 & 2032
- Table 37: India Global Ethical Pharmaceuticals Market Revenue (Million) Forecast, by Application 2019 & 2032
- Table 38: India Global Ethical Pharmaceuticals Market Volume (K Unit) Forecast, by Application 2019 & 2032
- Table 39: Australia Global Ethical Pharmaceuticals Market Revenue (Million) Forecast, by Application 2019 & 2032
- Table 40: Australia Global Ethical Pharmaceuticals Market Volume (K Unit) Forecast, by Application 2019 & 2032
- Table 41: South Korea Global Ethical Pharmaceuticals Market Revenue (Million) Forecast, by Application 2019 & 2032
- Table 42: South Korea Global Ethical Pharmaceuticals Market Volume (K Unit) Forecast, by Application 2019 & 2032
- Table 43: Rest of Asia Pacific Global Ethical Pharmaceuticals Market Revenue (Million) Forecast, by Application 2019 & 2032
- Table 44: Rest of Asia Pacific Global Ethical Pharmaceuticals Market Volume (K Unit) Forecast, by Application 2019 & 2032
- Table 45: Global Ethical Pharmaceuticals Market Revenue Million Forecast, by Country 2019 & 2032
- Table 46: Global Ethical Pharmaceuticals Market Volume K Unit Forecast, by Country 2019 & 2032
- Table 47: GCC Global Ethical Pharmaceuticals Market Revenue (Million) Forecast, by Application 2019 & 2032
- Table 48: GCC Global Ethical Pharmaceuticals Market Volume (K Unit) Forecast, by Application 2019 & 2032
- Table 49: South Africa Global Ethical Pharmaceuticals Market Revenue (Million) Forecast, by Application 2019 & 2032
- Table 50: South Africa Global Ethical Pharmaceuticals Market Volume (K Unit) Forecast, by Application 2019 & 2032
- Table 51: Rest of Middle East and Africa Global Ethical Pharmaceuticals Market Revenue (Million) Forecast, by Application 2019 & 2032
- Table 52: Rest of Middle East and Africa Global Ethical Pharmaceuticals Market Volume (K Unit) Forecast, by Application 2019 & 2032
- Table 53: Global Ethical Pharmaceuticals Market Revenue Million Forecast, by Country 2019 & 2032
- Table 54: Global Ethical Pharmaceuticals Market Volume K Unit Forecast, by Country 2019 & 2032
- Table 55: Brazil Global Ethical Pharmaceuticals Market Revenue (Million) Forecast, by Application 2019 & 2032
- Table 56: Brazil Global Ethical Pharmaceuticals Market Volume (K Unit) Forecast, by Application 2019 & 2032
- Table 57: Argentina Global Ethical Pharmaceuticals Market Revenue (Million) Forecast, by Application 2019 & 2032
- Table 58: Argentina Global Ethical Pharmaceuticals Market Volume (K Unit) Forecast, by Application 2019 & 2032
- Table 59: Rest of South America Global Ethical Pharmaceuticals Market Revenue (Million) Forecast, by Application 2019 & 2032
- Table 60: Rest of South America Global Ethical Pharmaceuticals Market Volume (K Unit) Forecast, by Application 2019 & 2032
- Table 61: Global Ethical Pharmaceuticals Market Revenue Million Forecast, by Drug Class 2019 & 2032
- Table 62: Global Ethical Pharmaceuticals Market Volume K Unit Forecast, by Drug Class 2019 & 2032
- Table 63: Global Ethical Pharmaceuticals Market Revenue Million Forecast, by Application 2019 & 2032
- Table 64: Global Ethical Pharmaceuticals Market Volume K Unit Forecast, by Application 2019 & 2032
- Table 65: Global Ethical Pharmaceuticals Market Revenue Million Forecast, by Country 2019 & 2032
- Table 66: Global Ethical Pharmaceuticals Market Volume K Unit Forecast, by Country 2019 & 2032
- Table 67: United States Global Ethical Pharmaceuticals Market Revenue (Million) Forecast, by Application 2019 & 2032
- Table 68: United States Global Ethical Pharmaceuticals Market Volume (K Unit) Forecast, by Application 2019 & 2032
- Table 69: Canada Global Ethical Pharmaceuticals Market Revenue (Million) Forecast, by Application 2019 & 2032
- Table 70: Canada Global Ethical Pharmaceuticals Market Volume (K Unit) Forecast, by Application 2019 & 2032
- Table 71: Mexico Global Ethical Pharmaceuticals Market Revenue (Million) Forecast, by Application 2019 & 2032
- Table 72: Mexico Global Ethical Pharmaceuticals Market Volume (K Unit) Forecast, by Application 2019 & 2032
- Table 73: Global Ethical Pharmaceuticals Market Revenue Million Forecast, by Drug Class 2019 & 2032
- Table 74: Global Ethical Pharmaceuticals Market Volume K Unit Forecast, by Drug Class 2019 & 2032
- Table 75: Global Ethical Pharmaceuticals Market Revenue Million Forecast, by Application 2019 & 2032
- Table 76: Global Ethical Pharmaceuticals Market Volume K Unit Forecast, by Application 2019 & 2032
- Table 77: Global Ethical Pharmaceuticals Market Revenue Million Forecast, by Country 2019 & 2032
- Table 78: Global Ethical Pharmaceuticals Market Volume K Unit Forecast, by Country 2019 & 2032
- Table 79: Germany Global Ethical Pharmaceuticals Market Revenue (Million) Forecast, by Application 2019 & 2032
- Table 80: Germany Global Ethical Pharmaceuticals Market Volume (K Unit) Forecast, by Application 2019 & 2032
- Table 81: United Kingdom Global Ethical Pharmaceuticals Market Revenue (Million) Forecast, by Application 2019 & 2032
- Table 82: United Kingdom Global Ethical Pharmaceuticals Market Volume (K Unit) Forecast, by Application 2019 & 2032
- Table 83: France Global Ethical Pharmaceuticals Market Revenue (Million) Forecast, by Application 2019 & 2032
- Table 84: France Global Ethical Pharmaceuticals Market Volume (K Unit) Forecast, by Application 2019 & 2032
- Table 85: Italy Global Ethical Pharmaceuticals Market Revenue (Million) Forecast, by Application 2019 & 2032
- Table 86: Italy Global Ethical Pharmaceuticals Market Volume (K Unit) Forecast, by Application 2019 & 2032
- Table 87: Spain Global Ethical Pharmaceuticals Market Revenue (Million) Forecast, by Application 2019 & 2032
- Table 88: Spain Global Ethical Pharmaceuticals Market Volume (K Unit) Forecast, by Application 2019 & 2032
- Table 89: Rest of Europe Global Ethical Pharmaceuticals Market Revenue (Million) Forecast, by Application 2019 & 2032
- Table 90: Rest of Europe Global Ethical Pharmaceuticals Market Volume (K Unit) Forecast, by Application 2019 & 2032
- Table 91: Global Ethical Pharmaceuticals Market Revenue Million Forecast, by Drug Class 2019 & 2032
- Table 92: Global Ethical Pharmaceuticals Market Volume K Unit Forecast, by Drug Class 2019 & 2032
- Table 93: Global Ethical Pharmaceuticals Market Revenue Million Forecast, by Application 2019 & 2032
- Table 94: Global Ethical Pharmaceuticals Market Volume K Unit Forecast, by Application 2019 & 2032
- Table 95: Global Ethical Pharmaceuticals Market Revenue Million Forecast, by Country 2019 & 2032
- Table 96: Global Ethical Pharmaceuticals Market Volume K Unit Forecast, by Country 2019 & 2032
- Table 97: China Global Ethical Pharmaceuticals Market Revenue (Million) Forecast, by Application 2019 & 2032
- Table 98: China Global Ethical Pharmaceuticals Market Volume (K Unit) Forecast, by Application 2019 & 2032
- Table 99: Japan Global Ethical Pharmaceuticals Market Revenue (Million) Forecast, by Application 2019 & 2032
- Table 100: Japan Global Ethical Pharmaceuticals Market Volume (K Unit) Forecast, by Application 2019 & 2032
- Table 101: India Global Ethical Pharmaceuticals Market Revenue (Million) Forecast, by Application 2019 & 2032
- Table 102: India Global Ethical Pharmaceuticals Market Volume (K Unit) Forecast, by Application 2019 & 2032
- Table 103: Australia Global Ethical Pharmaceuticals Market Revenue (Million) Forecast, by Application 2019 & 2032
- Table 104: Australia Global Ethical Pharmaceuticals Market Volume (K Unit) Forecast, by Application 2019 & 2032
- Table 105: South Korea Global Ethical Pharmaceuticals Market Revenue (Million) Forecast, by Application 2019 & 2032
- Table 106: South Korea Global Ethical Pharmaceuticals Market Volume (K Unit) Forecast, by Application 2019 & 2032
- Table 107: Rest of Asia Pacific Global Ethical Pharmaceuticals Market Revenue (Million) Forecast, by Application 2019 & 2032
- Table 108: Rest of Asia Pacific Global Ethical Pharmaceuticals Market Volume (K Unit) Forecast, by Application 2019 & 2032
- Table 109: Global Ethical Pharmaceuticals Market Revenue Million Forecast, by Drug Class 2019 & 2032
- Table 110: Global Ethical Pharmaceuticals Market Volume K Unit Forecast, by Drug Class 2019 & 2032
- Table 111: Global Ethical Pharmaceuticals Market Revenue Million Forecast, by Application 2019 & 2032
- Table 112: Global Ethical Pharmaceuticals Market Volume K Unit Forecast, by Application 2019 & 2032
- Table 113: Global Ethical Pharmaceuticals Market Revenue Million Forecast, by Country 2019 & 2032
- Table 114: Global Ethical Pharmaceuticals Market Volume K Unit Forecast, by Country 2019 & 2032
- Table 115: GCC Global Ethical Pharmaceuticals Market Revenue (Million) Forecast, by Application 2019 & 2032
- Table 116: GCC Global Ethical Pharmaceuticals Market Volume (K Unit) Forecast, by Application 2019 & 2032
- Table 117: South Africa Global Ethical Pharmaceuticals Market Revenue (Million) Forecast, by Application 2019 & 2032
- Table 118: South Africa Global Ethical Pharmaceuticals Market Volume (K Unit) Forecast, by Application 2019 & 2032
- Table 119: Rest of Middle East and Africa Global Ethical Pharmaceuticals Market Revenue (Million) Forecast, by Application 2019 & 2032
- Table 120: Rest of Middle East and Africa Global Ethical Pharmaceuticals Market Volume (K Unit) Forecast, by Application 2019 & 2032
- Table 121: Global Ethical Pharmaceuticals Market Revenue Million Forecast, by Drug Class 2019 & 2032
- Table 122: Global Ethical Pharmaceuticals Market Volume K Unit Forecast, by Drug Class 2019 & 2032
- Table 123: Global Ethical Pharmaceuticals Market Revenue Million Forecast, by Application 2019 & 2032
- Table 124: Global Ethical Pharmaceuticals Market Volume K Unit Forecast, by Application 2019 & 2032
- Table 125: Global Ethical Pharmaceuticals Market Revenue Million Forecast, by Country 2019 & 2032
- Table 126: Global Ethical Pharmaceuticals Market Volume K Unit Forecast, by Country 2019 & 2032
- Table 127: Brazil Global Ethical Pharmaceuticals Market Revenue (Million) Forecast, by Application 2019 & 2032
- Table 128: Brazil Global Ethical Pharmaceuticals Market Volume (K Unit) Forecast, by Application 2019 & 2032
- Table 129: Argentina Global Ethical Pharmaceuticals Market Revenue (Million) Forecast, by Application 2019 & 2032
- Table 130: Argentina Global Ethical Pharmaceuticals Market Volume (K Unit) Forecast, by Application 2019 & 2032
- Table 131: Rest of South America Global Ethical Pharmaceuticals Market Revenue (Million) Forecast, by Application 2019 & 2032
- Table 132: Rest of South America Global Ethical Pharmaceuticals Market Volume (K Unit) Forecast, by Application 2019 & 2032
Frequently Asked Questions
1. What is the projected Compound Annual Growth Rate (CAGR) of the Global Ethical Pharmaceuticals Market?
The projected CAGR is approximately 10.50%.
2. Which companies are prominent players in the Global Ethical Pharmaceuticals Market?
Key companies in the market include Takeda Pharmaceutical Company, Sanofi, Novartis AG, Amgen Inc, Merck & Co Inc, F Hoffmann-La Roche Ltd, GlaxoSmithKline plc, Otsuka Holdings, Abbott Laboratories, Eli Lilly and Company, Teva Pharmaceutical Industries Ltd, AbbVie Inc, Johnson & Johnson, Pfizer Inc.
3. What are the main segments of the Global Ethical Pharmaceuticals Market?
The market segments include Drug Class, Application.
4. Can you provide details about the market size?
The market size is estimated to be USD XX Million as of 2022.
5. What are some drivers contributing to market growth?
Rising Burden of Chronic Diseases and Increase in Geriatric Population; Rise in Research Activities For the Development of Novel Ethical Medicines.
6. What are the notable trends driving market growth?
Hospitals and Clinics Segment Is Expected To Hold A Major Share In The Market Over The Forecast Period..
7. Are there any restraints impacting market growth?
Patent Expiry of Current Ethical Pharmaceuticals; Lengthy Approval Process.
8. Can you provide examples of recent developments in the market?
In March 2022, the United States Food and Drug Administration approved one of the first generic Symbicort (budesonide and formoterol fumarate dihydrate) inhalation aerosols for the treatment of pulmonary health conditions.
9. What pricing options are available for accessing the report?
Pricing options include single-user, multi-user, and enterprise licenses priced at USD 4750, USD 5250, and USD 8750 respectively.
10. Is the market size provided in terms of value or volume?
The market size is provided in terms of value, measured in Million and volume, measured in K Unit.
11. Are there any specific market keywords associated with the report?
Yes, the market keyword associated with the report is "Global Ethical Pharmaceuticals Market," which aids in identifying and referencing the specific market segment covered.
12. How do I determine which pricing option suits my needs best?
The pricing options vary based on user requirements and access needs. Individual users may opt for single-user licenses, while businesses requiring broader access may choose multi-user or enterprise licenses for cost-effective access to the report.
13. Are there any additional resources or data provided in the Global Ethical Pharmaceuticals Market report?
While the report offers comprehensive insights, it's advisable to review the specific contents or supplementary materials provided to ascertain if additional resources or data are available.
14. How can I stay updated on further developments or reports in the Global Ethical Pharmaceuticals Market?
To stay informed about further developments, trends, and reports in the Global Ethical Pharmaceuticals Market, consider subscribing to industry newsletters, following relevant companies and organizations, or regularly checking reputable industry news sources and publications.
Methodology
Step 1 - Identification of Relevant Samples Size from Population Database


Step 2 - Approaches for Defining Global Market Size (Value, Volume* & Price*)

Note*: In applicable scenarios
Step 3 - Data Sources
Primary Research
- Web Analytics
- Survey Reports
- Research Institute
- Latest Research Reports
- Opinion Leaders
Secondary Research
- Annual Reports
- White Paper
- Latest Press Release
- Industry Association
- Paid Database
- Investor Presentations

Step 4 - Data Triangulation
Involves using different sources of information in order to increase the validity of a study
These sources are likely to be stakeholders in a program - participants, other researchers, program staff, other community members, and so on.
Then we put all data in single framework & apply various statistical tools to find out the dynamic on the market.
During the analysis stage, feedback from the stakeholder groups would be compared to determine areas of agreement as well as areas of divergence


