
Key Insights
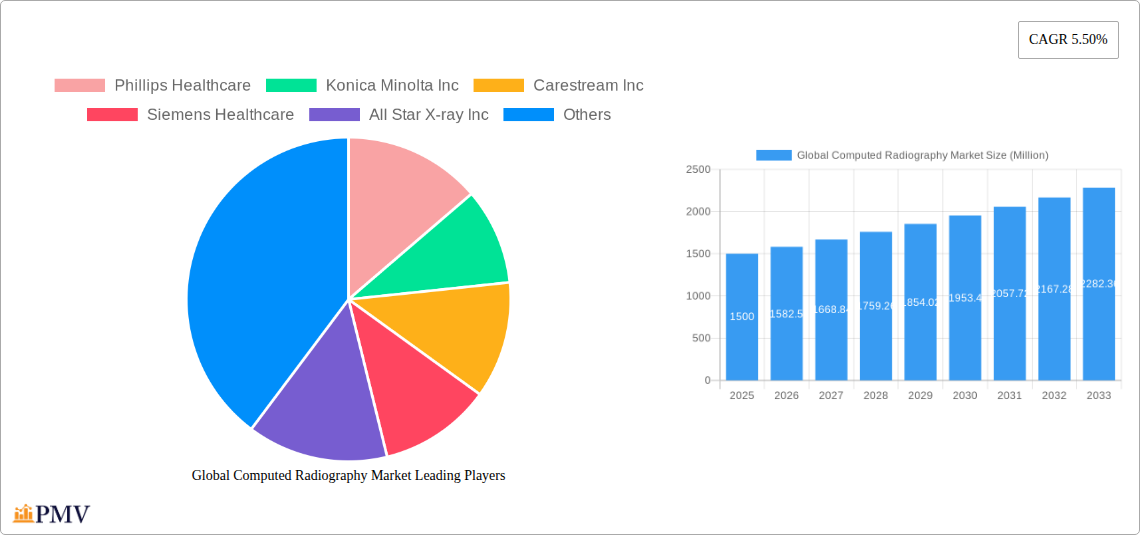
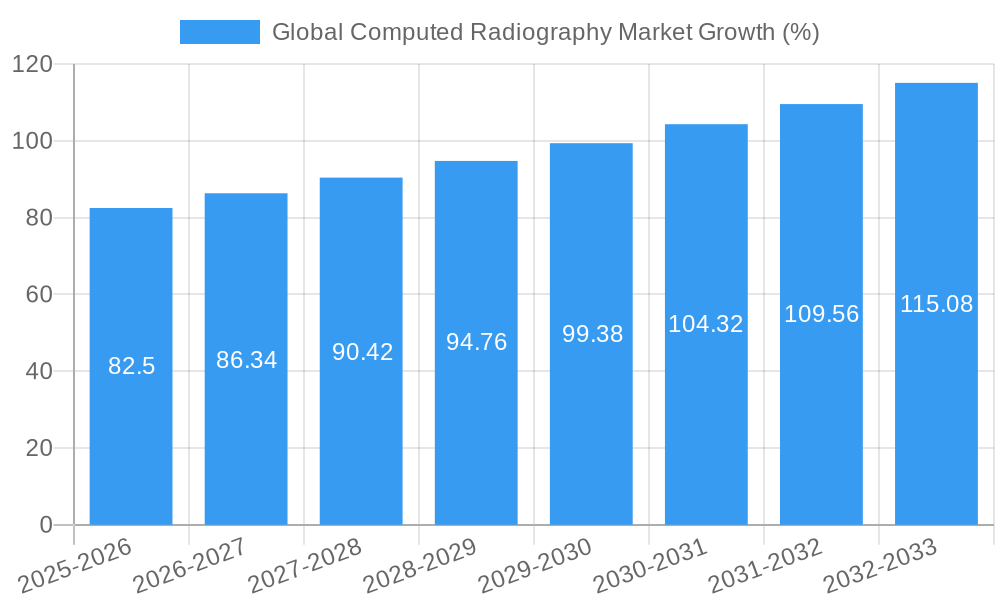
The global computed radiography (CR) market, valued at approximately $1.5 billion in 2025, is projected to experience steady growth, exhibiting a compound annual growth rate (CAGR) of 5.50% from 2025 to 2033. This growth is driven by several key factors. The increasing prevalence of chronic diseases like cancer and cardiovascular conditions necessitates advanced diagnostic imaging techniques, fueling demand for CR systems. Technological advancements, such as the development of higher-resolution detectors and improved image processing software, are enhancing the efficiency and diagnostic accuracy of CR, thereby attracting healthcare providers. Furthermore, the rising adoption of CR in emerging economies, particularly in Asia-Pacific regions like India and China, due to its relatively lower cost compared to digital radiography (DR), contributes significantly to market expansion. However, the market faces some challenges. The high initial investment cost associated with purchasing and installing CR systems can act as a barrier to entry for smaller clinics and hospitals. The increasing competition from DR, which offers superior image quality and faster processing times, also presents a restraint. Nevertheless, the ongoing focus on improving CR technology and its continued relevance in specific applications, such as dental and orthopedic imaging, will support its market trajectory.
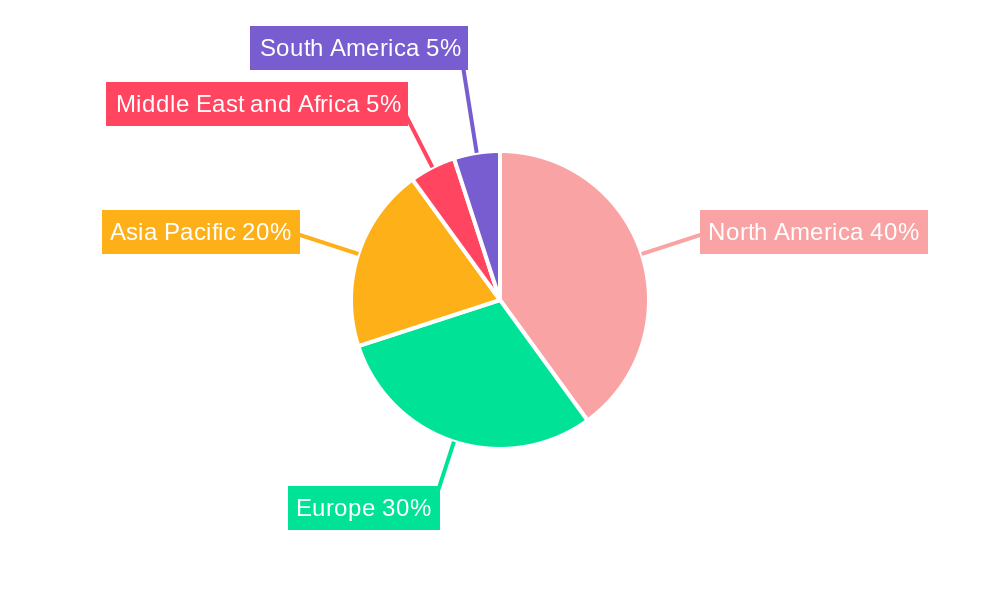
The market segmentation reveals a strong emphasis on orthopedic and cancer applications, reflecting the critical role of CR in diagnosing and managing these conditions. Hospitals remain the largest end-users, representing a substantial portion of the market. Regionally, North America and Europe are currently the dominant markets, benefiting from established healthcare infrastructure and higher adoption rates. However, the Asia-Pacific region is poised for significant growth driven by expanding healthcare infrastructure and rising disposable incomes. Key players like Philips Healthcare, Konica Minolta, and GE Healthcare are actively involved in developing and marketing advanced CR systems, driving innovation and market competitiveness. The market’s future growth will depend on factors such as technological innovation, regulatory approvals, and market penetration in underserved regions.
Global Computed Radiography Market: A Comprehensive Report (2019-2033)
This comprehensive report provides an in-depth analysis of the global computed radiography (CR) market, offering invaluable insights for stakeholders across the healthcare sector. Covering the period from 2019 to 2033, with 2025 as the base year and a forecast extending to 2033, this report meticulously examines market size, segmentation, growth drivers, challenges, and competitive dynamics. The study period encompasses historical data (2019-2024) and future projections (2025-2033), providing a holistic understanding of this vital medical imaging market. The market is valued at xx Million in 2025 and is projected to reach xx Million by 2033, exhibiting a CAGR of xx%.
Global Computed Radiography Market Market Structure & Competitive Dynamics
The global computed radiography market exhibits a moderately concentrated structure, with a few key players dominating the landscape. Market share is primarily distributed amongst established medical device manufacturers like Phillips Healthcare, Konica Minolta Inc, Carestream Inc, Siemens Healthcare, and GE Healthcare, along with other significant players such as Fujifilm Corporation. These companies compete based on technological advancements, product features, pricing strategies, and distribution networks.
The market’s innovation ecosystem is characterized by ongoing research and development focused on enhancing image quality, reducing radiation exposure, and improving workflow efficiency. Regulatory frameworks, particularly those concerning medical device approvals and safety standards, play a significant role in shaping market dynamics. Product substitutes, such as digital radiography (DR) systems, pose a competitive threat, though CR continues to hold a significant market share, particularly in developing economies. End-user trends, including the increasing adoption of digital imaging solutions in hospitals and diagnostic centers, drive market growth. Mergers and acquisitions (M&A) activity in the sector has been moderate, with deal values typically ranging from xx Million to xx Million, primarily focused on strengthening market position and expanding product portfolios.
Global Computed Radiography Market Industry Trends & Insights
The global computed radiography market is experiencing a period of moderate growth, driven primarily by increasing demand for cost-effective diagnostic imaging solutions, especially in developing nations. Technological advancements such as improved image processing algorithms and more efficient detectors are also contributing to market expansion. However, the market faces challenges from the increasing adoption of digital radiography (DR) systems, which offer superior image quality and faster imaging speeds. Consumer preferences are increasingly shifting towards faster, more efficient, and higher-quality imaging technologies. This trend is leading to heightened competition and forcing CR manufacturers to innovate and improve their offerings to maintain their market share. The market is expected to witness a significant penetration of CR systems in underserved regions, which will continue to drive growth. The CAGR for the forecast period (2025-2033) is projected to be xx%, indicating a steady, if not rapid, expansion.
Dominant Markets & Segments in Global Computed Radiography Market
The North American region currently dominates the global computed radiography market, driven by factors such as well-established healthcare infrastructure, high healthcare expenditure, and the early adoption of advanced medical technologies. Within the application segment, orthopedic imaging holds the largest market share, followed by cancer and cardiovascular imaging. Hospitals account for a substantial portion of the end-user segment, due to their high volume of diagnostic imaging procedures.
Key Drivers for North American Dominance:
- Advanced healthcare infrastructure
- High healthcare expenditure
- Early adoption of advanced technologies
- Stringent regulatory frameworks driving quality improvements.
Orthopedic Imaging Dominance: The high incidence of orthopedic injuries and diseases necessitates frequent radiographic imaging, boosting this segment's demand.
Hospital Segment Dominance: Hospitals, with their large patient volumes and comprehensive diagnostic capabilities, form a key end-user segment for CR systems.
Global Computed Radiography Market Product Innovations
Recent product innovations in the computed radiography market focus on improving image quality, reducing radiation exposure, and enhancing workflow efficiency. Manufacturers are incorporating advanced image processing algorithms and developing more sensitive detectors. These innovations are aimed at improving the overall clinical value of CR systems and making them more competitive against DR systems. New configurations, such as the GM85 Fit by Boston Imaging (launched April 2022), highlight a trend towards user-centric designs improving patient care and workflow efficiency. This strategy aims to secure market share by emphasizing convenience and usability.
Report Segmentation & Scope
This report segments the global computed radiography market based on application (Orthopedic, Cancer, Dental, Cardiovascular, Other Applications) and end-user (Hospitals, Diagnostic Centers, Other End Users). Each segment is analyzed based on market size, growth projections, and competitive dynamics. The ‘Orthopedic’ application segment is expected to exhibit strong growth due to the increasing prevalence of musculoskeletal disorders. The ‘Hospitals’ end-user segment is predicted to dominate due to the high volume of diagnostic imaging procedures performed in these facilities. The ‘Other Applications’ and ‘Other End-Users’ segments represent opportunities for future growth, with niche applications emerging in areas such as veterinary medicine and industrial imaging. Competitive dynamics vary across segments, with larger players typically dominating the hospital and orthopedic imaging segments.
Key Drivers of Global Computed Radiography Market Growth
The growth of the global computed radiography market is primarily driven by several factors. The increasing prevalence of chronic diseases requiring frequent imaging contributes significantly to market expansion. Government initiatives promoting healthcare infrastructure development, particularly in developing countries, are also driving demand. Technological advancements, such as improved image processing algorithms and more efficient detectors, further enhance market attractiveness. Cost-effectiveness compared to other imaging modalities makes CR a viable option, particularly in resource-constrained settings. Finally, the rising geriatric population, which requires more frequent medical imaging, is another key growth driver.
Challenges in the Global Computed Radiography Market Sector
The global computed radiography market faces several challenges that could hinder its growth. The increasing adoption of digital radiography (DR) systems, offering superior image quality and speed, poses a significant threat. Stringent regulatory requirements concerning medical device approvals and safety standards can increase production costs. Supply chain disruptions, particularly concerning key components such as detectors and image processing software, can affect production and lead times. The intense competition among established players necessitates ongoing innovation and investment to maintain market share.
Leading Players in the Global Computed Radiography Market Market
- Phillips Healthcare
- Konica Minolta Inc
- Carestream Inc
- Siemens Healthcare
- All Star X-ray Inc
- Desert Health Imaging Technologies LLC
- GE Healthcare
- Fujifilm Corporation
- Multi Imager Service Inc
- Jones X-Ray Inc
- EuroTeck Systems Ltd
Key Developments in Global Computed Radiography Market Sector
April 2022: FUJIFILM Healthcare Americas Corporation secured a DoD contract to standardize DIN-PACS for the US Pacific Air Force/Navy, boosting its market position and establishing its technology as a standard.
April 2022: Boston Imaging launched the GM85 Fit, a new CR system configuration emphasizing user-centric design, enhancing workflow efficiency and potentially increasing market share by attracting clinics seeking improved user experience.
Strategic Global Computed Radiography Market Market Outlook
The future of the global computed radiography market presents both opportunities and challenges. While DR systems continue to gain traction, CR remains a viable and cost-effective solution, particularly in developing regions and for specific applications. Strategic opportunities lie in focusing on niche applications, improving product features, and expanding into emerging markets. Continued innovation in image processing algorithms and detector technology will be crucial for maintaining competitiveness. Collaboration with healthcare providers and strategic partnerships will be key to driving market growth. The market holds considerable potential for growth in underserved regions, particularly through public-private partnerships aimed at expanding healthcare infrastructure.
Global Computed Radiography Market Segmentation
-
1. Application
- 1.1. Orthopedic
- 1.2. Cancer
- 1.3. Dental
- 1.4. Cardiovascular
- 1.5. Other Applications
-
2. End-User
- 2.1. Hospitals
- 2.2. Diagnostic Centers
- 2.3. Other End Users
Global Computed Radiography Market Segmentation By Geography
-
1. North America
- 1.1. United States
- 1.2. Canada
- 1.3. Mexico
-
2. Europe
- 2.1. Germany
- 2.2. United Kingdom
- 2.3. France
- 2.4. Italy
- 2.5. Spain
- 2.6. Rest of Europe
-
3. Asia Pacific
- 3.1. China
- 3.2. Japan
- 3.3. India
- 3.4. Australia
- 3.5. South Korea
- 3.6. Rest of Asia Pacific
-
4. Middle East and Africa
- 4.1. GCC
- 4.2. South Africa
- 4.3. Rest of Middle East and Africa
-
5. South America
- 5.1. Brazil
- 5.2. Argentina
- 5.3. Rest of South America
Global Computed Radiography Market REPORT HIGHLIGHTS
| Aspects | Details |
|---|---|
| Study Period | 2019-2033 |
| Base Year | 2024 |
| Estimated Year | 2025 |
| Forecast Period | 2025-2033 |
| Historical Period | 2019-2024 |
| Growth Rate | CAGR of 5.50% from 2019-2033 |
| Segmentation |
|
Table of Contents
- 1. Introduction
- 1.1. Research Scope
- 1.2. Market Segmentation
- 1.3. Research Methodology
- 1.4. Definitions and Assumptions
- 2. Executive Summary
- 2.1. Introduction
- 3. Market Dynamics
- 3.1. Introduction
- 3.2. Market Drivers
- 3.2.1. Increasing Occurrence of Orthopedic and other Chronic Diseases; Technological Advancements
- 3.3. Market Restrains
- 3.3.1. High Initial Cost of Installation and High Device Cost
- 3.4. Market Trends
- 3.4.1. Orthopedic Segment is Expected to Projected Significant Growth Over the Forecast Period.
- 4. Market Factor Analysis
- 4.1. Porters Five Forces
- 4.2. Supply/Value Chain
- 4.3. PESTEL analysis
- 4.4. Market Entropy
- 4.5. Patent/Trademark Analysis
- 5. Global Computed Radiography Market Analysis, Insights and Forecast, 2019-2031
- 5.1. Market Analysis, Insights and Forecast - by Application
- 5.1.1. Orthopedic
- 5.1.2. Cancer
- 5.1.3. Dental
- 5.1.4. Cardiovascular
- 5.1.5. Other Applications
- 5.2. Market Analysis, Insights and Forecast - by End-User
- 5.2.1. Hospitals
- 5.2.2. Diagnostic Centers
- 5.2.3. Other End Users
- 5.3. Market Analysis, Insights and Forecast - by Region
- 5.3.1. North America
- 5.3.2. Europe
- 5.3.3. Asia Pacific
- 5.3.4. Middle East and Africa
- 5.3.5. South America
- 5.1. Market Analysis, Insights and Forecast - by Application
- 6. North America Global Computed Radiography Market Analysis, Insights and Forecast, 2019-2031
- 6.1. Market Analysis, Insights and Forecast - by Application
- 6.1.1. Orthopedic
- 6.1.2. Cancer
- 6.1.3. Dental
- 6.1.4. Cardiovascular
- 6.1.5. Other Applications
- 6.2. Market Analysis, Insights and Forecast - by End-User
- 6.2.1. Hospitals
- 6.2.2. Diagnostic Centers
- 6.2.3. Other End Users
- 6.1. Market Analysis, Insights and Forecast - by Application
- 7. Europe Global Computed Radiography Market Analysis, Insights and Forecast, 2019-2031
- 7.1. Market Analysis, Insights and Forecast - by Application
- 7.1.1. Orthopedic
- 7.1.2. Cancer
- 7.1.3. Dental
- 7.1.4. Cardiovascular
- 7.1.5. Other Applications
- 7.2. Market Analysis, Insights and Forecast - by End-User
- 7.2.1. Hospitals
- 7.2.2. Diagnostic Centers
- 7.2.3. Other End Users
- 7.1. Market Analysis, Insights and Forecast - by Application
- 8. Asia Pacific Global Computed Radiography Market Analysis, Insights and Forecast, 2019-2031
- 8.1. Market Analysis, Insights and Forecast - by Application
- 8.1.1. Orthopedic
- 8.1.2. Cancer
- 8.1.3. Dental
- 8.1.4. Cardiovascular
- 8.1.5. Other Applications
- 8.2. Market Analysis, Insights and Forecast - by End-User
- 8.2.1. Hospitals
- 8.2.2. Diagnostic Centers
- 8.2.3. Other End Users
- 8.1. Market Analysis, Insights and Forecast - by Application
- 9. Middle East and Africa Global Computed Radiography Market Analysis, Insights and Forecast, 2019-2031
- 9.1. Market Analysis, Insights and Forecast - by Application
- 9.1.1. Orthopedic
- 9.1.2. Cancer
- 9.1.3. Dental
- 9.1.4. Cardiovascular
- 9.1.5. Other Applications
- 9.2. Market Analysis, Insights and Forecast - by End-User
- 9.2.1. Hospitals
- 9.2.2. Diagnostic Centers
- 9.2.3. Other End Users
- 9.1. Market Analysis, Insights and Forecast - by Application
- 10. South America Global Computed Radiography Market Analysis, Insights and Forecast, 2019-2031
- 10.1. Market Analysis, Insights and Forecast - by Application
- 10.1.1. Orthopedic
- 10.1.2. Cancer
- 10.1.3. Dental
- 10.1.4. Cardiovascular
- 10.1.5. Other Applications
- 10.2. Market Analysis, Insights and Forecast - by End-User
- 10.2.1. Hospitals
- 10.2.2. Diagnostic Centers
- 10.2.3. Other End Users
- 10.1. Market Analysis, Insights and Forecast - by Application
- 11. North America Global Computed Radiography Market Analysis, Insights and Forecast, 2019-2031
- 11.1. Market Analysis, Insights and Forecast - By Country/Sub-region
- 11.1.1 United States
- 11.1.2 Canada
- 11.1.3 Mexico
- 12. Europe Global Computed Radiography Market Analysis, Insights and Forecast, 2019-2031
- 12.1. Market Analysis, Insights and Forecast - By Country/Sub-region
- 12.1.1 Germany
- 12.1.2 United Kingdom
- 12.1.3 France
- 12.1.4 Italy
- 12.1.5 Spain
- 12.1.6 Rest of Europe
- 13. Asia Pacific Global Computed Radiography Market Analysis, Insights and Forecast, 2019-2031
- 13.1. Market Analysis, Insights and Forecast - By Country/Sub-region
- 13.1.1 China
- 13.1.2 Japan
- 13.1.3 India
- 13.1.4 Australia
- 13.1.5 South Korea
- 13.1.6 Rest of Asia Pacific
- 14. Middle East and Africa Global Computed Radiography Market Analysis, Insights and Forecast, 2019-2031
- 14.1. Market Analysis, Insights and Forecast - By Country/Sub-region
- 14.1.1 GCC
- 14.1.2 South Africa
- 14.1.3 Rest of Middle East and Africa
- 15. South America Global Computed Radiography Market Analysis, Insights and Forecast, 2019-2031
- 15.1. Market Analysis, Insights and Forecast - By Country/Sub-region
- 15.1.1 Brazil
- 15.1.2 Argentina
- 15.1.3 Rest of South America
- 16. Competitive Analysis
- 16.1. Market Share Analysis 2024
- 16.2. Company Profiles
- 16.2.1 Phillips Healthcare
- 16.2.1.1. Overview
- 16.2.1.2. Products
- 16.2.1.3. SWOT Analysis
- 16.2.1.4. Recent Developments
- 16.2.1.5. Financials (Based on Availability)
- 16.2.2 Konica Minolta Inc
- 16.2.2.1. Overview
- 16.2.2.2. Products
- 16.2.2.3. SWOT Analysis
- 16.2.2.4. Recent Developments
- 16.2.2.5. Financials (Based on Availability)
- 16.2.3 Carestream Inc
- 16.2.3.1. Overview
- 16.2.3.2. Products
- 16.2.3.3. SWOT Analysis
- 16.2.3.4. Recent Developments
- 16.2.3.5. Financials (Based on Availability)
- 16.2.4 Siemens Healthcare
- 16.2.4.1. Overview
- 16.2.4.2. Products
- 16.2.4.3. SWOT Analysis
- 16.2.4.4. Recent Developments
- 16.2.4.5. Financials (Based on Availability)
- 16.2.5 All Star X-ray Inc
- 16.2.5.1. Overview
- 16.2.5.2. Products
- 16.2.5.3. SWOT Analysis
- 16.2.5.4. Recent Developments
- 16.2.5.5. Financials (Based on Availability)
- 16.2.6 Desert Health Imaging Technologies LLC
- 16.2.6.1. Overview
- 16.2.6.2. Products
- 16.2.6.3. SWOT Analysis
- 16.2.6.4. Recent Developments
- 16.2.6.5. Financials (Based on Availability)
- 16.2.7 GE Healthcare
- 16.2.7.1. Overview
- 16.2.7.2. Products
- 16.2.7.3. SWOT Analysis
- 16.2.7.4. Recent Developments
- 16.2.7.5. Financials (Based on Availability)
- 16.2.8 Fujifilm Corporation
- 16.2.8.1. Overview
- 16.2.8.2. Products
- 16.2.8.3. SWOT Analysis
- 16.2.8.4. Recent Developments
- 16.2.8.5. Financials (Based on Availability)
- 16.2.9 Multi Imager Service Inc
- 16.2.9.1. Overview
- 16.2.9.2. Products
- 16.2.9.3. SWOT Analysis
- 16.2.9.4. Recent Developments
- 16.2.9.5. Financials (Based on Availability)
- 16.2.10 Jones X-Ray Inc
- 16.2.10.1. Overview
- 16.2.10.2. Products
- 16.2.10.3. SWOT Analysis
- 16.2.10.4. Recent Developments
- 16.2.10.5. Financials (Based on Availability)
- 16.2.11 EuroTeck Systems Ltd
- 16.2.11.1. Overview
- 16.2.11.2. Products
- 16.2.11.3. SWOT Analysis
- 16.2.11.4. Recent Developments
- 16.2.11.5. Financials (Based on Availability)
- 16.2.1 Phillips Healthcare
List of Figures
- Figure 1: Global Global Computed Radiography Market Revenue Breakdown (Million, %) by Region 2024 & 2032
- Figure 2: North America Global Computed Radiography Market Revenue (Million), by Country 2024 & 2032
- Figure 3: North America Global Computed Radiography Market Revenue Share (%), by Country 2024 & 2032
- Figure 4: Europe Global Computed Radiography Market Revenue (Million), by Country 2024 & 2032
- Figure 5: Europe Global Computed Radiography Market Revenue Share (%), by Country 2024 & 2032
- Figure 6: Asia Pacific Global Computed Radiography Market Revenue (Million), by Country 2024 & 2032
- Figure 7: Asia Pacific Global Computed Radiography Market Revenue Share (%), by Country 2024 & 2032
- Figure 8: Middle East and Africa Global Computed Radiography Market Revenue (Million), by Country 2024 & 2032
- Figure 9: Middle East and Africa Global Computed Radiography Market Revenue Share (%), by Country 2024 & 2032
- Figure 10: South America Global Computed Radiography Market Revenue (Million), by Country 2024 & 2032
- Figure 11: South America Global Computed Radiography Market Revenue Share (%), by Country 2024 & 2032
- Figure 12: North America Global Computed Radiography Market Revenue (Million), by Application 2024 & 2032
- Figure 13: North America Global Computed Radiography Market Revenue Share (%), by Application 2024 & 2032
- Figure 14: North America Global Computed Radiography Market Revenue (Million), by End-User 2024 & 2032
- Figure 15: North America Global Computed Radiography Market Revenue Share (%), by End-User 2024 & 2032
- Figure 16: North America Global Computed Radiography Market Revenue (Million), by Country 2024 & 2032
- Figure 17: North America Global Computed Radiography Market Revenue Share (%), by Country 2024 & 2032
- Figure 18: Europe Global Computed Radiography Market Revenue (Million), by Application 2024 & 2032
- Figure 19: Europe Global Computed Radiography Market Revenue Share (%), by Application 2024 & 2032
- Figure 20: Europe Global Computed Radiography Market Revenue (Million), by End-User 2024 & 2032
- Figure 21: Europe Global Computed Radiography Market Revenue Share (%), by End-User 2024 & 2032
- Figure 22: Europe Global Computed Radiography Market Revenue (Million), by Country 2024 & 2032
- Figure 23: Europe Global Computed Radiography Market Revenue Share (%), by Country 2024 & 2032
- Figure 24: Asia Pacific Global Computed Radiography Market Revenue (Million), by Application 2024 & 2032
- Figure 25: Asia Pacific Global Computed Radiography Market Revenue Share (%), by Application 2024 & 2032
- Figure 26: Asia Pacific Global Computed Radiography Market Revenue (Million), by End-User 2024 & 2032
- Figure 27: Asia Pacific Global Computed Radiography Market Revenue Share (%), by End-User 2024 & 2032
- Figure 28: Asia Pacific Global Computed Radiography Market Revenue (Million), by Country 2024 & 2032
- Figure 29: Asia Pacific Global Computed Radiography Market Revenue Share (%), by Country 2024 & 2032
- Figure 30: Middle East and Africa Global Computed Radiography Market Revenue (Million), by Application 2024 & 2032
- Figure 31: Middle East and Africa Global Computed Radiography Market Revenue Share (%), by Application 2024 & 2032
- Figure 32: Middle East and Africa Global Computed Radiography Market Revenue (Million), by End-User 2024 & 2032
- Figure 33: Middle East and Africa Global Computed Radiography Market Revenue Share (%), by End-User 2024 & 2032
- Figure 34: Middle East and Africa Global Computed Radiography Market Revenue (Million), by Country 2024 & 2032
- Figure 35: Middle East and Africa Global Computed Radiography Market Revenue Share (%), by Country 2024 & 2032
- Figure 36: South America Global Computed Radiography Market Revenue (Million), by Application 2024 & 2032
- Figure 37: South America Global Computed Radiography Market Revenue Share (%), by Application 2024 & 2032
- Figure 38: South America Global Computed Radiography Market Revenue (Million), by End-User 2024 & 2032
- Figure 39: South America Global Computed Radiography Market Revenue Share (%), by End-User 2024 & 2032
- Figure 40: South America Global Computed Radiography Market Revenue (Million), by Country 2024 & 2032
- Figure 41: South America Global Computed Radiography Market Revenue Share (%), by Country 2024 & 2032
List of Tables
- Table 1: Global Computed Radiography Market Revenue Million Forecast, by Region 2019 & 2032
- Table 2: Global Computed Radiography Market Revenue Million Forecast, by Application 2019 & 2032
- Table 3: Global Computed Radiography Market Revenue Million Forecast, by End-User 2019 & 2032
- Table 4: Global Computed Radiography Market Revenue Million Forecast, by Region 2019 & 2032
- Table 5: Global Computed Radiography Market Revenue Million Forecast, by Country 2019 & 2032
- Table 6: United States Global Computed Radiography Market Revenue (Million) Forecast, by Application 2019 & 2032
- Table 7: Canada Global Computed Radiography Market Revenue (Million) Forecast, by Application 2019 & 2032
- Table 8: Mexico Global Computed Radiography Market Revenue (Million) Forecast, by Application 2019 & 2032
- Table 9: Global Computed Radiography Market Revenue Million Forecast, by Country 2019 & 2032
- Table 10: Germany Global Computed Radiography Market Revenue (Million) Forecast, by Application 2019 & 2032
- Table 11: United Kingdom Global Computed Radiography Market Revenue (Million) Forecast, by Application 2019 & 2032
- Table 12: France Global Computed Radiography Market Revenue (Million) Forecast, by Application 2019 & 2032
- Table 13: Italy Global Computed Radiography Market Revenue (Million) Forecast, by Application 2019 & 2032
- Table 14: Spain Global Computed Radiography Market Revenue (Million) Forecast, by Application 2019 & 2032
- Table 15: Rest of Europe Global Computed Radiography Market Revenue (Million) Forecast, by Application 2019 & 2032
- Table 16: Global Computed Radiography Market Revenue Million Forecast, by Country 2019 & 2032
- Table 17: China Global Computed Radiography Market Revenue (Million) Forecast, by Application 2019 & 2032
- Table 18: Japan Global Computed Radiography Market Revenue (Million) Forecast, by Application 2019 & 2032
- Table 19: India Global Computed Radiography Market Revenue (Million) Forecast, by Application 2019 & 2032
- Table 20: Australia Global Computed Radiography Market Revenue (Million) Forecast, by Application 2019 & 2032
- Table 21: South Korea Global Computed Radiography Market Revenue (Million) Forecast, by Application 2019 & 2032
- Table 22: Rest of Asia Pacific Global Computed Radiography Market Revenue (Million) Forecast, by Application 2019 & 2032
- Table 23: Global Computed Radiography Market Revenue Million Forecast, by Country 2019 & 2032
- Table 24: GCC Global Computed Radiography Market Revenue (Million) Forecast, by Application 2019 & 2032
- Table 25: South Africa Global Computed Radiography Market Revenue (Million) Forecast, by Application 2019 & 2032
- Table 26: Rest of Middle East and Africa Global Computed Radiography Market Revenue (Million) Forecast, by Application 2019 & 2032
- Table 27: Global Computed Radiography Market Revenue Million Forecast, by Country 2019 & 2032
- Table 28: Brazil Global Computed Radiography Market Revenue (Million) Forecast, by Application 2019 & 2032
- Table 29: Argentina Global Computed Radiography Market Revenue (Million) Forecast, by Application 2019 & 2032
- Table 30: Rest of South America Global Computed Radiography Market Revenue (Million) Forecast, by Application 2019 & 2032
- Table 31: Global Computed Radiography Market Revenue Million Forecast, by Application 2019 & 2032
- Table 32: Global Computed Radiography Market Revenue Million Forecast, by End-User 2019 & 2032
- Table 33: Global Computed Radiography Market Revenue Million Forecast, by Country 2019 & 2032
- Table 34: United States Global Computed Radiography Market Revenue (Million) Forecast, by Application 2019 & 2032
- Table 35: Canada Global Computed Radiography Market Revenue (Million) Forecast, by Application 2019 & 2032
- Table 36: Mexico Global Computed Radiography Market Revenue (Million) Forecast, by Application 2019 & 2032
- Table 37: Global Computed Radiography Market Revenue Million Forecast, by Application 2019 & 2032
- Table 38: Global Computed Radiography Market Revenue Million Forecast, by End-User 2019 & 2032
- Table 39: Global Computed Radiography Market Revenue Million Forecast, by Country 2019 & 2032
- Table 40: Germany Global Computed Radiography Market Revenue (Million) Forecast, by Application 2019 & 2032
- Table 41: United Kingdom Global Computed Radiography Market Revenue (Million) Forecast, by Application 2019 & 2032
- Table 42: France Global Computed Radiography Market Revenue (Million) Forecast, by Application 2019 & 2032
- Table 43: Italy Global Computed Radiography Market Revenue (Million) Forecast, by Application 2019 & 2032
- Table 44: Spain Global Computed Radiography Market Revenue (Million) Forecast, by Application 2019 & 2032
- Table 45: Rest of Europe Global Computed Radiography Market Revenue (Million) Forecast, by Application 2019 & 2032
- Table 46: Global Computed Radiography Market Revenue Million Forecast, by Application 2019 & 2032
- Table 47: Global Computed Radiography Market Revenue Million Forecast, by End-User 2019 & 2032
- Table 48: Global Computed Radiography Market Revenue Million Forecast, by Country 2019 & 2032
- Table 49: China Global Computed Radiography Market Revenue (Million) Forecast, by Application 2019 & 2032
- Table 50: Japan Global Computed Radiography Market Revenue (Million) Forecast, by Application 2019 & 2032
- Table 51: India Global Computed Radiography Market Revenue (Million) Forecast, by Application 2019 & 2032
- Table 52: Australia Global Computed Radiography Market Revenue (Million) Forecast, by Application 2019 & 2032
- Table 53: South Korea Global Computed Radiography Market Revenue (Million) Forecast, by Application 2019 & 2032
- Table 54: Rest of Asia Pacific Global Computed Radiography Market Revenue (Million) Forecast, by Application 2019 & 2032
- Table 55: Global Computed Radiography Market Revenue Million Forecast, by Application 2019 & 2032
- Table 56: Global Computed Radiography Market Revenue Million Forecast, by End-User 2019 & 2032
- Table 57: Global Computed Radiography Market Revenue Million Forecast, by Country 2019 & 2032
- Table 58: GCC Global Computed Radiography Market Revenue (Million) Forecast, by Application 2019 & 2032
- Table 59: South Africa Global Computed Radiography Market Revenue (Million) Forecast, by Application 2019 & 2032
- Table 60: Rest of Middle East and Africa Global Computed Radiography Market Revenue (Million) Forecast, by Application 2019 & 2032
- Table 61: Global Computed Radiography Market Revenue Million Forecast, by Application 2019 & 2032
- Table 62: Global Computed Radiography Market Revenue Million Forecast, by End-User 2019 & 2032
- Table 63: Global Computed Radiography Market Revenue Million Forecast, by Country 2019 & 2032
- Table 64: Brazil Global Computed Radiography Market Revenue (Million) Forecast, by Application 2019 & 2032
- Table 65: Argentina Global Computed Radiography Market Revenue (Million) Forecast, by Application 2019 & 2032
- Table 66: Rest of South America Global Computed Radiography Market Revenue (Million) Forecast, by Application 2019 & 2032
Frequently Asked Questions
1. What is the projected Compound Annual Growth Rate (CAGR) of the Global Computed Radiography Market?
The projected CAGR is approximately 5.50%.
2. Which companies are prominent players in the Global Computed Radiography Market?
Key companies in the market include Phillips Healthcare, Konica Minolta Inc, Carestream Inc, Siemens Healthcare, All Star X-ray Inc, Desert Health Imaging Technologies LLC, GE Healthcare, Fujifilm Corporation, Multi Imager Service Inc, Jones X-Ray Inc, EuroTeck Systems Ltd.
3. What are the main segments of the Global Computed Radiography Market?
The market segments include Application, End-User.
4. Can you provide details about the market size?
The market size is estimated to be USD XX Million as of 2022.
5. What are some drivers contributing to market growth?
Increasing Occurrence of Orthopedic and other Chronic Diseases; Technological Advancements.
6. What are the notable trends driving market growth?
Orthopedic Segment is Expected to Projected Significant Growth Over the Forecast Period..
7. Are there any restraints impacting market growth?
High Initial Cost of Installation and High Device Cost.
8. Can you provide examples of recent developments in the market?
In April 2022, FUJIFILM Healthcare Americas Corporation, a leading provider of enterprise imaging and informatics solutions, was awarded a Pacific Air Force/Navy (PACAF) contract from the United States Department of Defense (DoD) to standardize its digital imaging network's picture archiving and communication systems (DIN-PACS) in the United States.
9. What pricing options are available for accessing the report?
Pricing options include single-user, multi-user, and enterprise licenses priced at USD 4750, USD 5250, and USD 8750 respectively.
10. Is the market size provided in terms of value or volume?
The market size is provided in terms of value, measured in Million.
11. Are there any specific market keywords associated with the report?
Yes, the market keyword associated with the report is "Global Computed Radiography Market," which aids in identifying and referencing the specific market segment covered.
12. How do I determine which pricing option suits my needs best?
The pricing options vary based on user requirements and access needs. Individual users may opt for single-user licenses, while businesses requiring broader access may choose multi-user or enterprise licenses for cost-effective access to the report.
13. Are there any additional resources or data provided in the Global Computed Radiography Market report?
While the report offers comprehensive insights, it's advisable to review the specific contents or supplementary materials provided to ascertain if additional resources or data are available.
14. How can I stay updated on further developments or reports in the Global Computed Radiography Market?
To stay informed about further developments, trends, and reports in the Global Computed Radiography Market, consider subscribing to industry newsletters, following relevant companies and organizations, or regularly checking reputable industry news sources and publications.
Methodology
Step 1 - Identification of Relevant Samples Size from Population Database


Step 2 - Approaches for Defining Global Market Size (Value, Volume* & Price*)

Note*: In applicable scenarios
Step 3 - Data Sources
Primary Research
- Web Analytics
- Survey Reports
- Research Institute
- Latest Research Reports
- Opinion Leaders
Secondary Research
- Annual Reports
- White Paper
- Latest Press Release
- Industry Association
- Paid Database
- Investor Presentations

Step 4 - Data Triangulation
Involves using different sources of information in order to increase the validity of a study
These sources are likely to be stakeholders in a program - participants, other researchers, program staff, other community members, and so on.
Then we put all data in single framework & apply various statistical tools to find out the dynamic on the market.
During the analysis stage, feedback from the stakeholder groups would be compared to determine areas of agreement as well as areas of divergence


