
Key Insights
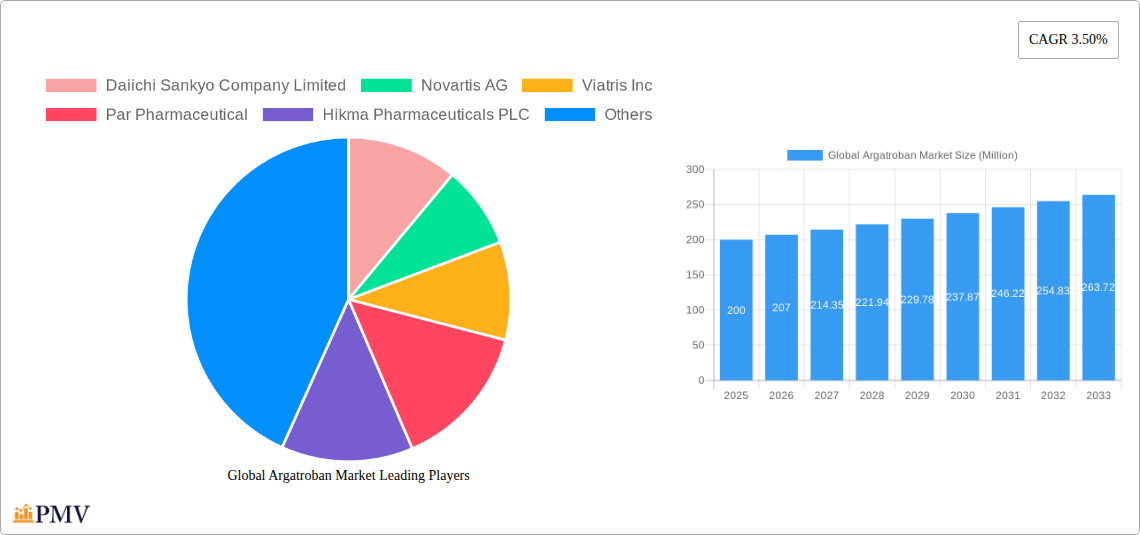
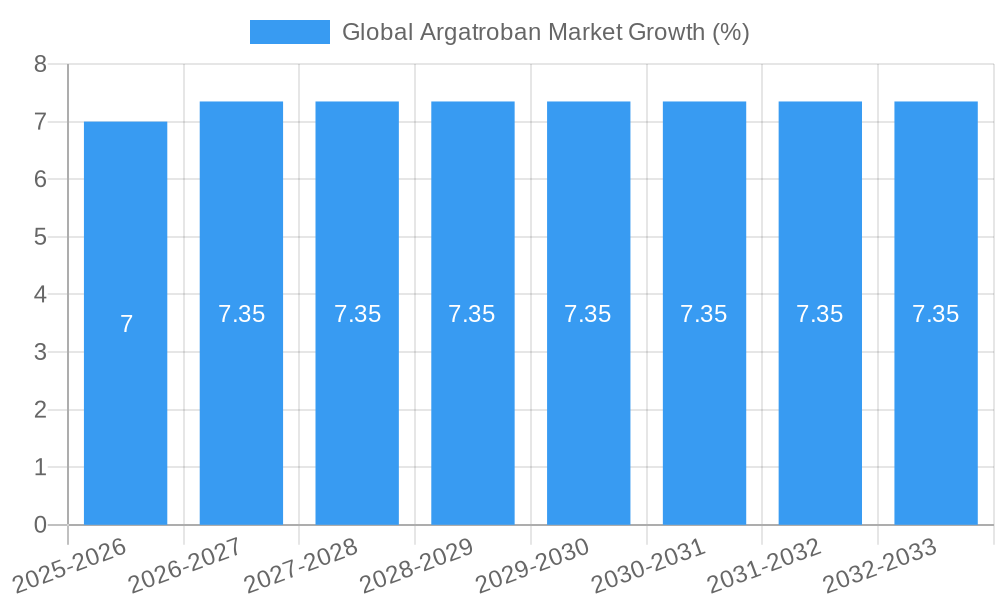
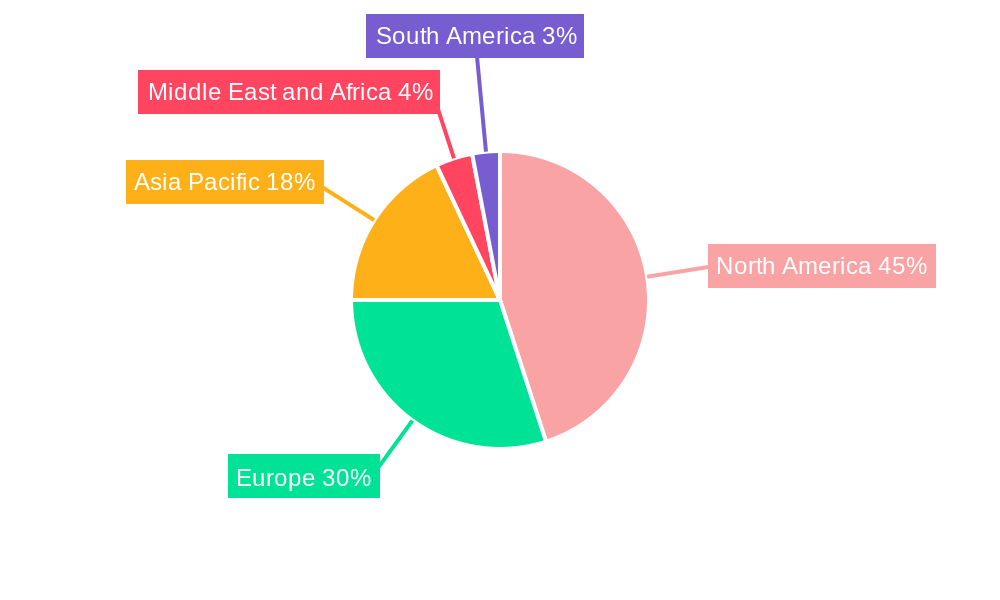
The global argatroban market, valued at approximately $200 million in 2025, is projected to experience steady growth, driven primarily by the increasing prevalence of conditions like Heparin-Induced Thrombocytopenia (HIT), Buerger's disease, and Arteriosclerosis Obliterans. The market's expansion is further fueled by advancements in percutaneous coronary intervention (PCI) procedures, which necessitate the use of anticoagulants like argatroban to prevent thrombosis. Hospital pharmacies constitute the largest end-user segment, reflecting the significant role of argatroban in hospital settings for managing thrombosis risks during and after procedures. While the North American market currently holds a dominant share, fueled by high healthcare expenditure and advanced medical infrastructure, the Asia-Pacific region is poised for substantial growth due to rising healthcare awareness, increasing prevalence of target diseases, and growing adoption of advanced medical technologies. However, the market faces constraints including the availability of alternative anticoagulants, stringent regulatory approvals, and potential side effects associated with argatroban, which may limit its widespread adoption. The 3.5% CAGR projected through 2033 suggests a continued, albeit moderate, expansion of the market, with significant opportunities for pharmaceutical companies to develop improved formulations and expand their market presence.
The competitive landscape is characterized by the presence of established pharmaceutical companies like Daiichi Sankyo, Novartis, Viatris, and Pfizer, alongside other key players. These companies are actively engaged in expanding their product portfolios, forging strategic partnerships, and exploring new market opportunities to capitalize on the growing demand for argatroban. The competitive intensity is likely to remain high, driven by price competition and the pursuit of market share in various geographical regions. Future market dynamics will be shaped by factors such as technological innovations, regulatory changes, pricing strategies, and the emergence of novel anticoagulants. Successful players will need to prioritize research and development, strategic collaborations, and efficient manufacturing capabilities to maintain their competitive edge and capitalize on emerging opportunities within this evolving market.
Global Argatroban Market: A Comprehensive Market Report (2019-2033)
This detailed report provides a comprehensive analysis of the global argatroban market, offering invaluable insights for stakeholders across the pharmaceutical industry. With a study period spanning 2019-2033, a base year of 2025, and an estimated year of 2025, this report projects market trends and growth potential through 2033. The historical period covered is 2019-2024. This report meticulously segments the market by indication (Buerger's Disease, Arteriosclerosis Obliterans, Heparin-Induced Thrombocytopenia (HIT), Percutaneous Coronary Intervention, Other Indications) and end-user (Hospital Pharmacies, Retail Pharmacies, Other End Users), offering a granular understanding of market dynamics. Key players like Daiichi Sankyo Company Limited, Novartis AG, Viatris Inc, Par Pharmaceutical, Hikma Pharmaceuticals PLC, Caplin Steriles Ltd, AuroMedics Pharma LLC, Fresenius Kabi USA, Mitsubishi Tanabe Pharma, and Pfizer Inc are analyzed in detail.
Global Argatroban Market Structure & Competitive Dynamics
The global argatroban market exhibits a moderately concentrated structure, with a few major players holding significant market share. The market is characterized by a dynamic innovation ecosystem, driven by ongoing research and development efforts to improve argatroban formulations and delivery methods. Regulatory frameworks, particularly those governing drug approvals and pricing, significantly influence market dynamics. While direct substitutes for argatroban are limited, alternative anticoagulants present indirect competition. End-user trends, particularly shifting preferences towards outpatient care and cost-effectiveness, shape market demand. Mergers and acquisitions (M&A) activities have played a role in shaping the competitive landscape, with deal values fluctuating depending on the target company's size and market position. For instance, in 2024, the total M&A value in the sector was estimated to be around XX Million. The market share held by the top three players in 2024 was approximately XX%, with the remaining share distributed across numerous smaller players.
Global Argatroban Market Industry Trends & Insights
The global argatroban market is projected to experience a Compound Annual Growth Rate (CAGR) of XX% during the forecast period (2025-2033). This growth is fueled by several factors, including the rising prevalence of conditions like Heparin-Induced Thrombocytopenia (HIT), increasing geriatric population, and the growing adoption of minimally invasive surgical procedures, such as percutaneous coronary intervention. Technological advancements in drug delivery systems and improved efficacy profiles are further driving market expansion. However, generic competition and stringent regulatory requirements pose challenges to market growth. The market penetration of argatroban is expected to increase steadily, driven by growing awareness among healthcare professionals and patients about the drug's benefits. The competitive dynamics are characterized by intense rivalry among established players and the emergence of new entrants with generic formulations.
Dominant Markets & Segments in Global Argatroban Market
The Heparin-Induced Thrombocytopenia (HIT) indication segment is currently the dominant segment in the global argatroban market, owing to the significant unmet need for safe and effective anticoagulant therapy in this specific patient population. North America holds the largest regional market share, driven by high healthcare expenditure, robust healthcare infrastructure, and a large patient pool.
Key Drivers of Dominance in North America:
- High prevalence of HIT and other indications.
- Advanced healthcare infrastructure and technological advancements.
- High healthcare expenditure.
Key Drivers of Dominance in HIT Indication:
- High unmet medical need for safe and effective anticoagulation in HIT patients.
- Growing awareness about the benefits of argatroban compared to alternative anticoagulants.
- Increasing adoption of argatroban in hospitals and specialized clinics.
The Hospital Pharmacies segment dominates the end-user market, owing to the primary administration of argatroban in hospital settings.
- Key Drivers of Dominance in Hospital Pharmacies:
- Argatroban's primary administration method requiring sophisticated hospital infrastructure.
- Direct accessibility to specialist medical professionals and monitoring equipment.
- Higher likelihood of HIT diagnosis and treatment in hospital settings.
Global Argatroban Market Product Innovations
Recent innovations in the argatroban market have focused on improving the drug's formulation, delivery systems, and overall efficacy. These innovations have enhanced patient convenience and compliance, while simultaneously minimizing potential side effects. Technological advancements have led to more precise dosing and targeted drug delivery, further improving treatment outcomes. The market is seeing a trend toward biosimilar and generic formulations, creating more cost-effective alternatives. These developments are driving increased competition and enhancing market accessibility.
Report Segmentation & Scope
This report segments the global argatroban market by indication and end-user. The indication segments include Buerger's Disease, Arteriosclerosis Obliterans, Heparin-Induced Thrombocytopenia (HIT), Percutaneous Coronary Intervention, and Other Indications. Each segment's market size, growth projections, and competitive dynamics are analyzed. Similarly, the end-user segments comprise Hospital Pharmacies, Retail Pharmacies, and Other End Users, each assessed for market size, growth potential, and competitive landscape. The forecast period (2025-2033) provides a projection for each segment's market performance.
Key Drivers of Global Argatroban Market Growth
Several factors propel the growth of the global argatroban market. Technological advancements in formulation and delivery enhance efficacy and convenience. The increasing prevalence of conditions like HIT creates significant demand. Favorable regulatory environments in various regions simplify market entry and expand accessibility. The rising geriatric population represents a substantial patient pool requiring anticoagulation therapy. Lastly, growing awareness among healthcare professionals and patients increases the adoption of argatroban.
Challenges in the Global Argatroban Market Sector
The global argatroban market faces various challenges. Stringent regulatory requirements for drug approvals increase development costs and timelines, impacting market entry. Generic competition creates pricing pressure, impacting profitability. Supply chain disruptions can affect availability and affordability. Furthermore, the complex manufacturing process adds to the production cost, restricting affordability and overall market accessibility. The estimated impact of these challenges on market growth is approximately XX Million annually in lost revenue.
Leading Players in the Global Argatroban Market
- Daiichi Sankyo Company Limited
- Novartis AG
- Viatris Inc
- Par Pharmaceutical
- Hikma Pharmaceuticals PLC
- Caplin Steriles Ltd
- AuroMedics Pharma LLC
- Fresenius Kabi USA
- Mitsubishi Tanabe Pharma
- Pfizer Inc
Key Developments in Global Argatroban Market Sector
- June 2021: Accord Healthcare received FDA approval for Argatroban in Sodium Chloride. This expanded the drug's market reach and broadened treatment options.
- January 2021: Caplin Steriles Limited received FDA approval for its argatroban injection, increasing generic competition and potentially lowering prices.
Strategic Global Argatroban Market Outlook
The global argatroban market presents substantial growth potential over the forecast period. Continued innovation in drug delivery and formulation, alongside a growing awareness of its benefits, will drive market expansion. Strategic partnerships and collaborations between pharmaceutical companies will pave the way for new product introductions and improved market accessibility. Focusing on emerging markets and untapped patient populations will also unlock significant growth opportunities. The strategic outlook for the market is positive, with significant potential for growth and development.
Global Argatroban Market Segmentation
-
1. Indication
- 1.1. Buerger's Disease
- 1.2. Arteriosclerosis Obliterans
- 1.3. Heparin-Induced Thrombocytopenia (HIT)
- 1.4. Percutaneous Coronary Intervention
- 1.5. Other Indications
-
2. End User
- 2.1. Hospital Pharmacies
- 2.2. Retail Pharmacies
- 2.3. Other End Users
Global Argatroban Market Segmentation By Geography
-
1. North America
- 1.1. United States
- 1.2. Canada
- 1.3. Mexico
-
2. Europe
- 2.1. Germany
- 2.2. United Kingdom
- 2.3. France
- 2.4. Italy
- 2.5. Spain
- 2.6. Rest of Europe
-
3. Asia Pacific
- 3.1. China
- 3.2. Japan
- 3.3. India
- 3.4. Australia
- 3.5. South Korea
- 3.6. Rest of Asia Pacific
-
4. Middle East and Africa
- 4.1. GCC
- 4.2. South Africa
- 4.3. Rest of Middle East and Africa
-
5. South America
- 5.1. Brazil
- 5.2. Argentina
- 5.3. Rest of South America
Global Argatroban Market REPORT HIGHLIGHTS
| Aspects | Details |
|---|---|
| Study Period | 2019-2033 |
| Base Year | 2024 |
| Estimated Year | 2025 |
| Forecast Period | 2025-2033 |
| Historical Period | 2019-2024 |
| Growth Rate | CAGR of 3.50% from 2019-2033 |
| Segmentation |
|
Table of Contents
- 1. Introduction
- 1.1. Research Scope
- 1.2. Market Segmentation
- 1.3. Research Methodology
- 1.4. Definitions and Assumptions
- 2. Executive Summary
- 2.1. Introduction
- 3. Market Dynamics
- 3.1. Introduction
- 3.2. Market Drivers
- 3.2.1. Increased Use of Argatroban in Heparin-induced Thrombocytopenia; Increase in Prevalence of Cerebral Venous Thrombosis
- 3.3. Market Restrains
- 3.3.1. Side Effects and Related Allergies of Argatroban
- 3.4. Market Trends
- 3.4.1. Heparin-Induced Thrombocytopenia (HIT) is Expected to Dominate the Market Over the Forecast Period
- 4. Market Factor Analysis
- 4.1. Porters Five Forces
- 4.2. Supply/Value Chain
- 4.3. PESTEL analysis
- 4.4. Market Entropy
- 4.5. Patent/Trademark Analysis
- 5. Global Argatroban Market Analysis, Insights and Forecast, 2019-2031
- 5.1. Market Analysis, Insights and Forecast - by Indication
- 5.1.1. Buerger's Disease
- 5.1.2. Arteriosclerosis Obliterans
- 5.1.3. Heparin-Induced Thrombocytopenia (HIT)
- 5.1.4. Percutaneous Coronary Intervention
- 5.1.5. Other Indications
- 5.2. Market Analysis, Insights and Forecast - by End User
- 5.2.1. Hospital Pharmacies
- 5.2.2. Retail Pharmacies
- 5.2.3. Other End Users
- 5.3. Market Analysis, Insights and Forecast - by Region
- 5.3.1. North America
- 5.3.2. Europe
- 5.3.3. Asia Pacific
- 5.3.4. Middle East and Africa
- 5.3.5. South America
- 5.1. Market Analysis, Insights and Forecast - by Indication
- 6. North America Global Argatroban Market Analysis, Insights and Forecast, 2019-2031
- 6.1. Market Analysis, Insights and Forecast - by Indication
- 6.1.1. Buerger's Disease
- 6.1.2. Arteriosclerosis Obliterans
- 6.1.3. Heparin-Induced Thrombocytopenia (HIT)
- 6.1.4. Percutaneous Coronary Intervention
- 6.1.5. Other Indications
- 6.2. Market Analysis, Insights and Forecast - by End User
- 6.2.1. Hospital Pharmacies
- 6.2.2. Retail Pharmacies
- 6.2.3. Other End Users
- 6.1. Market Analysis, Insights and Forecast - by Indication
- 7. Europe Global Argatroban Market Analysis, Insights and Forecast, 2019-2031
- 7.1. Market Analysis, Insights and Forecast - by Indication
- 7.1.1. Buerger's Disease
- 7.1.2. Arteriosclerosis Obliterans
- 7.1.3. Heparin-Induced Thrombocytopenia (HIT)
- 7.1.4. Percutaneous Coronary Intervention
- 7.1.5. Other Indications
- 7.2. Market Analysis, Insights and Forecast - by End User
- 7.2.1. Hospital Pharmacies
- 7.2.2. Retail Pharmacies
- 7.2.3. Other End Users
- 7.1. Market Analysis, Insights and Forecast - by Indication
- 8. Asia Pacific Global Argatroban Market Analysis, Insights and Forecast, 2019-2031
- 8.1. Market Analysis, Insights and Forecast - by Indication
- 8.1.1. Buerger's Disease
- 8.1.2. Arteriosclerosis Obliterans
- 8.1.3. Heparin-Induced Thrombocytopenia (HIT)
- 8.1.4. Percutaneous Coronary Intervention
- 8.1.5. Other Indications
- 8.2. Market Analysis, Insights and Forecast - by End User
- 8.2.1. Hospital Pharmacies
- 8.2.2. Retail Pharmacies
- 8.2.3. Other End Users
- 8.1. Market Analysis, Insights and Forecast - by Indication
- 9. Middle East and Africa Global Argatroban Market Analysis, Insights and Forecast, 2019-2031
- 9.1. Market Analysis, Insights and Forecast - by Indication
- 9.1.1. Buerger's Disease
- 9.1.2. Arteriosclerosis Obliterans
- 9.1.3. Heparin-Induced Thrombocytopenia (HIT)
- 9.1.4. Percutaneous Coronary Intervention
- 9.1.5. Other Indications
- 9.2. Market Analysis, Insights and Forecast - by End User
- 9.2.1. Hospital Pharmacies
- 9.2.2. Retail Pharmacies
- 9.2.3. Other End Users
- 9.1. Market Analysis, Insights and Forecast - by Indication
- 10. South America Global Argatroban Market Analysis, Insights and Forecast, 2019-2031
- 10.1. Market Analysis, Insights and Forecast - by Indication
- 10.1.1. Buerger's Disease
- 10.1.2. Arteriosclerosis Obliterans
- 10.1.3. Heparin-Induced Thrombocytopenia (HIT)
- 10.1.4. Percutaneous Coronary Intervention
- 10.1.5. Other Indications
- 10.2. Market Analysis, Insights and Forecast - by End User
- 10.2.1. Hospital Pharmacies
- 10.2.2. Retail Pharmacies
- 10.2.3. Other End Users
- 10.1. Market Analysis, Insights and Forecast - by Indication
- 11. North America Global Argatroban Market Analysis, Insights and Forecast, 2019-2031
- 11.1. Market Analysis, Insights and Forecast - By Country/Sub-region
- 11.1.1 United States
- 11.1.2 Canada
- 11.1.3 Mexico
- 12. Europe Global Argatroban Market Analysis, Insights and Forecast, 2019-2031
- 12.1. Market Analysis, Insights and Forecast - By Country/Sub-region
- 12.1.1 Germany
- 12.1.2 United Kingdom
- 12.1.3 France
- 12.1.4 Italy
- 12.1.5 Spain
- 12.1.6 Rest of Europe
- 13. Asia Pacific Global Argatroban Market Analysis, Insights and Forecast, 2019-2031
- 13.1. Market Analysis, Insights and Forecast - By Country/Sub-region
- 13.1.1 China
- 13.1.2 Japan
- 13.1.3 India
- 13.1.4 Australia
- 13.1.5 South Korea
- 13.1.6 Rest of Asia Pacific
- 14. Middle East and Africa Global Argatroban Market Analysis, Insights and Forecast, 2019-2031
- 14.1. Market Analysis, Insights and Forecast - By Country/Sub-region
- 14.1.1 GCC
- 14.1.2 South Africa
- 14.1.3 Rest of Middle East and Africa
- 15. South America Global Argatroban Market Analysis, Insights and Forecast, 2019-2031
- 15.1. Market Analysis, Insights and Forecast - By Country/Sub-region
- 15.1.1 Brazil
- 15.1.2 Argentina
- 15.1.3 Rest of South America
- 16. Competitive Analysis
- 16.1. Market Share Analysis 2024
- 16.2. Company Profiles
- 16.2.1 Daiichi Sankyo Company Limited
- 16.2.1.1. Overview
- 16.2.1.2. Products
- 16.2.1.3. SWOT Analysis
- 16.2.1.4. Recent Developments
- 16.2.1.5. Financials (Based on Availability)
- 16.2.2 Novartis AG
- 16.2.2.1. Overview
- 16.2.2.2. Products
- 16.2.2.3. SWOT Analysis
- 16.2.2.4. Recent Developments
- 16.2.2.5. Financials (Based on Availability)
- 16.2.3 Viatris Inc
- 16.2.3.1. Overview
- 16.2.3.2. Products
- 16.2.3.3. SWOT Analysis
- 16.2.3.4. Recent Developments
- 16.2.3.5. Financials (Based on Availability)
- 16.2.4 Par Pharmaceutical
- 16.2.4.1. Overview
- 16.2.4.2. Products
- 16.2.4.3. SWOT Analysis
- 16.2.4.4. Recent Developments
- 16.2.4.5. Financials (Based on Availability)
- 16.2.5 Hikma Pharmaceuticals PLC
- 16.2.5.1. Overview
- 16.2.5.2. Products
- 16.2.5.3. SWOT Analysis
- 16.2.5.4. Recent Developments
- 16.2.5.5. Financials (Based on Availability)
- 16.2.6 Caplin Steriles Ltd
- 16.2.6.1. Overview
- 16.2.6.2. Products
- 16.2.6.3. SWOT Analysis
- 16.2.6.4. Recent Developments
- 16.2.6.5. Financials (Based on Availability)
- 16.2.7 AuroMedics Pharma LLC
- 16.2.7.1. Overview
- 16.2.7.2. Products
- 16.2.7.3. SWOT Analysis
- 16.2.7.4. Recent Developments
- 16.2.7.5. Financials (Based on Availability)
- 16.2.8 Fresenius Kabi USA
- 16.2.8.1. Overview
- 16.2.8.2. Products
- 16.2.8.3. SWOT Analysis
- 16.2.8.4. Recent Developments
- 16.2.8.5. Financials (Based on Availability)
- 16.2.9 Mitsubishi Tanabe Pharma
- 16.2.9.1. Overview
- 16.2.9.2. Products
- 16.2.9.3. SWOT Analysis
- 16.2.9.4. Recent Developments
- 16.2.9.5. Financials (Based on Availability)
- 16.2.10 Pfizer Inc
- 16.2.10.1. Overview
- 16.2.10.2. Products
- 16.2.10.3. SWOT Analysis
- 16.2.10.4. Recent Developments
- 16.2.10.5. Financials (Based on Availability)
- 16.2.1 Daiichi Sankyo Company Limited
List of Figures
- Figure 1: Global Global Argatroban Market Revenue Breakdown (Million, %) by Region 2024 & 2032
- Figure 2: Global Global Argatroban Market Volume Breakdown (K Unit, %) by Region 2024 & 2032
- Figure 3: North America Global Argatroban Market Revenue (Million), by Country 2024 & 2032
- Figure 4: North America Global Argatroban Market Volume (K Unit), by Country 2024 & 2032
- Figure 5: North America Global Argatroban Market Revenue Share (%), by Country 2024 & 2032
- Figure 6: North America Global Argatroban Market Volume Share (%), by Country 2024 & 2032
- Figure 7: Europe Global Argatroban Market Revenue (Million), by Country 2024 & 2032
- Figure 8: Europe Global Argatroban Market Volume (K Unit), by Country 2024 & 2032
- Figure 9: Europe Global Argatroban Market Revenue Share (%), by Country 2024 & 2032
- Figure 10: Europe Global Argatroban Market Volume Share (%), by Country 2024 & 2032
- Figure 11: Asia Pacific Global Argatroban Market Revenue (Million), by Country 2024 & 2032
- Figure 12: Asia Pacific Global Argatroban Market Volume (K Unit), by Country 2024 & 2032
- Figure 13: Asia Pacific Global Argatroban Market Revenue Share (%), by Country 2024 & 2032
- Figure 14: Asia Pacific Global Argatroban Market Volume Share (%), by Country 2024 & 2032
- Figure 15: Middle East and Africa Global Argatroban Market Revenue (Million), by Country 2024 & 2032
- Figure 16: Middle East and Africa Global Argatroban Market Volume (K Unit), by Country 2024 & 2032
- Figure 17: Middle East and Africa Global Argatroban Market Revenue Share (%), by Country 2024 & 2032
- Figure 18: Middle East and Africa Global Argatroban Market Volume Share (%), by Country 2024 & 2032
- Figure 19: South America Global Argatroban Market Revenue (Million), by Country 2024 & 2032
- Figure 20: South America Global Argatroban Market Volume (K Unit), by Country 2024 & 2032
- Figure 21: South America Global Argatroban Market Revenue Share (%), by Country 2024 & 2032
- Figure 22: South America Global Argatroban Market Volume Share (%), by Country 2024 & 2032
- Figure 23: North America Global Argatroban Market Revenue (Million), by Indication 2024 & 2032
- Figure 24: North America Global Argatroban Market Volume (K Unit), by Indication 2024 & 2032
- Figure 25: North America Global Argatroban Market Revenue Share (%), by Indication 2024 & 2032
- Figure 26: North America Global Argatroban Market Volume Share (%), by Indication 2024 & 2032
- Figure 27: North America Global Argatroban Market Revenue (Million), by End User 2024 & 2032
- Figure 28: North America Global Argatroban Market Volume (K Unit), by End User 2024 & 2032
- Figure 29: North America Global Argatroban Market Revenue Share (%), by End User 2024 & 2032
- Figure 30: North America Global Argatroban Market Volume Share (%), by End User 2024 & 2032
- Figure 31: North America Global Argatroban Market Revenue (Million), by Country 2024 & 2032
- Figure 32: North America Global Argatroban Market Volume (K Unit), by Country 2024 & 2032
- Figure 33: North America Global Argatroban Market Revenue Share (%), by Country 2024 & 2032
- Figure 34: North America Global Argatroban Market Volume Share (%), by Country 2024 & 2032
- Figure 35: Europe Global Argatroban Market Revenue (Million), by Indication 2024 & 2032
- Figure 36: Europe Global Argatroban Market Volume (K Unit), by Indication 2024 & 2032
- Figure 37: Europe Global Argatroban Market Revenue Share (%), by Indication 2024 & 2032
- Figure 38: Europe Global Argatroban Market Volume Share (%), by Indication 2024 & 2032
- Figure 39: Europe Global Argatroban Market Revenue (Million), by End User 2024 & 2032
- Figure 40: Europe Global Argatroban Market Volume (K Unit), by End User 2024 & 2032
- Figure 41: Europe Global Argatroban Market Revenue Share (%), by End User 2024 & 2032
- Figure 42: Europe Global Argatroban Market Volume Share (%), by End User 2024 & 2032
- Figure 43: Europe Global Argatroban Market Revenue (Million), by Country 2024 & 2032
- Figure 44: Europe Global Argatroban Market Volume (K Unit), by Country 2024 & 2032
- Figure 45: Europe Global Argatroban Market Revenue Share (%), by Country 2024 & 2032
- Figure 46: Europe Global Argatroban Market Volume Share (%), by Country 2024 & 2032
- Figure 47: Asia Pacific Global Argatroban Market Revenue (Million), by Indication 2024 & 2032
- Figure 48: Asia Pacific Global Argatroban Market Volume (K Unit), by Indication 2024 & 2032
- Figure 49: Asia Pacific Global Argatroban Market Revenue Share (%), by Indication 2024 & 2032
- Figure 50: Asia Pacific Global Argatroban Market Volume Share (%), by Indication 2024 & 2032
- Figure 51: Asia Pacific Global Argatroban Market Revenue (Million), by End User 2024 & 2032
- Figure 52: Asia Pacific Global Argatroban Market Volume (K Unit), by End User 2024 & 2032
- Figure 53: Asia Pacific Global Argatroban Market Revenue Share (%), by End User 2024 & 2032
- Figure 54: Asia Pacific Global Argatroban Market Volume Share (%), by End User 2024 & 2032
- Figure 55: Asia Pacific Global Argatroban Market Revenue (Million), by Country 2024 & 2032
- Figure 56: Asia Pacific Global Argatroban Market Volume (K Unit), by Country 2024 & 2032
- Figure 57: Asia Pacific Global Argatroban Market Revenue Share (%), by Country 2024 & 2032
- Figure 58: Asia Pacific Global Argatroban Market Volume Share (%), by Country 2024 & 2032
- Figure 59: Middle East and Africa Global Argatroban Market Revenue (Million), by Indication 2024 & 2032
- Figure 60: Middle East and Africa Global Argatroban Market Volume (K Unit), by Indication 2024 & 2032
- Figure 61: Middle East and Africa Global Argatroban Market Revenue Share (%), by Indication 2024 & 2032
- Figure 62: Middle East and Africa Global Argatroban Market Volume Share (%), by Indication 2024 & 2032
- Figure 63: Middle East and Africa Global Argatroban Market Revenue (Million), by End User 2024 & 2032
- Figure 64: Middle East and Africa Global Argatroban Market Volume (K Unit), by End User 2024 & 2032
- Figure 65: Middle East and Africa Global Argatroban Market Revenue Share (%), by End User 2024 & 2032
- Figure 66: Middle East and Africa Global Argatroban Market Volume Share (%), by End User 2024 & 2032
- Figure 67: Middle East and Africa Global Argatroban Market Revenue (Million), by Country 2024 & 2032
- Figure 68: Middle East and Africa Global Argatroban Market Volume (K Unit), by Country 2024 & 2032
- Figure 69: Middle East and Africa Global Argatroban Market Revenue Share (%), by Country 2024 & 2032
- Figure 70: Middle East and Africa Global Argatroban Market Volume Share (%), by Country 2024 & 2032
- Figure 71: South America Global Argatroban Market Revenue (Million), by Indication 2024 & 2032
- Figure 72: South America Global Argatroban Market Volume (K Unit), by Indication 2024 & 2032
- Figure 73: South America Global Argatroban Market Revenue Share (%), by Indication 2024 & 2032
- Figure 74: South America Global Argatroban Market Volume Share (%), by Indication 2024 & 2032
- Figure 75: South America Global Argatroban Market Revenue (Million), by End User 2024 & 2032
- Figure 76: South America Global Argatroban Market Volume (K Unit), by End User 2024 & 2032
- Figure 77: South America Global Argatroban Market Revenue Share (%), by End User 2024 & 2032
- Figure 78: South America Global Argatroban Market Volume Share (%), by End User 2024 & 2032
- Figure 79: South America Global Argatroban Market Revenue (Million), by Country 2024 & 2032
- Figure 80: South America Global Argatroban Market Volume (K Unit), by Country 2024 & 2032
- Figure 81: South America Global Argatroban Market Revenue Share (%), by Country 2024 & 2032
- Figure 82: South America Global Argatroban Market Volume Share (%), by Country 2024 & 2032
List of Tables
- Table 1: Global Argatroban Market Revenue Million Forecast, by Region 2019 & 2032
- Table 2: Global Argatroban Market Volume K Unit Forecast, by Region 2019 & 2032
- Table 3: Global Argatroban Market Revenue Million Forecast, by Indication 2019 & 2032
- Table 4: Global Argatroban Market Volume K Unit Forecast, by Indication 2019 & 2032
- Table 5: Global Argatroban Market Revenue Million Forecast, by End User 2019 & 2032
- Table 6: Global Argatroban Market Volume K Unit Forecast, by End User 2019 & 2032
- Table 7: Global Argatroban Market Revenue Million Forecast, by Region 2019 & 2032
- Table 8: Global Argatroban Market Volume K Unit Forecast, by Region 2019 & 2032
- Table 9: Global Argatroban Market Revenue Million Forecast, by Country 2019 & 2032
- Table 10: Global Argatroban Market Volume K Unit Forecast, by Country 2019 & 2032
- Table 11: United States Global Argatroban Market Revenue (Million) Forecast, by Application 2019 & 2032
- Table 12: United States Global Argatroban Market Volume (K Unit) Forecast, by Application 2019 & 2032
- Table 13: Canada Global Argatroban Market Revenue (Million) Forecast, by Application 2019 & 2032
- Table 14: Canada Global Argatroban Market Volume (K Unit) Forecast, by Application 2019 & 2032
- Table 15: Mexico Global Argatroban Market Revenue (Million) Forecast, by Application 2019 & 2032
- Table 16: Mexico Global Argatroban Market Volume (K Unit) Forecast, by Application 2019 & 2032
- Table 17: Global Argatroban Market Revenue Million Forecast, by Country 2019 & 2032
- Table 18: Global Argatroban Market Volume K Unit Forecast, by Country 2019 & 2032
- Table 19: Germany Global Argatroban Market Revenue (Million) Forecast, by Application 2019 & 2032
- Table 20: Germany Global Argatroban Market Volume (K Unit) Forecast, by Application 2019 & 2032
- Table 21: United Kingdom Global Argatroban Market Revenue (Million) Forecast, by Application 2019 & 2032
- Table 22: United Kingdom Global Argatroban Market Volume (K Unit) Forecast, by Application 2019 & 2032
- Table 23: France Global Argatroban Market Revenue (Million) Forecast, by Application 2019 & 2032
- Table 24: France Global Argatroban Market Volume (K Unit) Forecast, by Application 2019 & 2032
- Table 25: Italy Global Argatroban Market Revenue (Million) Forecast, by Application 2019 & 2032
- Table 26: Italy Global Argatroban Market Volume (K Unit) Forecast, by Application 2019 & 2032
- Table 27: Spain Global Argatroban Market Revenue (Million) Forecast, by Application 2019 & 2032
- Table 28: Spain Global Argatroban Market Volume (K Unit) Forecast, by Application 2019 & 2032
- Table 29: Rest of Europe Global Argatroban Market Revenue (Million) Forecast, by Application 2019 & 2032
- Table 30: Rest of Europe Global Argatroban Market Volume (K Unit) Forecast, by Application 2019 & 2032
- Table 31: Global Argatroban Market Revenue Million Forecast, by Country 2019 & 2032
- Table 32: Global Argatroban Market Volume K Unit Forecast, by Country 2019 & 2032
- Table 33: China Global Argatroban Market Revenue (Million) Forecast, by Application 2019 & 2032
- Table 34: China Global Argatroban Market Volume (K Unit) Forecast, by Application 2019 & 2032
- Table 35: Japan Global Argatroban Market Revenue (Million) Forecast, by Application 2019 & 2032
- Table 36: Japan Global Argatroban Market Volume (K Unit) Forecast, by Application 2019 & 2032
- Table 37: India Global Argatroban Market Revenue (Million) Forecast, by Application 2019 & 2032
- Table 38: India Global Argatroban Market Volume (K Unit) Forecast, by Application 2019 & 2032
- Table 39: Australia Global Argatroban Market Revenue (Million) Forecast, by Application 2019 & 2032
- Table 40: Australia Global Argatroban Market Volume (K Unit) Forecast, by Application 2019 & 2032
- Table 41: South Korea Global Argatroban Market Revenue (Million) Forecast, by Application 2019 & 2032
- Table 42: South Korea Global Argatroban Market Volume (K Unit) Forecast, by Application 2019 & 2032
- Table 43: Rest of Asia Pacific Global Argatroban Market Revenue (Million) Forecast, by Application 2019 & 2032
- Table 44: Rest of Asia Pacific Global Argatroban Market Volume (K Unit) Forecast, by Application 2019 & 2032
- Table 45: Global Argatroban Market Revenue Million Forecast, by Country 2019 & 2032
- Table 46: Global Argatroban Market Volume K Unit Forecast, by Country 2019 & 2032
- Table 47: GCC Global Argatroban Market Revenue (Million) Forecast, by Application 2019 & 2032
- Table 48: GCC Global Argatroban Market Volume (K Unit) Forecast, by Application 2019 & 2032
- Table 49: South Africa Global Argatroban Market Revenue (Million) Forecast, by Application 2019 & 2032
- Table 50: South Africa Global Argatroban Market Volume (K Unit) Forecast, by Application 2019 & 2032
- Table 51: Rest of Middle East and Africa Global Argatroban Market Revenue (Million) Forecast, by Application 2019 & 2032
- Table 52: Rest of Middle East and Africa Global Argatroban Market Volume (K Unit) Forecast, by Application 2019 & 2032
- Table 53: Global Argatroban Market Revenue Million Forecast, by Country 2019 & 2032
- Table 54: Global Argatroban Market Volume K Unit Forecast, by Country 2019 & 2032
- Table 55: Brazil Global Argatroban Market Revenue (Million) Forecast, by Application 2019 & 2032
- Table 56: Brazil Global Argatroban Market Volume (K Unit) Forecast, by Application 2019 & 2032
- Table 57: Argentina Global Argatroban Market Revenue (Million) Forecast, by Application 2019 & 2032
- Table 58: Argentina Global Argatroban Market Volume (K Unit) Forecast, by Application 2019 & 2032
- Table 59: Rest of South America Global Argatroban Market Revenue (Million) Forecast, by Application 2019 & 2032
- Table 60: Rest of South America Global Argatroban Market Volume (K Unit) Forecast, by Application 2019 & 2032
- Table 61: Global Argatroban Market Revenue Million Forecast, by Indication 2019 & 2032
- Table 62: Global Argatroban Market Volume K Unit Forecast, by Indication 2019 & 2032
- Table 63: Global Argatroban Market Revenue Million Forecast, by End User 2019 & 2032
- Table 64: Global Argatroban Market Volume K Unit Forecast, by End User 2019 & 2032
- Table 65: Global Argatroban Market Revenue Million Forecast, by Country 2019 & 2032
- Table 66: Global Argatroban Market Volume K Unit Forecast, by Country 2019 & 2032
- Table 67: United States Global Argatroban Market Revenue (Million) Forecast, by Application 2019 & 2032
- Table 68: United States Global Argatroban Market Volume (K Unit) Forecast, by Application 2019 & 2032
- Table 69: Canada Global Argatroban Market Revenue (Million) Forecast, by Application 2019 & 2032
- Table 70: Canada Global Argatroban Market Volume (K Unit) Forecast, by Application 2019 & 2032
- Table 71: Mexico Global Argatroban Market Revenue (Million) Forecast, by Application 2019 & 2032
- Table 72: Mexico Global Argatroban Market Volume (K Unit) Forecast, by Application 2019 & 2032
- Table 73: Global Argatroban Market Revenue Million Forecast, by Indication 2019 & 2032
- Table 74: Global Argatroban Market Volume K Unit Forecast, by Indication 2019 & 2032
- Table 75: Global Argatroban Market Revenue Million Forecast, by End User 2019 & 2032
- Table 76: Global Argatroban Market Volume K Unit Forecast, by End User 2019 & 2032
- Table 77: Global Argatroban Market Revenue Million Forecast, by Country 2019 & 2032
- Table 78: Global Argatroban Market Volume K Unit Forecast, by Country 2019 & 2032
- Table 79: Germany Global Argatroban Market Revenue (Million) Forecast, by Application 2019 & 2032
- Table 80: Germany Global Argatroban Market Volume (K Unit) Forecast, by Application 2019 & 2032
- Table 81: United Kingdom Global Argatroban Market Revenue (Million) Forecast, by Application 2019 & 2032
- Table 82: United Kingdom Global Argatroban Market Volume (K Unit) Forecast, by Application 2019 & 2032
- Table 83: France Global Argatroban Market Revenue (Million) Forecast, by Application 2019 & 2032
- Table 84: France Global Argatroban Market Volume (K Unit) Forecast, by Application 2019 & 2032
- Table 85: Italy Global Argatroban Market Revenue (Million) Forecast, by Application 2019 & 2032
- Table 86: Italy Global Argatroban Market Volume (K Unit) Forecast, by Application 2019 & 2032
- Table 87: Spain Global Argatroban Market Revenue (Million) Forecast, by Application 2019 & 2032
- Table 88: Spain Global Argatroban Market Volume (K Unit) Forecast, by Application 2019 & 2032
- Table 89: Rest of Europe Global Argatroban Market Revenue (Million) Forecast, by Application 2019 & 2032
- Table 90: Rest of Europe Global Argatroban Market Volume (K Unit) Forecast, by Application 2019 & 2032
- Table 91: Global Argatroban Market Revenue Million Forecast, by Indication 2019 & 2032
- Table 92: Global Argatroban Market Volume K Unit Forecast, by Indication 2019 & 2032
- Table 93: Global Argatroban Market Revenue Million Forecast, by End User 2019 & 2032
- Table 94: Global Argatroban Market Volume K Unit Forecast, by End User 2019 & 2032
- Table 95: Global Argatroban Market Revenue Million Forecast, by Country 2019 & 2032
- Table 96: Global Argatroban Market Volume K Unit Forecast, by Country 2019 & 2032
- Table 97: China Global Argatroban Market Revenue (Million) Forecast, by Application 2019 & 2032
- Table 98: China Global Argatroban Market Volume (K Unit) Forecast, by Application 2019 & 2032
- Table 99: Japan Global Argatroban Market Revenue (Million) Forecast, by Application 2019 & 2032
- Table 100: Japan Global Argatroban Market Volume (K Unit) Forecast, by Application 2019 & 2032
- Table 101: India Global Argatroban Market Revenue (Million) Forecast, by Application 2019 & 2032
- Table 102: India Global Argatroban Market Volume (K Unit) Forecast, by Application 2019 & 2032
- Table 103: Australia Global Argatroban Market Revenue (Million) Forecast, by Application 2019 & 2032
- Table 104: Australia Global Argatroban Market Volume (K Unit) Forecast, by Application 2019 & 2032
- Table 105: South Korea Global Argatroban Market Revenue (Million) Forecast, by Application 2019 & 2032
- Table 106: South Korea Global Argatroban Market Volume (K Unit) Forecast, by Application 2019 & 2032
- Table 107: Rest of Asia Pacific Global Argatroban Market Revenue (Million) Forecast, by Application 2019 & 2032
- Table 108: Rest of Asia Pacific Global Argatroban Market Volume (K Unit) Forecast, by Application 2019 & 2032
- Table 109: Global Argatroban Market Revenue Million Forecast, by Indication 2019 & 2032
- Table 110: Global Argatroban Market Volume K Unit Forecast, by Indication 2019 & 2032
- Table 111: Global Argatroban Market Revenue Million Forecast, by End User 2019 & 2032
- Table 112: Global Argatroban Market Volume K Unit Forecast, by End User 2019 & 2032
- Table 113: Global Argatroban Market Revenue Million Forecast, by Country 2019 & 2032
- Table 114: Global Argatroban Market Volume K Unit Forecast, by Country 2019 & 2032
- Table 115: GCC Global Argatroban Market Revenue (Million) Forecast, by Application 2019 & 2032
- Table 116: GCC Global Argatroban Market Volume (K Unit) Forecast, by Application 2019 & 2032
- Table 117: South Africa Global Argatroban Market Revenue (Million) Forecast, by Application 2019 & 2032
- Table 118: South Africa Global Argatroban Market Volume (K Unit) Forecast, by Application 2019 & 2032
- Table 119: Rest of Middle East and Africa Global Argatroban Market Revenue (Million) Forecast, by Application 2019 & 2032
- Table 120: Rest of Middle East and Africa Global Argatroban Market Volume (K Unit) Forecast, by Application 2019 & 2032
- Table 121: Global Argatroban Market Revenue Million Forecast, by Indication 2019 & 2032
- Table 122: Global Argatroban Market Volume K Unit Forecast, by Indication 2019 & 2032
- Table 123: Global Argatroban Market Revenue Million Forecast, by End User 2019 & 2032
- Table 124: Global Argatroban Market Volume K Unit Forecast, by End User 2019 & 2032
- Table 125: Global Argatroban Market Revenue Million Forecast, by Country 2019 & 2032
- Table 126: Global Argatroban Market Volume K Unit Forecast, by Country 2019 & 2032
- Table 127: Brazil Global Argatroban Market Revenue (Million) Forecast, by Application 2019 & 2032
- Table 128: Brazil Global Argatroban Market Volume (K Unit) Forecast, by Application 2019 & 2032
- Table 129: Argentina Global Argatroban Market Revenue (Million) Forecast, by Application 2019 & 2032
- Table 130: Argentina Global Argatroban Market Volume (K Unit) Forecast, by Application 2019 & 2032
- Table 131: Rest of South America Global Argatroban Market Revenue (Million) Forecast, by Application 2019 & 2032
- Table 132: Rest of South America Global Argatroban Market Volume (K Unit) Forecast, by Application 2019 & 2032
Frequently Asked Questions
1. What is the projected Compound Annual Growth Rate (CAGR) of the Global Argatroban Market?
The projected CAGR is approximately 3.50%.
2. Which companies are prominent players in the Global Argatroban Market?
Key companies in the market include Daiichi Sankyo Company Limited, Novartis AG, Viatris Inc, Par Pharmaceutical, Hikma Pharmaceuticals PLC, Caplin Steriles Ltd, AuroMedics Pharma LLC, Fresenius Kabi USA, Mitsubishi Tanabe Pharma, Pfizer Inc.
3. What are the main segments of the Global Argatroban Market?
The market segments include Indication, End User.
4. Can you provide details about the market size?
The market size is estimated to be USD XX Million as of 2022.
5. What are some drivers contributing to market growth?
Increased Use of Argatroban in Heparin-induced Thrombocytopenia; Increase in Prevalence of Cerebral Venous Thrombosis.
6. What are the notable trends driving market growth?
Heparin-Induced Thrombocytopenia (HIT) is Expected to Dominate the Market Over the Forecast Period.
7. Are there any restraints impacting market growth?
Side Effects and Related Allergies of Argatroban.
8. Can you provide examples of recent developments in the market?
In June 2021, Accord Healthcare received the United States Food and Drug Administration approval for Argatroban in Sodium Chloride.
9. What pricing options are available for accessing the report?
Pricing options include single-user, multi-user, and enterprise licenses priced at USD 4750, USD 5250, and USD 8750 respectively.
10. Is the market size provided in terms of value or volume?
The market size is provided in terms of value, measured in Million and volume, measured in K Unit.
11. Are there any specific market keywords associated with the report?
Yes, the market keyword associated with the report is "Global Argatroban Market," which aids in identifying and referencing the specific market segment covered.
12. How do I determine which pricing option suits my needs best?
The pricing options vary based on user requirements and access needs. Individual users may opt for single-user licenses, while businesses requiring broader access may choose multi-user or enterprise licenses for cost-effective access to the report.
13. Are there any additional resources or data provided in the Global Argatroban Market report?
While the report offers comprehensive insights, it's advisable to review the specific contents or supplementary materials provided to ascertain if additional resources or data are available.
14. How can I stay updated on further developments or reports in the Global Argatroban Market?
To stay informed about further developments, trends, and reports in the Global Argatroban Market, consider subscribing to industry newsletters, following relevant companies and organizations, or regularly checking reputable industry news sources and publications.
Methodology
Step 1 - Identification of Relevant Samples Size from Population Database


Step 2 - Approaches for Defining Global Market Size (Value, Volume* & Price*)

Note*: In applicable scenarios
Step 3 - Data Sources
Primary Research
- Web Analytics
- Survey Reports
- Research Institute
- Latest Research Reports
- Opinion Leaders
Secondary Research
- Annual Reports
- White Paper
- Latest Press Release
- Industry Association
- Paid Database
- Investor Presentations

Step 4 - Data Triangulation
Involves using different sources of information in order to increase the validity of a study
These sources are likely to be stakeholders in a program - participants, other researchers, program staff, other community members, and so on.
Then we put all data in single framework & apply various statistical tools to find out the dynamic on the market.
During the analysis stage, feedback from the stakeholder groups would be compared to determine areas of agreement as well as areas of divergence


