

Key Insights
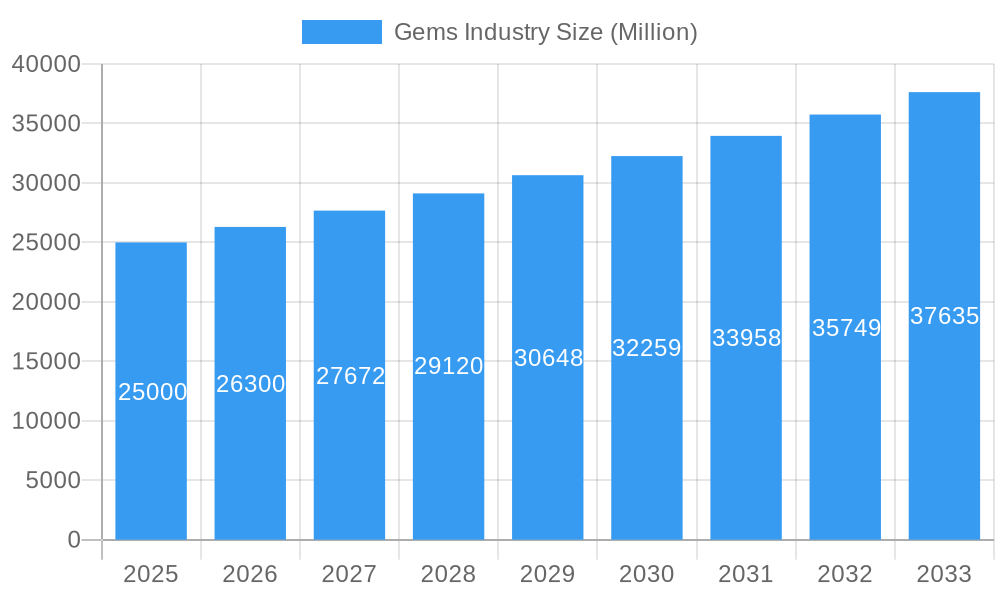
The global gemstones market, valued at approximately $12.7 billion in 2025, is projected for significant growth with a Compound Annual Growth Rate (CAGR) of 6.3% from 2025 to 2033. Key drivers include rising disposable incomes in emerging economies, particularly in Asia-Pacific, fueling demand for luxury items. Evolving consumer preferences for personalized and ethically sourced jewelry are also shaping market trends. The expansion of online retail channels enhances accessibility and convenience, boosting sales. Product diversification, including innovative designs and the integration of gemstones into various jewelry categories, further contributes to market expansion. Challenges include raw material price volatility, ethical sourcing scrutiny, and potential economic downturns affecting luxury spending. The market is segmented by product type (rings, necklaces, earrings, bracelets, chains & pendants, others) and distribution channels (offline and online retail). Major players such as The Swatch Group AG, Pandora, De Beers, LVMH, and Chow Tai Fook are influencing market dynamics through strategic initiatives. Asia-Pacific is expected to lead growth due to its expanding middle class, while North America and Europe will maintain substantial market shares.
Gems Industry Market Size (In Billion)
The competitive environment features established luxury brands and emerging players. Success hinges on strong branding, ethical sourcing, and effective omnichannel strategies. The forecast period (2025-2033) anticipates sustained growth driven by increasing consumer affluence, advancements in jewelry design and technology, and e-commerce expansion. Navigating geopolitical instability, supply chain disruptions, and economic fluctuations will be crucial. Continuous product innovation, targeted marketing, and a commitment to sustainability are essential for market success.
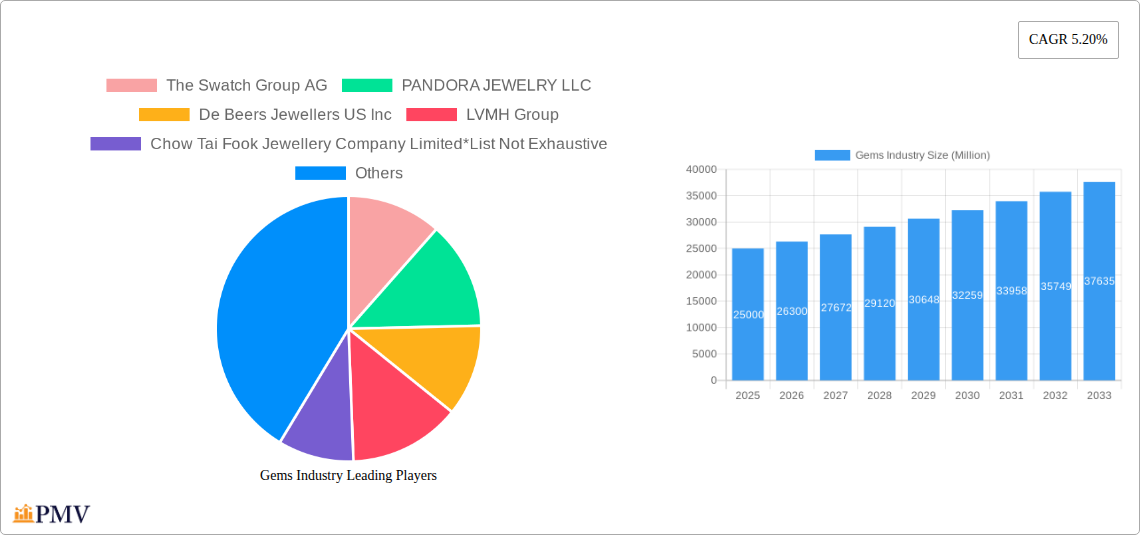
Gems Industry Company Market Share
Gems Industry Market Report: 2019-2033
This comprehensive report provides a detailed analysis of the global Gems Industry, projecting a market size of $XX Million by 2033. The study period covers 2019-2033, with 2025 as the base and estimated year. The report offers actionable insights into market structure, competitive dynamics, key trends, and future growth opportunities, empowering businesses to make informed strategic decisions. This in-depth analysis covers various segments, including product types (rings, necklaces, earrings, bracelets, chains & pendants, and other product types) and distribution channels (offline and online retail stores). Leading players such as The Swatch Group AG, PANDORA JEWELRY LLC, De Beers Jewellers US Inc, LVMH Group, and Chow Tai Fook Jewellery Company Limited are analyzed, along with market size projections and competitive landscapes.
Gems Industry Market Structure & Competitive Dynamics
The global gems industry presents a multifaceted market structure, characterized by a blend of dominant global conglomerates and a vibrant ecosystem of independent artisans and specialized businesses. While the industry's top players, including The Swatch Group AG, LVMH Group, and Richemont SA, collectively command a significant market presence, estimated at approximately **[Insert Percentage]%**, it's crucial to acknowledge the substantial contribution of a diverse array of smaller enterprises and bespoke jewelers to the overall market volume and richness.
Innovation is a cornerstone of the industry's evolution, propelled by advancements in cutting-edge gemstone enhancement technologies, sophisticated 3D design software, and the burgeoning landscape of e-commerce platforms. Navigating this dynamic environment also involves adherence to a complex web of international regulatory frameworks, which govern everything from ethical sourcing and supply chain transparency to stringent product labeling standards. The competitive arena is further shaped by the increasing viability of substitute materials, such as high-quality cubic zirconia and ethically produced lab-grown diamonds, which are gaining traction, particularly within the price-conscious consumer segment. Moreover, evolving end-user preferences, such as a growing demand for sustainable and traceable gemstones, alongside a desire for uniquely personalized jewelry pieces, are actively influencing product development trajectories and shaping innovative marketing strategies.
Mergers and acquisitions (M&A) have played a pivotal role in consolidating market positions and fostering strategic growth within the gems industry in recent years. Notable transactions, such as the acquisition of [Company A] by [Company B] in [Year] for an estimated $XX Million, underscore the strategic consolidation occurring within the sector. These M&A activities are often strategically driven by a desire to broaden diverse product portfolios, bolster extensive distribution networks, and gain crucial access to emerging technologies and untapped markets.
- Market Concentration: Approximately [Insert Percentage]% of the market is controlled by the top 5 players, highlighting the influence of major industry leaders.
- Average M&A Deal Value (2019-2024): The average M&A deal value over this period has been around $XX Million, indicating significant investment activity.
- Key Regulatory Factors: Critical regulatory considerations include adherence to ethical sourcing certifications (e.g., Kimberley Process), compliance with import/export regulations, and the implementation of robust consumer protection laws.
Gems Industry Industry Trends & Insights
The global gems industry is experiencing robust growth, projected at a CAGR of xx% during the forecast period (2025-2033). This growth is fueled by several key drivers, including rising disposable incomes in emerging markets, increasing consumer preference for luxury goods, and the growing popularity of online retail channels. Technological advancements, such as 3D printing and advanced gemstone cutting techniques, are enhancing efficiency and product design. Consumer preferences are evolving towards personalized and sustainable jewelry, leading to a rise in demand for ethically sourced gemstones and customizable pieces.
Competitive dynamics are intensifying, with established players facing increased competition from both emerging brands and online retailers. The market penetration of online retail channels is steadily growing, driven by enhanced e-commerce platforms and improved logistics. Furthermore, the rise of lab-grown diamonds presents a significant challenge to the traditional diamond industry, impacting pricing and market share.
Dominant Markets & Segments in Gems Industry
The Asia-Pacific region stands out as the preeminent market for gems globally, a dominance fueled by robust economic expansion, a burgeoning middle class with increasing disposable incomes, and a profound cultural heritage that imbues jewelry with deep significance. Within this region, China and India are particularly influential, representing substantial drivers of global gemstone and jewelry demand.
- By Product Type:
- Rings: These continue to hold the largest market share, largely owing to their enduring symbolic importance across various cultures and their universal appeal.
- Necklaces: Demand remains strong, driven by an ever-expanding array of designs and their inherent versatility for different occasions and styles.
- Earrings: This segment exhibits high growth potential, significantly influenced by dynamic fashion trends and a vast selection of styles catering to diverse tastes.
- Bracelets and Chains & Pendants: These categories maintain significant demand, particularly for specific styles, materials, and thematic collections.
- Other Product Types: This encompassing category includes a variety of decorative items such as brooches, cufflinks, and specialized adornments.
- By Distribution Channel:
- Offline Retail Stores: These remain the primary channel, offering the crucial tactile experience and personalized service that are integral to the luxury jewelry purchase journey.
- Online Retail Stores: This channel is experiencing a rapid surge in market share, propelled by enhanced convenience, broader accessibility, and the expanding reach of e-commerce platforms.
Key Drivers of Regional Dominance:
- Strong Economic Growth: Rising disposable incomes across key regions directly translate into increased consumer spending on premium and luxury goods, including fine jewelry.
- Cultural Significance: In many societies, jewelry is not merely an adornment but holds deep-seated cultural and symbolic importance, driving consistent demand.
- Established Infrastructure: Well-developed retail networks and robust supply chains in dominant regions facilitate market expansion and efficient product distribution.
Gems Industry Product Innovations
Recent innovations in the gems industry include the use of sustainable and ethically sourced materials, 3D printing for jewelry design and production, and the development of lab-grown diamonds with enhanced properties. These advancements cater to evolving consumer preferences for eco-friendly products, unique designs, and cost-effective alternatives. Technological advancements are improving the efficiency and precision of gemstone processing, leading to higher-quality products and reduced production costs.
Report Segmentation & Scope
This comprehensive report meticulously segments the Gems Industry, offering detailed analysis across key product categories: Rings, Necklaces, Earrings, Bracelets, Chains & Pendants, and Other Product Types. Furthermore, it examines the industry through the lens of its distribution channels, distinguishing between Offline Retail Stores and Online Retail Stores. Each segment has been rigorously analyzed to provide insights into its current market size, projected growth trajectories, and intricate competitive dynamics. It is noteworthy that growth projections exhibit considerable variance among segments, with the online retail sector demonstrating particularly robust expansion, largely attributed to the accelerated adoption of e-commerce and increasing digital consumer engagement. Similarly, competitive landscapes differ significantly, with some segments characterized by intense rivalry among numerous players, while others present a more fragmented market structure.
Key Drivers of Gems Industry Growth
The Gems Industry's growth is primarily driven by several factors: Rising disposable incomes in emerging economies fuel demand for luxury goods, including jewelry. Evolving consumer preferences toward personalized and sustainable products are driving innovation in design and sourcing. Technological advancements in gemstone processing, design, and distribution are improving efficiency and product quality. Finally, effective marketing and branding strategies by leading players enhance market penetration and brand loyalty.
Challenges in the Gems Industry Sector
The Gems Industry navigates a complex landscape fraught with several significant challenges. Supply chain volatility can lead to disruptions, impacting both the availability and cost of essential raw materials. The increasing global emphasis on ethical sourcing and stringent regulatory compliance necessitates the implementation of rigorous sourcing protocols and advanced traceability mechanisms, often leading to increased operational expenditures. The highly competitive market, populated by both established legacy brands and agile emerging players, demands continuous innovation in product design and effective, data-driven marketing strategies to secure and expand market share. Moreover, the inherent sensitivity of luxury goods consumption to macroeconomic fluctuations means that fluctuating global economic conditions can significantly influence consumer demand.
Leading Players in the Gems Industry Market
- The Swatch Group AG
- PANDORA JEWELRY LLC
- De Beers Jewellers US Inc
- LVMH Group
- Chow Tai Fook Jewellery Company Limited
- Richemont SA
- Swarovski Crystal Online AG
- Chow Tai Fook Jewelry Company Limited
- Tata Sons Private Ltd
- Signet Jewelers
Key Developments in Gems Industry Sector
August 2022: Pandora launched a new line of jewelry known as the 'Pandora Brilliance' in the United States and Canada. This line features diamonds produced from 100 percent renewable energy, grown in the United States. This launch significantly impacts the market by introducing a sustainable, ethically sourced diamond alternative.
August 2022: Louis Vuitton launched a new collection of Empreinte Fine Jewelry, drawing inspiration from the Maison's emblematic codes. This reinforces Louis Vuitton's position in the luxury jewelry market.
September 2022: Tanishq launched its new exclusive collection, "The Chola," inspired by the Chola Dynasty in Indian history. This collection targets a specific cultural segment and showcases Tanishq's heritage-driven approach to design.
Strategic Gems Industry Market Outlook
The Gems Industry is poised for continued growth, driven by increasing consumer demand, technological innovation, and the emergence of new markets. Strategic opportunities lie in capitalizing on the growing preference for sustainable and ethically sourced gems, expanding into emerging markets, and leveraging digital technologies to enhance the customer experience. Companies that successfully adapt to evolving consumer preferences and implement effective marketing strategies are best positioned for success in this dynamic market.
Gems Industry Segmentation
-
1. Product Type
- 1.1. Rings
- 1.2. Necklaces
- 1.3. Earrings
- 1.4. Bracelets
- 1.5. Chains and Pendants
- 1.6. Other Product Types
-
2. Distribution Channel
- 2.1. Offline Retail Stores
- 2.2. Online Retail Stores
Gems Industry Segmentation By Geography
-
1. North America
- 1.1. United States
- 1.2. Canada
- 1.3. Mexico
- 1.4. Rest of North America
-
2. Europe
- 2.1. Spain
- 2.2. United Kingdom
- 2.3. France
- 2.4. Germany
- 2.5. Russia
- 2.6. Italy
- 2.7. Rest of Europe
-
3. Asia Pacific
- 3.1. China
- 3.2. Japan
- 3.3. India
- 3.4. Australia
- 3.5. Rest of Asia Pacific
-
4. South America
- 4.1. Brazil
- 4.2. Argentina
- 4.3. Rest of South America
-
5. Middle East and Africa
- 5.1. South Africa
- 5.2. United Arab Emirates
- 5.3. Rest of Middle East and Africa
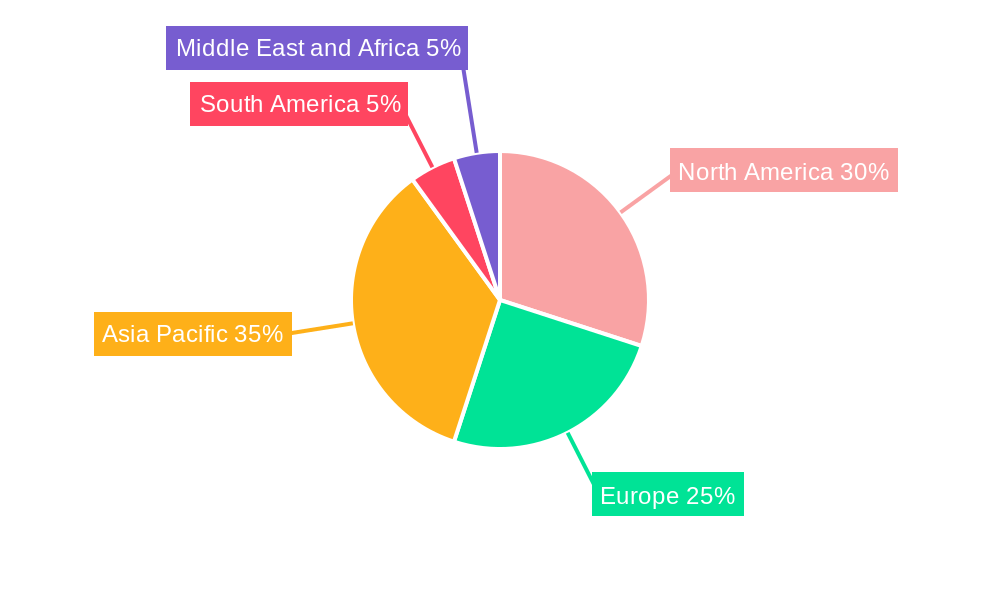
Gems Industry Regional Market Share
Geographic Coverage of Gems Industry
Gems Industry REPORT HIGHLIGHTS
| Aspects | Details |
|---|---|
| Study Period | 2020-2034 |
| Base Year | 2025 |
| Estimated Year | 2026 |
| Forecast Period | 2026-2034 |
| Historical Period | 2020-2025 |
| Growth Rate | CAGR of 6.3% from 2020-2034 |
| Segmentation |
|
Table of Contents
- 1. Introduction
- 1.1. Research Scope
- 1.2. Market Segmentation
- 1.3. Research Objective
- 1.4. Definitions and Assumptions
- 2. Executive Summary
- 2.1. Market Snapshot
- 3. Market Dynamics
- 3.1. Market Drivers
- 3.2. Market Restrains
- 3.3. Market Trends
- 3.4. Market Opportunities
- 4. Market Factor Analysis
- 4.1. Porters Five Forces
- 4.1.1. Bargaining Power of Suppliers
- 4.1.2. Bargaining Power of Buyers
- 4.1.3. Threat of New Entrants
- 4.1.4. Threat of Substitutes
- 4.1.5. Competitive Rivalry
- 4.2. PESTEL analysis
- 4.3. BCG Analysis
- 4.3.1. Stars (High Growth, High Market Share)
- 4.3.2. Cash Cows (Low Growth, High Market Share)
- 4.3.3. Question Mark (High Growth, Low Market Share)
- 4.3.4. Dogs (Low Growth, Low Market Share)
- 4.4. Ansoff Matrix Analysis
- 4.5. Supply Chain Analysis
- 4.6. Regulatory Landscape
- 4.7. Current Market Potential and Opportunity Assessment (TAM–SAM–SOM Framework)
- 4.8. PMV Analyst Note
- 4.1. Porters Five Forces
- 5. Market Analysis, Insights and Forecast 2021-2033
- 5.1. Market Analysis, Insights and Forecast - by Product Type
- 5.1.1. Rings
- 5.1.2. Necklaces
- 5.1.3. Earrings
- 5.1.4. Bracelets
- 5.1.5. Chains and Pendants
- 5.1.6. Other Product Types
- 5.2. Market Analysis, Insights and Forecast - by Distribution Channel
- 5.2.1. Offline Retail Stores
- 5.2.2. Online Retail Stores
- 5.3. Market Analysis, Insights and Forecast - by Region
- 5.3.1. North America
- 5.3.2. Europe
- 5.3.3. Asia Pacific
- 5.3.4. South America
- 5.3.5. Middle East and Africa
- 5.1. Market Analysis, Insights and Forecast - by Product Type
- 6. Global Gems Industry Analysis, Insights and Forecast, 2021-2033
- 6.1. Market Analysis, Insights and Forecast - by Product Type
- 6.1.1. Rings
- 6.1.2. Necklaces
- 6.1.3. Earrings
- 6.1.4. Bracelets
- 6.1.5. Chains and Pendants
- 6.1.6. Other Product Types
- 6.2. Market Analysis, Insights and Forecast - by Distribution Channel
- 6.2.1. Offline Retail Stores
- 6.2.2. Online Retail Stores
- 6.1. Market Analysis, Insights and Forecast - by Product Type
- 7. North America Gems Industry Analysis, Insights and Forecast, 2020-2032
- 7.1. Market Analysis, Insights and Forecast - by Product Type
- 7.1.1. Rings
- 7.1.2. Necklaces
- 7.1.3. Earrings
- 7.1.4. Bracelets
- 7.1.5. Chains and Pendants
- 7.1.6. Other Product Types
- 7.2. Market Analysis, Insights and Forecast - by Distribution Channel
- 7.2.1. Offline Retail Stores
- 7.2.2. Online Retail Stores
- 7.1. Market Analysis, Insights and Forecast - by Product Type
- 8. Europe Gems Industry Analysis, Insights and Forecast, 2020-2032
- 8.1. Market Analysis, Insights and Forecast - by Product Type
- 8.1.1. Rings
- 8.1.2. Necklaces
- 8.1.3. Earrings
- 8.1.4. Bracelets
- 8.1.5. Chains and Pendants
- 8.1.6. Other Product Types
- 8.2. Market Analysis, Insights and Forecast - by Distribution Channel
- 8.2.1. Offline Retail Stores
- 8.2.2. Online Retail Stores
- 8.1. Market Analysis, Insights and Forecast - by Product Type
- 9. Asia Pacific Gems Industry Analysis, Insights and Forecast, 2020-2032
- 9.1. Market Analysis, Insights and Forecast - by Product Type
- 9.1.1. Rings
- 9.1.2. Necklaces
- 9.1.3. Earrings
- 9.1.4. Bracelets
- 9.1.5. Chains and Pendants
- 9.1.6. Other Product Types
- 9.2. Market Analysis, Insights and Forecast - by Distribution Channel
- 9.2.1. Offline Retail Stores
- 9.2.2. Online Retail Stores
- 9.1. Market Analysis, Insights and Forecast - by Product Type
- 10. South America Gems Industry Analysis, Insights and Forecast, 2020-2032
- 10.1. Market Analysis, Insights and Forecast - by Product Type
- 10.1.1. Rings
- 10.1.2. Necklaces
- 10.1.3. Earrings
- 10.1.4. Bracelets
- 10.1.5. Chains and Pendants
- 10.1.6. Other Product Types
- 10.2. Market Analysis, Insights and Forecast - by Distribution Channel
- 10.2.1. Offline Retail Stores
- 10.2.2. Online Retail Stores
- 10.1. Market Analysis, Insights and Forecast - by Product Type
- 11. Middle East and Africa Gems Industry Analysis, Insights and Forecast, 2020-2032
- 11.1. Market Analysis, Insights and Forecast - by Product Type
- 11.1.1. Rings
- 11.1.2. Necklaces
- 11.1.3. Earrings
- 11.1.4. Bracelets
- 11.1.5. Chains and Pendants
- 11.1.6. Other Product Types
- 11.2. Market Analysis, Insights and Forecast - by Distribution Channel
- 11.2.1. Offline Retail Stores
- 11.2.2. Online Retail Stores
- 11.1. Market Analysis, Insights and Forecast - by Product Type
- 12. Competitive Analysis
- 12.1. Company Profiles
- 12.1.1 The Swatch Group AG
- 12.1.1.1. Company Overview
- 12.1.1.2. Products
- 12.1.1.3. Company Financials
- 12.1.1.4. SWOT Analysis
- 12.1.2 PANDORA JEWELRY LLC
- 12.1.2.1. Company Overview
- 12.1.2.2. Products
- 12.1.2.3. Company Financials
- 12.1.2.4. SWOT Analysis
- 12.1.3 De Beers Jewellers US Inc
- 12.1.3.1. Company Overview
- 12.1.3.2. Products
- 12.1.3.3. Company Financials
- 12.1.3.4. SWOT Analysis
- 12.1.4 LVMH Group
- 12.1.4.1. Company Overview
- 12.1.4.2. Products
- 12.1.4.3. Company Financials
- 12.1.4.4. SWOT Analysis
- 12.1.5 Chow Tai Fook Jewellery Company Limited*List Not Exhaustive
- 12.1.5.1. Company Overview
- 12.1.5.2. Products
- 12.1.5.3. Company Financials
- 12.1.5.4. SWOT Analysis
- 12.1.6 Richemont SA
- 12.1.6.1. Company Overview
- 12.1.6.2. Products
- 12.1.6.3. Company Financials
- 12.1.6.4. SWOT Analysis
- 12.1.7 Swarovski Crystal Online AG
- 12.1.7.1. Company Overview
- 12.1.7.2. Products
- 12.1.7.3. Company Financials
- 12.1.7.4. SWOT Analysis
- 12.1.8 Chow Tai Fook Jewelry Company Limited
- 12.1.8.1. Company Overview
- 12.1.8.2. Products
- 12.1.8.3. Company Financials
- 12.1.8.4. SWOT Analysis
- 12.1.9 Tata Sons Private Ltd
- 12.1.9.1. Company Overview
- 12.1.9.2. Products
- 12.1.9.3. Company Financials
- 12.1.9.4. SWOT Analysis
- 12.1.10 Signet Jewelers
- 12.1.10.1. Company Overview
- 12.1.10.2. Products
- 12.1.10.3. Company Financials
- 12.1.10.4. SWOT Analysis
- 12.1.1 The Swatch Group AG
- 12.2. Market Entropy
- 12.2.1 Company's Key Areas Served
- 12.2.2 Recent Developments
- 12.3. Company Market Share Analysis 2025
- 12.3.1 Top 5 Companies Market Share Analysis
- 12.3.2 Top 3 Companies Market Share Analysis
- 12.4. List of Potential Customers
- 13. Research Methodology
List of Figures
- Figure 1: Global Gems Industry Revenue Breakdown (billion, %) by Region 2025 & 2033
- Figure 2: North America Gems Industry Revenue (billion), by Product Type 2025 & 2033
- Figure 3: North America Gems Industry Revenue Share (%), by Product Type 2025 & 2033
- Figure 4: North America Gems Industry Revenue (billion), by Distribution Channel 2025 & 2033
- Figure 5: North America Gems Industry Revenue Share (%), by Distribution Channel 2025 & 2033
- Figure 6: North America Gems Industry Revenue (billion), by Country 2025 & 2033
- Figure 7: North America Gems Industry Revenue Share (%), by Country 2025 & 2033
- Figure 8: Europe Gems Industry Revenue (billion), by Product Type 2025 & 2033
- Figure 9: Europe Gems Industry Revenue Share (%), by Product Type 2025 & 2033
- Figure 10: Europe Gems Industry Revenue (billion), by Distribution Channel 2025 & 2033
- Figure 11: Europe Gems Industry Revenue Share (%), by Distribution Channel 2025 & 2033
- Figure 12: Europe Gems Industry Revenue (billion), by Country 2025 & 2033
- Figure 13: Europe Gems Industry Revenue Share (%), by Country 2025 & 2033
- Figure 14: Asia Pacific Gems Industry Revenue (billion), by Product Type 2025 & 2033
- Figure 15: Asia Pacific Gems Industry Revenue Share (%), by Product Type 2025 & 2033
- Figure 16: Asia Pacific Gems Industry Revenue (billion), by Distribution Channel 2025 & 2033
- Figure 17: Asia Pacific Gems Industry Revenue Share (%), by Distribution Channel 2025 & 2033
- Figure 18: Asia Pacific Gems Industry Revenue (billion), by Country 2025 & 2033
- Figure 19: Asia Pacific Gems Industry Revenue Share (%), by Country 2025 & 2033
- Figure 20: South America Gems Industry Revenue (billion), by Product Type 2025 & 2033
- Figure 21: South America Gems Industry Revenue Share (%), by Product Type 2025 & 2033
- Figure 22: South America Gems Industry Revenue (billion), by Distribution Channel 2025 & 2033
- Figure 23: South America Gems Industry Revenue Share (%), by Distribution Channel 2025 & 2033
- Figure 24: South America Gems Industry Revenue (billion), by Country 2025 & 2033
- Figure 25: South America Gems Industry Revenue Share (%), by Country 2025 & 2033
- Figure 26: Middle East and Africa Gems Industry Revenue (billion), by Product Type 2025 & 2033
- Figure 27: Middle East and Africa Gems Industry Revenue Share (%), by Product Type 2025 & 2033
- Figure 28: Middle East and Africa Gems Industry Revenue (billion), by Distribution Channel 2025 & 2033
- Figure 29: Middle East and Africa Gems Industry Revenue Share (%), by Distribution Channel 2025 & 2033
- Figure 30: Middle East and Africa Gems Industry Revenue (billion), by Country 2025 & 2033
- Figure 31: Middle East and Africa Gems Industry Revenue Share (%), by Country 2025 & 2033
List of Tables
- Table 1: Global Gems Industry Revenue billion Forecast, by Product Type 2020 & 2033
- Table 2: Global Gems Industry Revenue billion Forecast, by Distribution Channel 2020 & 2033
- Table 3: Global Gems Industry Revenue billion Forecast, by Region 2020 & 2033
- Table 4: Global Gems Industry Revenue billion Forecast, by Product Type 2020 & 2033
- Table 5: Global Gems Industry Revenue billion Forecast, by Distribution Channel 2020 & 2033
- Table 6: Global Gems Industry Revenue billion Forecast, by Country 2020 & 2033
- Table 7: United States Gems Industry Revenue (billion) Forecast, by Application 2020 & 2033
- Table 8: Canada Gems Industry Revenue (billion) Forecast, by Application 2020 & 2033
- Table 9: Mexico Gems Industry Revenue (billion) Forecast, by Application 2020 & 2033
- Table 10: Rest of North America Gems Industry Revenue (billion) Forecast, by Application 2020 & 2033
- Table 11: Global Gems Industry Revenue billion Forecast, by Product Type 2020 & 2033
- Table 12: Global Gems Industry Revenue billion Forecast, by Distribution Channel 2020 & 2033
- Table 13: Global Gems Industry Revenue billion Forecast, by Country 2020 & 2033
- Table 14: Spain Gems Industry Revenue (billion) Forecast, by Application 2020 & 2033
- Table 15: United Kingdom Gems Industry Revenue (billion) Forecast, by Application 2020 & 2033
- Table 16: France Gems Industry Revenue (billion) Forecast, by Application 2020 & 2033
- Table 17: Germany Gems Industry Revenue (billion) Forecast, by Application 2020 & 2033
- Table 18: Russia Gems Industry Revenue (billion) Forecast, by Application 2020 & 2033
- Table 19: Italy Gems Industry Revenue (billion) Forecast, by Application 2020 & 2033
- Table 20: Rest of Europe Gems Industry Revenue (billion) Forecast, by Application 2020 & 2033
- Table 21: Global Gems Industry Revenue billion Forecast, by Product Type 2020 & 2033
- Table 22: Global Gems Industry Revenue billion Forecast, by Distribution Channel 2020 & 2033
- Table 23: Global Gems Industry Revenue billion Forecast, by Country 2020 & 2033
- Table 24: China Gems Industry Revenue (billion) Forecast, by Application 2020 & 2033
- Table 25: Japan Gems Industry Revenue (billion) Forecast, by Application 2020 & 2033
- Table 26: India Gems Industry Revenue (billion) Forecast, by Application 2020 & 2033
- Table 27: Australia Gems Industry Revenue (billion) Forecast, by Application 2020 & 2033
- Table 28: Rest of Asia Pacific Gems Industry Revenue (billion) Forecast, by Application 2020 & 2033
- Table 29: Global Gems Industry Revenue billion Forecast, by Product Type 2020 & 2033
- Table 30: Global Gems Industry Revenue billion Forecast, by Distribution Channel 2020 & 2033
- Table 31: Global Gems Industry Revenue billion Forecast, by Country 2020 & 2033
- Table 32: Brazil Gems Industry Revenue (billion) Forecast, by Application 2020 & 2033
- Table 33: Argentina Gems Industry Revenue (billion) Forecast, by Application 2020 & 2033
- Table 34: Rest of South America Gems Industry Revenue (billion) Forecast, by Application 2020 & 2033
- Table 35: Global Gems Industry Revenue billion Forecast, by Product Type 2020 & 2033
- Table 36: Global Gems Industry Revenue billion Forecast, by Distribution Channel 2020 & 2033
- Table 37: Global Gems Industry Revenue billion Forecast, by Country 2020 & 2033
- Table 38: South Africa Gems Industry Revenue (billion) Forecast, by Application 2020 & 2033
- Table 39: United Arab Emirates Gems Industry Revenue (billion) Forecast, by Application 2020 & 2033
- Table 40: Rest of Middle East and Africa Gems Industry Revenue (billion) Forecast, by Application 2020 & 2033
Frequently Asked Questions
1. What is the projected Compound Annual Growth Rate (CAGR) of the Gems Industry?
The projected CAGR is approximately 6.3%.
2. Which companies are prominent players in the Gems Industry?
Key companies in the market include The Swatch Group AG, PANDORA JEWELRY LLC, De Beers Jewellers US Inc, LVMH Group, Chow Tai Fook Jewellery Company Limited*List Not Exhaustive, Richemont SA, Swarovski Crystal Online AG, Chow Tai Fook Jewelry Company Limited, Tata Sons Private Ltd, Signet Jewelers.
3. What are the main segments of the Gems Industry?
The market segments include Product Type, Distribution Channel.
4. Can you provide details about the market size?
The market size is estimated to be USD 12.7 billion as of 2022.
5. What are some drivers contributing to market growth?
Product Innovations to Drive Demand for Watches; Rising Demand for Premium Fashion Items.
6. What are the notable trends driving market growth?
Rising Demand for Gems & Jewellery Owing to the Emerging Middle Class.
7. Are there any restraints impacting market growth?
Presence of Counterfeit Products.
8. Can you provide examples of recent developments in the market?
September 2022: As an ode to the Chola Dynasty, which is considered a golden age of Indian history, Tanishq launched its new exclusive collection The Chola, which is an ode to the dynasty.
9. What pricing options are available for accessing the report?
Pricing options include single-user, multi-user, and enterprise licenses priced at USD 4750, USD 5250, and USD 8750 respectively.
10. Is the market size provided in terms of value or volume?
The market size is provided in terms of value, measured in billion.
11. Are there any specific market keywords associated with the report?
Yes, the market keyword associated with the report is "Gems Industry," which aids in identifying and referencing the specific market segment covered.
12. How do I determine which pricing option suits my needs best?
The pricing options vary based on user requirements and access needs. Individual users may opt for single-user licenses, while businesses requiring broader access may choose multi-user or enterprise licenses for cost-effective access to the report.
13. Are there any additional resources or data provided in the Gems Industry report?
While the report offers comprehensive insights, it's advisable to review the specific contents or supplementary materials provided to ascertain if additional resources or data are available.
14. How can I stay updated on further developments or reports in the Gems Industry?
To stay informed about further developments, trends, and reports in the Gems Industry, consider subscribing to industry newsletters, following relevant companies and organizations, or regularly checking reputable industry news sources and publications.
Methodology
Step 1 - Identification of Relevant Samples Size from Population Database


Step 2 - Approaches for Defining Global Market Size (Value, Volume* & Price*)

Note*: In applicable scenarios
Step 3 - Data Sources
Primary Research
- Web Analytics
- Survey Reports
- Research Institute
- Latest Research Reports
- Opinion Leaders
Secondary Research
- Annual Reports
- White Paper
- Latest Press Release
- Industry Association
- Paid Database
- Investor Presentations

Step 4 - Data Triangulation
Involves using different sources of information in order to increase the validity of a study
These sources are likely to be stakeholders in a program - participants, other researchers, program staff, other community members, and so on.
Then we put all data in single framework & apply various statistical tools to find out the dynamic on the market.
During the analysis stage, feedback from the stakeholder groups would be compared to determine areas of agreement as well as areas of divergence