
Key Insights
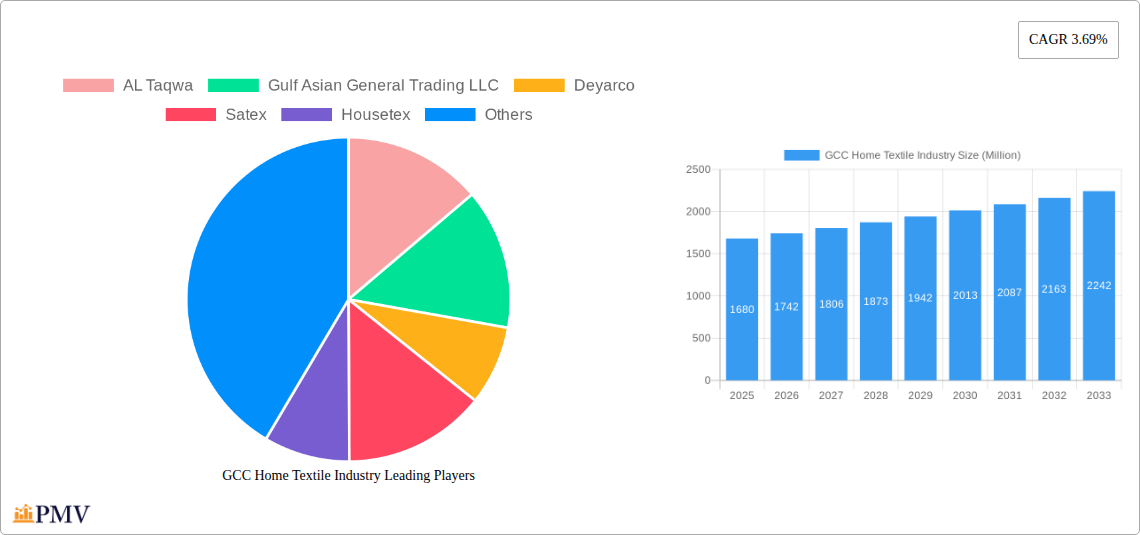
The GCC home textile industry, valued at $1.68 billion in 2025, exhibits a robust growth trajectory, projected to expand at a CAGR of 3.69% from 2025 to 2033. This growth is fueled by several key factors. Rising disposable incomes within the GCC region are driving increased consumer spending on home furnishings, creating a strong demand for high-quality bed linens, bath linens, kitchen textiles, and upholstery fabrics. A burgeoning tourism sector further boosts demand, particularly within the hospitality industry which requires regular replenishment of textiles. The increasing popularity of online retail channels is also contributing to market expansion, offering consumers greater convenience and choice. Furthermore, a growing preference for modern and stylish home décor, coupled with rising awareness of sustainability and eco-friendly textiles, is influencing consumer purchasing decisions. However, the market faces certain challenges. Fluctuations in global cotton prices, a key raw material, can impact production costs and profitability. Competition from international brands, coupled with the increasing availability of affordable alternatives, presents a challenge for local manufacturers. The market also faces the potential impact of changing consumer preferences and shifting fashion trends.
Despite these challenges, the GCC home textile industry presents significant opportunities for growth. Companies are focusing on innovation and product differentiation to maintain a competitive edge. This includes the development of new and improved fabrics with enhanced features such as stain resistance, wrinkle resistance, and hypoallergenic properties. Companies are also investing in sustainable production methods to cater to the growing demand for eco-conscious products. Furthermore, strategic partnerships and collaborations with international brands can provide access to new technologies and wider consumer markets. Expansion into e-commerce channels will be crucial for capturing a larger share of the growing online market. Successful players will need to focus on consumer engagement, offering a superior customer experience and personalized service. The diversification of product offerings to meet specific regional needs and cultural preferences will also be a crucial factor in long-term success.
GCC Home Textile Industry: Market Analysis and Forecast 2019-2033
This comprehensive report provides a detailed analysis of the GCC home textile industry, covering market size, segmentation, competitive landscape, key trends, and future growth prospects. The study period spans 2019-2033, with 2025 as the base and estimated year. The report offers actionable insights for businesses operating in or seeking to enter this dynamic market, providing valuable data for strategic decision-making. The market is valued at xx Million in 2025 and is projected to reach xx Million by 2033.
GCC Home Textile Industry Market Structure & Competitive Dynamics
The GCC home textile market exhibits a moderately concentrated structure, with several large players like Al Sorayai Group and smaller, specialized firms like CLF Como Luxury Fabrics LLC coexisting. Market share is largely determined by brand recognition, product quality, distribution network strength, and pricing strategies. Innovation ecosystems are nascent, with limited collaborative R&D activities, but the industry is steadily embracing digitalization and sustainable manufacturing practices. Regulatory frameworks vary across GCC countries, but generally favor regional manufacturers through supportive policies, including import tariffs. Product substitutes include imported home textiles and other interior design elements, posing a competitive threat. End-user trends increasingly favor eco-friendly, high-quality products with superior comfort and design. M&A activity remains moderate; however, the predicted value of the largest deal in the historical period (2019-2024) was xx Million.
- Market Concentration: Moderately Concentrated
- Major Players' Market Share: Al Sorayai Group (xx%), Deyarco (xx%), Satex (xx%), Others (xx%)
- M&A Deal Value (2019-2024): xx Million (largest deal)
- Key Regulatory Frameworks: Vary across GCC countries, generally supportive of regional manufacturers
GCC Home Textile Industry Industry Trends & Insights
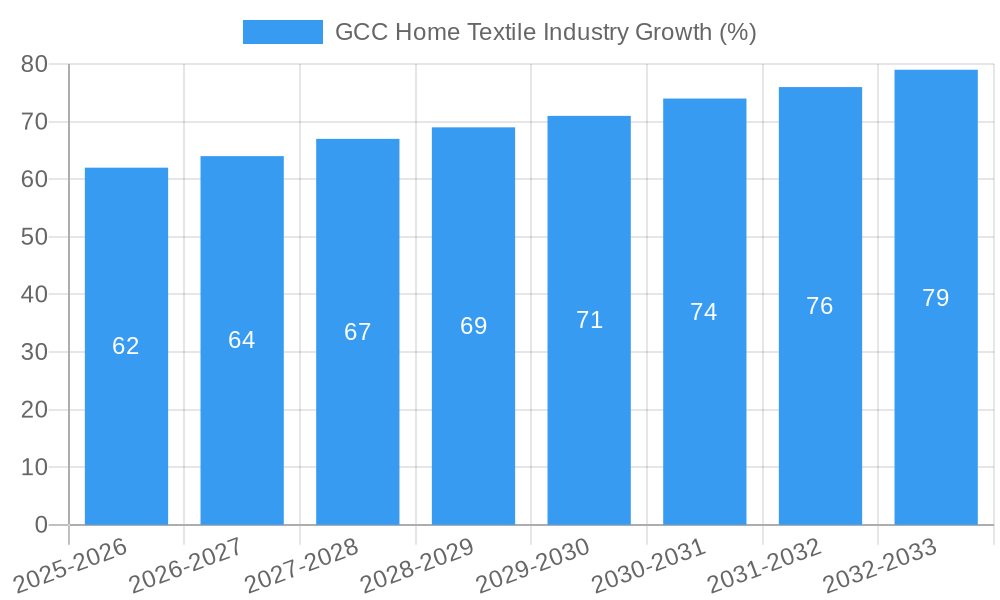
The GCC home textile market exhibits strong growth potential, driven by rising disposable incomes, urbanization, and a growing preference for enhanced home aesthetics. The market's Compound Annual Growth Rate (CAGR) during the historical period (2019-2024) was xx%, and a similar CAGR is projected for the forecast period (2025-2033). Technological disruptions are evident in the adoption of advanced manufacturing techniques, e-commerce platforms, and data-driven marketing strategies. Consumer preferences are shifting towards sustainable, ethically sourced materials and personalized products. Competitive dynamics are intensifying with the entry of new players and the expansion of existing ones, forcing companies to innovate and differentiate their offerings. Market penetration of online sales channels is steadily growing, expected to reach xx% by 2033.
Dominant Markets & Segments in GCC Home Textile Industry
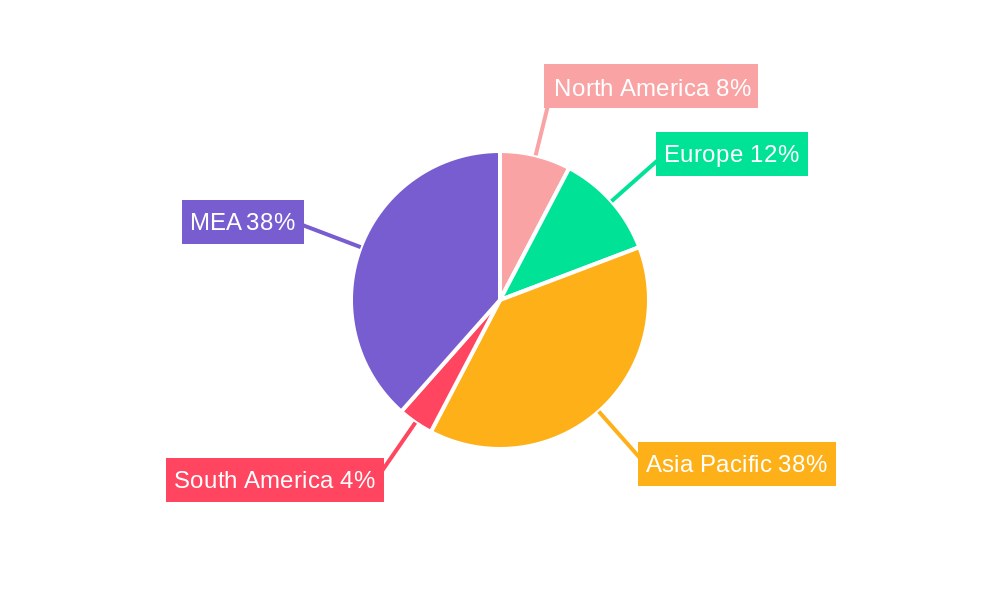
The UAE and Saudi Arabia represent the dominant markets within the GCC region for home textiles, driven by larger populations, higher purchasing power, and robust retail infrastructure. Within product types, bed linen maintains the largest market share, followed by bath linen and upholstery. The growth of online distribution channels has accelerated significantly in recent years, contributing substantially to the market's overall expansion.
- Leading Regions: UAE and Saudi Arabia
- Key Drivers for UAE and Saudi Arabia: Higher disposable incomes, strong retail infrastructure, government initiatives promoting domestic manufacturing
- Dominant Product Type: Bed linen (xx% market share)
- Fastest-Growing Distribution Channel: Online (xx% CAGR)
GCC Home Textile Industry Product Innovations
Recent product innovations focus on incorporating sustainable materials (organic cotton, recycled fibers), smart technologies (temperature-regulating fabrics), and personalized designs. These innovations cater to the growing consumer demand for environmentally friendly, high-tech, and aesthetically pleasing home textiles. Companies are leveraging technology to enhance product quality, reduce manufacturing costs, and improve supply chain efficiency.
Report Segmentation & Scope
This report segments the GCC home textile market by product type (bed linen, bath linen, kitchen linen, upholstery, floor covering) and distribution channel (supermarkets & hypermarkets, specialty stores, online, other). Each segment's market size, growth projections, and competitive dynamics are analyzed in detail. Specific growth rates and market sizes for each segment are provided within the full report.
Key Drivers of GCC Home Textile Industry Growth
Key growth drivers include rising disposable incomes, increased urbanization leading to higher demand for home improvement products, expanding e-commerce infrastructure, and government initiatives promoting local manufacturing. The growing popularity of modern interior design styles and the increasing preference for comfort and luxury in home furnishings also contribute significantly to market expansion.
Challenges in the GCC Home Textile Industry Sector
Challenges include fluctuating raw material prices, intense competition from international brands, supply chain disruptions, and the need to balance cost efficiency with environmental sustainability. Stricter regulations regarding product safety and environmental impact also present significant challenges for companies. These factors impact profitability and overall market expansion.
Leading Players in the GCC Home Textile Industry Market
- AL Taqwa
- Gulf Asian General Trading LLC
- Deyarco
- Satex
- Housetex
- Al Sorayai Group
- Dicitex
- Orient Textiles International LLC
- CLF Como Luxury Fabrics LLC
- B Tex International L L C
Key Developments in GCC Home Textile Industry Sector
- February 2023: Launch of Frugado.com, an online platform offering a wide range of curated home textiles and fashion items, enhancing consumer choice and market competition.
- October 2023: Partnership between LETSDRY (bath linen brand) and LuLu Hypermarket, significantly expanding distribution reach and market visibility for LETSDRY.
Strategic GCC Home Textile Industry Market Outlook
The GCC home textile industry holds considerable growth potential, driven by continued economic expansion, rising urbanization, and shifting consumer preferences. Strategic opportunities lie in focusing on sustainable and innovative product development, leveraging e-commerce platforms effectively, and strengthening supply chain resilience. Companies that effectively adapt to changing consumer trends and embrace technological advancements will gain a competitive edge in this expanding market.
GCC Home Textile Industry Segmentation
-
1. Product Type
- 1.1. Bed linen
- 1.2. Bath Linen
- 1.3. Kitchen Linen
- 1.4. Upholstery
- 1.5. Floor Covering
-
2. Distribution Channel
- 2.1. Supermarkets & Hypermarkets
- 2.2. Specialty Stores
- 2.3. Online
- 2.4. Other Distribution Channels
-
3. Geography
- 3.1. Saudi Arabia
- 3.2. United Arab Emirates
- 3.3. Oman
- 3.4. Kuwait
- 3.5. Qatar
- 3.6. Bahrain
GCC Home Textile Industry Segmentation By Geography
- 1. Saudi Arabia
- 2. United Arab Emirates
- 3. Oman
- 4. Kuwait
- 5. Qatar
- 6. Bahrain
GCC Home Textile Industry REPORT HIGHLIGHTS
| Aspects | Details |
|---|---|
| Study Period | 2019-2033 |
| Base Year | 2024 |
| Estimated Year | 2025 |
| Forecast Period | 2025-2033 |
| Historical Period | 2019-2024 |
| Growth Rate | CAGR of 3.69% from 2019-2033 |
| Segmentation |
|
Table of Contents
- 1. Introduction
- 1.1. Research Scope
- 1.2. Market Segmentation
- 1.3. Research Methodology
- 1.4. Definitions and Assumptions
- 2. Executive Summary
- 2.1. Introduction
- 3. Market Dynamics
- 3.1. Introduction
- 3.2. Market Drivers
- 3.2.1. Rise of Smart Kitchen is Driving the Market; Growing Urbanisation is Driving Need for Quick Meal Preparation
- 3.3. Market Restrains
- 3.3.1. Changing Needs and Taste of Customers; Limited Usage of the Product
- 3.4. Market Trends
- 3.4.1. Saudi Arabia is driving the growth of the market
- 4. Market Factor Analysis
- 4.1. Porters Five Forces
- 4.2. Supply/Value Chain
- 4.3. PESTEL analysis
- 4.4. Market Entropy
- 4.5. Patent/Trademark Analysis
- 5. Global GCC Home Textile Industry Analysis, Insights and Forecast, 2019-2031
- 5.1. Market Analysis, Insights and Forecast - by Product Type
- 5.1.1. Bed linen
- 5.1.2. Bath Linen
- 5.1.3. Kitchen Linen
- 5.1.4. Upholstery
- 5.1.5. Floor Covering
- 5.2. Market Analysis, Insights and Forecast - by Distribution Channel
- 5.2.1. Supermarkets & Hypermarkets
- 5.2.2. Specialty Stores
- 5.2.3. Online
- 5.2.4. Other Distribution Channels
- 5.3. Market Analysis, Insights and Forecast - by Geography
- 5.3.1. Saudi Arabia
- 5.3.2. United Arab Emirates
- 5.3.3. Oman
- 5.3.4. Kuwait
- 5.3.5. Qatar
- 5.3.6. Bahrain
- 5.4. Market Analysis, Insights and Forecast - by Region
- 5.4.1. Saudi Arabia
- 5.4.2. United Arab Emirates
- 5.4.3. Oman
- 5.4.4. Kuwait
- 5.4.5. Qatar
- 5.4.6. Bahrain
- 5.1. Market Analysis, Insights and Forecast - by Product Type
- 6. Saudi Arabia GCC Home Textile Industry Analysis, Insights and Forecast, 2019-2031
- 6.1. Market Analysis, Insights and Forecast - by Product Type
- 6.1.1. Bed linen
- 6.1.2. Bath Linen
- 6.1.3. Kitchen Linen
- 6.1.4. Upholstery
- 6.1.5. Floor Covering
- 6.2. Market Analysis, Insights and Forecast - by Distribution Channel
- 6.2.1. Supermarkets & Hypermarkets
- 6.2.2. Specialty Stores
- 6.2.3. Online
- 6.2.4. Other Distribution Channels
- 6.3. Market Analysis, Insights and Forecast - by Geography
- 6.3.1. Saudi Arabia
- 6.3.2. United Arab Emirates
- 6.3.3. Oman
- 6.3.4. Kuwait
- 6.3.5. Qatar
- 6.3.6. Bahrain
- 6.1. Market Analysis, Insights and Forecast - by Product Type
- 7. United Arab Emirates GCC Home Textile Industry Analysis, Insights and Forecast, 2019-2031
- 7.1. Market Analysis, Insights and Forecast - by Product Type
- 7.1.1. Bed linen
- 7.1.2. Bath Linen
- 7.1.3. Kitchen Linen
- 7.1.4. Upholstery
- 7.1.5. Floor Covering
- 7.2. Market Analysis, Insights and Forecast - by Distribution Channel
- 7.2.1. Supermarkets & Hypermarkets
- 7.2.2. Specialty Stores
- 7.2.3. Online
- 7.2.4. Other Distribution Channels
- 7.3. Market Analysis, Insights and Forecast - by Geography
- 7.3.1. Saudi Arabia
- 7.3.2. United Arab Emirates
- 7.3.3. Oman
- 7.3.4. Kuwait
- 7.3.5. Qatar
- 7.3.6. Bahrain
- 7.1. Market Analysis, Insights and Forecast - by Product Type
- 8. Oman GCC Home Textile Industry Analysis, Insights and Forecast, 2019-2031
- 8.1. Market Analysis, Insights and Forecast - by Product Type
- 8.1.1. Bed linen
- 8.1.2. Bath Linen
- 8.1.3. Kitchen Linen
- 8.1.4. Upholstery
- 8.1.5. Floor Covering
- 8.2. Market Analysis, Insights and Forecast - by Distribution Channel
- 8.2.1. Supermarkets & Hypermarkets
- 8.2.2. Specialty Stores
- 8.2.3. Online
- 8.2.4. Other Distribution Channels
- 8.3. Market Analysis, Insights and Forecast - by Geography
- 8.3.1. Saudi Arabia
- 8.3.2. United Arab Emirates
- 8.3.3. Oman
- 8.3.4. Kuwait
- 8.3.5. Qatar
- 8.3.6. Bahrain
- 8.1. Market Analysis, Insights and Forecast - by Product Type
- 9. Kuwait GCC Home Textile Industry Analysis, Insights and Forecast, 2019-2031
- 9.1. Market Analysis, Insights and Forecast - by Product Type
- 9.1.1. Bed linen
- 9.1.2. Bath Linen
- 9.1.3. Kitchen Linen
- 9.1.4. Upholstery
- 9.1.5. Floor Covering
- 9.2. Market Analysis, Insights and Forecast - by Distribution Channel
- 9.2.1. Supermarkets & Hypermarkets
- 9.2.2. Specialty Stores
- 9.2.3. Online
- 9.2.4. Other Distribution Channels
- 9.3. Market Analysis, Insights and Forecast - by Geography
- 9.3.1. Saudi Arabia
- 9.3.2. United Arab Emirates
- 9.3.3. Oman
- 9.3.4. Kuwait
- 9.3.5. Qatar
- 9.3.6. Bahrain
- 9.1. Market Analysis, Insights and Forecast - by Product Type
- 10. Qatar GCC Home Textile Industry Analysis, Insights and Forecast, 2019-2031
- 10.1. Market Analysis, Insights and Forecast - by Product Type
- 10.1.1. Bed linen
- 10.1.2. Bath Linen
- 10.1.3. Kitchen Linen
- 10.1.4. Upholstery
- 10.1.5. Floor Covering
- 10.2. Market Analysis, Insights and Forecast - by Distribution Channel
- 10.2.1. Supermarkets & Hypermarkets
- 10.2.2. Specialty Stores
- 10.2.3. Online
- 10.2.4. Other Distribution Channels
- 10.3. Market Analysis, Insights and Forecast - by Geography
- 10.3.1. Saudi Arabia
- 10.3.2. United Arab Emirates
- 10.3.3. Oman
- 10.3.4. Kuwait
- 10.3.5. Qatar
- 10.3.6. Bahrain
- 10.1. Market Analysis, Insights and Forecast - by Product Type
- 11. Bahrain GCC Home Textile Industry Analysis, Insights and Forecast, 2019-2031
- 11.1. Market Analysis, Insights and Forecast - by Product Type
- 11.1.1. Bed linen
- 11.1.2. Bath Linen
- 11.1.3. Kitchen Linen
- 11.1.4. Upholstery
- 11.1.5. Floor Covering
- 11.2. Market Analysis, Insights and Forecast - by Distribution Channel
- 11.2.1. Supermarkets & Hypermarkets
- 11.2.2. Specialty Stores
- 11.2.3. Online
- 11.2.4. Other Distribution Channels
- 11.3. Market Analysis, Insights and Forecast - by Geography
- 11.3.1. Saudi Arabia
- 11.3.2. United Arab Emirates
- 11.3.3. Oman
- 11.3.4. Kuwait
- 11.3.5. Qatar
- 11.3.6. Bahrain
- 11.1. Market Analysis, Insights and Forecast - by Product Type
- 12. North America GCC Home Textile Industry Analysis, Insights and Forecast, 2019-2031
- 12.1. Market Analysis, Insights and Forecast - By Country/Sub-region
- 12.1.1 United States
- 12.1.2 Canada
- 12.1.3 Mexico
- 13. Europe GCC Home Textile Industry Analysis, Insights and Forecast, 2019-2031
- 13.1. Market Analysis, Insights and Forecast - By Country/Sub-region
- 13.1.1 Germany
- 13.1.2 United Kingdom
- 13.1.3 France
- 13.1.4 Spain
- 13.1.5 Italy
- 13.1.6 Spain
- 13.1.7 Belgium
- 13.1.8 Netherland
- 13.1.9 Nordics
- 13.1.10 Rest of Europe
- 14. Asia Pacific GCC Home Textile Industry Analysis, Insights and Forecast, 2019-2031
- 14.1. Market Analysis, Insights and Forecast - By Country/Sub-region
- 14.1.1 China
- 14.1.2 Japan
- 14.1.3 India
- 14.1.4 South Korea
- 14.1.5 Southeast Asia
- 14.1.6 Australia
- 14.1.7 Indonesia
- 14.1.8 Phillipes
- 14.1.9 Singapore
- 14.1.10 Thailandc
- 14.1.11 Rest of Asia Pacific
- 15. South America GCC Home Textile Industry Analysis, Insights and Forecast, 2019-2031
- 15.1. Market Analysis, Insights and Forecast - By Country/Sub-region
- 15.1.1 Brazil
- 15.1.2 Argentina
- 15.1.3 Peru
- 15.1.4 Chile
- 15.1.5 Colombia
- 15.1.6 Ecuador
- 15.1.7 Venezuela
- 15.1.8 Rest of South America
- 16. North America GCC Home Textile Industry Analysis, Insights and Forecast, 2019-2031
- 16.1. Market Analysis, Insights and Forecast - By Country/Sub-region
- 16.1.1 United States
- 16.1.2 Canada
- 16.1.3 Mexico
- 17. MEA GCC Home Textile Industry Analysis, Insights and Forecast, 2019-2031
- 17.1. Market Analysis, Insights and Forecast - By Country/Sub-region
- 17.1.1 United Arab Emirates
- 17.1.2 Saudi Arabia
- 17.1.3 South Africa
- 17.1.4 Rest of Middle East and Africa
- 18. Competitive Analysis
- 18.1. Global Market Share Analysis 2024
- 18.2. Company Profiles
- 18.2.1 AL Taqwa
- 18.2.1.1. Overview
- 18.2.1.2. Products
- 18.2.1.3. SWOT Analysis
- 18.2.1.4. Recent Developments
- 18.2.1.5. Financials (Based on Availability)
- 18.2.2 Gulf Asian General Trading LLC
- 18.2.2.1. Overview
- 18.2.2.2. Products
- 18.2.2.3. SWOT Analysis
- 18.2.2.4. Recent Developments
- 18.2.2.5. Financials (Based on Availability)
- 18.2.3 Deyarco
- 18.2.3.1. Overview
- 18.2.3.2. Products
- 18.2.3.3. SWOT Analysis
- 18.2.3.4. Recent Developments
- 18.2.3.5. Financials (Based on Availability)
- 18.2.4 Satex
- 18.2.4.1. Overview
- 18.2.4.2. Products
- 18.2.4.3. SWOT Analysis
- 18.2.4.4. Recent Developments
- 18.2.4.5. Financials (Based on Availability)
- 18.2.5 Housetex
- 18.2.5.1. Overview
- 18.2.5.2. Products
- 18.2.5.3. SWOT Analysis
- 18.2.5.4. Recent Developments
- 18.2.5.5. Financials (Based on Availability)
- 18.2.6 Al Sorayai Group
- 18.2.6.1. Overview
- 18.2.6.2. Products
- 18.2.6.3. SWOT Analysis
- 18.2.6.4. Recent Developments
- 18.2.6.5. Financials (Based on Availability)
- 18.2.7 Dicitex
- 18.2.7.1. Overview
- 18.2.7.2. Products
- 18.2.7.3. SWOT Analysis
- 18.2.7.4. Recent Developments
- 18.2.7.5. Financials (Based on Availability)
- 18.2.8 Orient Textiles International LLC
- 18.2.8.1. Overview
- 18.2.8.2. Products
- 18.2.8.3. SWOT Analysis
- 18.2.8.4. Recent Developments
- 18.2.8.5. Financials (Based on Availability)
- 18.2.9 CLF Como Luxury Fabrics LLC
- 18.2.9.1. Overview
- 18.2.9.2. Products
- 18.2.9.3. SWOT Analysis
- 18.2.9.4. Recent Developments
- 18.2.9.5. Financials (Based on Availability)
- 18.2.10 B Tex International L L C
- 18.2.10.1. Overview
- 18.2.10.2. Products
- 18.2.10.3. SWOT Analysis
- 18.2.10.4. Recent Developments
- 18.2.10.5. Financials (Based on Availability)
- 18.2.1 AL Taqwa
List of Figures
- Figure 1: Global GCC Home Textile Industry Revenue Breakdown (Million, %) by Region 2024 & 2032
- Figure 2: Global GCC Home Textile Industry Volume Breakdown (K Unit, %) by Region 2024 & 2032
- Figure 3: North America GCC Home Textile Industry Revenue (Million), by Country 2024 & 2032
- Figure 4: North America GCC Home Textile Industry Volume (K Unit), by Country 2024 & 2032
- Figure 5: North America GCC Home Textile Industry Revenue Share (%), by Country 2024 & 2032
- Figure 6: North America GCC Home Textile Industry Volume Share (%), by Country 2024 & 2032
- Figure 7: Europe GCC Home Textile Industry Revenue (Million), by Country 2024 & 2032
- Figure 8: Europe GCC Home Textile Industry Volume (K Unit), by Country 2024 & 2032
- Figure 9: Europe GCC Home Textile Industry Revenue Share (%), by Country 2024 & 2032
- Figure 10: Europe GCC Home Textile Industry Volume Share (%), by Country 2024 & 2032
- Figure 11: Asia Pacific GCC Home Textile Industry Revenue (Million), by Country 2024 & 2032
- Figure 12: Asia Pacific GCC Home Textile Industry Volume (K Unit), by Country 2024 & 2032
- Figure 13: Asia Pacific GCC Home Textile Industry Revenue Share (%), by Country 2024 & 2032
- Figure 14: Asia Pacific GCC Home Textile Industry Volume Share (%), by Country 2024 & 2032
- Figure 15: South America GCC Home Textile Industry Revenue (Million), by Country 2024 & 2032
- Figure 16: South America GCC Home Textile Industry Volume (K Unit), by Country 2024 & 2032
- Figure 17: South America GCC Home Textile Industry Revenue Share (%), by Country 2024 & 2032
- Figure 18: South America GCC Home Textile Industry Volume Share (%), by Country 2024 & 2032
- Figure 19: North America GCC Home Textile Industry Revenue (Million), by Country 2024 & 2032
- Figure 20: North America GCC Home Textile Industry Volume (K Unit), by Country 2024 & 2032
- Figure 21: North America GCC Home Textile Industry Revenue Share (%), by Country 2024 & 2032
- Figure 22: North America GCC Home Textile Industry Volume Share (%), by Country 2024 & 2032
- Figure 23: MEA GCC Home Textile Industry Revenue (Million), by Country 2024 & 2032
- Figure 24: MEA GCC Home Textile Industry Volume (K Unit), by Country 2024 & 2032
- Figure 25: MEA GCC Home Textile Industry Revenue Share (%), by Country 2024 & 2032
- Figure 26: MEA GCC Home Textile Industry Volume Share (%), by Country 2024 & 2032
- Figure 27: Saudi Arabia GCC Home Textile Industry Revenue (Million), by Product Type 2024 & 2032
- Figure 28: Saudi Arabia GCC Home Textile Industry Volume (K Unit), by Product Type 2024 & 2032
- Figure 29: Saudi Arabia GCC Home Textile Industry Revenue Share (%), by Product Type 2024 & 2032
- Figure 30: Saudi Arabia GCC Home Textile Industry Volume Share (%), by Product Type 2024 & 2032
- Figure 31: Saudi Arabia GCC Home Textile Industry Revenue (Million), by Distribution Channel 2024 & 2032
- Figure 32: Saudi Arabia GCC Home Textile Industry Volume (K Unit), by Distribution Channel 2024 & 2032
- Figure 33: Saudi Arabia GCC Home Textile Industry Revenue Share (%), by Distribution Channel 2024 & 2032
- Figure 34: Saudi Arabia GCC Home Textile Industry Volume Share (%), by Distribution Channel 2024 & 2032
- Figure 35: Saudi Arabia GCC Home Textile Industry Revenue (Million), by Geography 2024 & 2032
- Figure 36: Saudi Arabia GCC Home Textile Industry Volume (K Unit), by Geography 2024 & 2032
- Figure 37: Saudi Arabia GCC Home Textile Industry Revenue Share (%), by Geography 2024 & 2032
- Figure 38: Saudi Arabia GCC Home Textile Industry Volume Share (%), by Geography 2024 & 2032
- Figure 39: Saudi Arabia GCC Home Textile Industry Revenue (Million), by Country 2024 & 2032
- Figure 40: Saudi Arabia GCC Home Textile Industry Volume (K Unit), by Country 2024 & 2032
- Figure 41: Saudi Arabia GCC Home Textile Industry Revenue Share (%), by Country 2024 & 2032
- Figure 42: Saudi Arabia GCC Home Textile Industry Volume Share (%), by Country 2024 & 2032
- Figure 43: United Arab Emirates GCC Home Textile Industry Revenue (Million), by Product Type 2024 & 2032
- Figure 44: United Arab Emirates GCC Home Textile Industry Volume (K Unit), by Product Type 2024 & 2032
- Figure 45: United Arab Emirates GCC Home Textile Industry Revenue Share (%), by Product Type 2024 & 2032
- Figure 46: United Arab Emirates GCC Home Textile Industry Volume Share (%), by Product Type 2024 & 2032
- Figure 47: United Arab Emirates GCC Home Textile Industry Revenue (Million), by Distribution Channel 2024 & 2032
- Figure 48: United Arab Emirates GCC Home Textile Industry Volume (K Unit), by Distribution Channel 2024 & 2032
- Figure 49: United Arab Emirates GCC Home Textile Industry Revenue Share (%), by Distribution Channel 2024 & 2032
- Figure 50: United Arab Emirates GCC Home Textile Industry Volume Share (%), by Distribution Channel 2024 & 2032
- Figure 51: United Arab Emirates GCC Home Textile Industry Revenue (Million), by Geography 2024 & 2032
- Figure 52: United Arab Emirates GCC Home Textile Industry Volume (K Unit), by Geography 2024 & 2032
- Figure 53: United Arab Emirates GCC Home Textile Industry Revenue Share (%), by Geography 2024 & 2032
- Figure 54: United Arab Emirates GCC Home Textile Industry Volume Share (%), by Geography 2024 & 2032
- Figure 55: United Arab Emirates GCC Home Textile Industry Revenue (Million), by Country 2024 & 2032
- Figure 56: United Arab Emirates GCC Home Textile Industry Volume (K Unit), by Country 2024 & 2032
- Figure 57: United Arab Emirates GCC Home Textile Industry Revenue Share (%), by Country 2024 & 2032
- Figure 58: United Arab Emirates GCC Home Textile Industry Volume Share (%), by Country 2024 & 2032
- Figure 59: Oman GCC Home Textile Industry Revenue (Million), by Product Type 2024 & 2032
- Figure 60: Oman GCC Home Textile Industry Volume (K Unit), by Product Type 2024 & 2032
- Figure 61: Oman GCC Home Textile Industry Revenue Share (%), by Product Type 2024 & 2032
- Figure 62: Oman GCC Home Textile Industry Volume Share (%), by Product Type 2024 & 2032
- Figure 63: Oman GCC Home Textile Industry Revenue (Million), by Distribution Channel 2024 & 2032
- Figure 64: Oman GCC Home Textile Industry Volume (K Unit), by Distribution Channel 2024 & 2032
- Figure 65: Oman GCC Home Textile Industry Revenue Share (%), by Distribution Channel 2024 & 2032
- Figure 66: Oman GCC Home Textile Industry Volume Share (%), by Distribution Channel 2024 & 2032
- Figure 67: Oman GCC Home Textile Industry Revenue (Million), by Geography 2024 & 2032
- Figure 68: Oman GCC Home Textile Industry Volume (K Unit), by Geography 2024 & 2032
- Figure 69: Oman GCC Home Textile Industry Revenue Share (%), by Geography 2024 & 2032
- Figure 70: Oman GCC Home Textile Industry Volume Share (%), by Geography 2024 & 2032
- Figure 71: Oman GCC Home Textile Industry Revenue (Million), by Country 2024 & 2032
- Figure 72: Oman GCC Home Textile Industry Volume (K Unit), by Country 2024 & 2032
- Figure 73: Oman GCC Home Textile Industry Revenue Share (%), by Country 2024 & 2032
- Figure 74: Oman GCC Home Textile Industry Volume Share (%), by Country 2024 & 2032
- Figure 75: Kuwait GCC Home Textile Industry Revenue (Million), by Product Type 2024 & 2032
- Figure 76: Kuwait GCC Home Textile Industry Volume (K Unit), by Product Type 2024 & 2032
- Figure 77: Kuwait GCC Home Textile Industry Revenue Share (%), by Product Type 2024 & 2032
- Figure 78: Kuwait GCC Home Textile Industry Volume Share (%), by Product Type 2024 & 2032
- Figure 79: Kuwait GCC Home Textile Industry Revenue (Million), by Distribution Channel 2024 & 2032
- Figure 80: Kuwait GCC Home Textile Industry Volume (K Unit), by Distribution Channel 2024 & 2032
- Figure 81: Kuwait GCC Home Textile Industry Revenue Share (%), by Distribution Channel 2024 & 2032
- Figure 82: Kuwait GCC Home Textile Industry Volume Share (%), by Distribution Channel 2024 & 2032
- Figure 83: Kuwait GCC Home Textile Industry Revenue (Million), by Geography 2024 & 2032
- Figure 84: Kuwait GCC Home Textile Industry Volume (K Unit), by Geography 2024 & 2032
- Figure 85: Kuwait GCC Home Textile Industry Revenue Share (%), by Geography 2024 & 2032
- Figure 86: Kuwait GCC Home Textile Industry Volume Share (%), by Geography 2024 & 2032
- Figure 87: Kuwait GCC Home Textile Industry Revenue (Million), by Country 2024 & 2032
- Figure 88: Kuwait GCC Home Textile Industry Volume (K Unit), by Country 2024 & 2032
- Figure 89: Kuwait GCC Home Textile Industry Revenue Share (%), by Country 2024 & 2032
- Figure 90: Kuwait GCC Home Textile Industry Volume Share (%), by Country 2024 & 2032
- Figure 91: Qatar GCC Home Textile Industry Revenue (Million), by Product Type 2024 & 2032
- Figure 92: Qatar GCC Home Textile Industry Volume (K Unit), by Product Type 2024 & 2032
- Figure 93: Qatar GCC Home Textile Industry Revenue Share (%), by Product Type 2024 & 2032
- Figure 94: Qatar GCC Home Textile Industry Volume Share (%), by Product Type 2024 & 2032
- Figure 95: Qatar GCC Home Textile Industry Revenue (Million), by Distribution Channel 2024 & 2032
- Figure 96: Qatar GCC Home Textile Industry Volume (K Unit), by Distribution Channel 2024 & 2032
- Figure 97: Qatar GCC Home Textile Industry Revenue Share (%), by Distribution Channel 2024 & 2032
- Figure 98: Qatar GCC Home Textile Industry Volume Share (%), by Distribution Channel 2024 & 2032
- Figure 99: Qatar GCC Home Textile Industry Revenue (Million), by Geography 2024 & 2032
- Figure 100: Qatar GCC Home Textile Industry Volume (K Unit), by Geography 2024 & 2032
- Figure 101: Qatar GCC Home Textile Industry Revenue Share (%), by Geography 2024 & 2032
- Figure 102: Qatar GCC Home Textile Industry Volume Share (%), by Geography 2024 & 2032
- Figure 103: Qatar GCC Home Textile Industry Revenue (Million), by Country 2024 & 2032
- Figure 104: Qatar GCC Home Textile Industry Volume (K Unit), by Country 2024 & 2032
- Figure 105: Qatar GCC Home Textile Industry Revenue Share (%), by Country 2024 & 2032
- Figure 106: Qatar GCC Home Textile Industry Volume Share (%), by Country 2024 & 2032
- Figure 107: Bahrain GCC Home Textile Industry Revenue (Million), by Product Type 2024 & 2032
- Figure 108: Bahrain GCC Home Textile Industry Volume (K Unit), by Product Type 2024 & 2032
- Figure 109: Bahrain GCC Home Textile Industry Revenue Share (%), by Product Type 2024 & 2032
- Figure 110: Bahrain GCC Home Textile Industry Volume Share (%), by Product Type 2024 & 2032
- Figure 111: Bahrain GCC Home Textile Industry Revenue (Million), by Distribution Channel 2024 & 2032
- Figure 112: Bahrain GCC Home Textile Industry Volume (K Unit), by Distribution Channel 2024 & 2032
- Figure 113: Bahrain GCC Home Textile Industry Revenue Share (%), by Distribution Channel 2024 & 2032
- Figure 114: Bahrain GCC Home Textile Industry Volume Share (%), by Distribution Channel 2024 & 2032
- Figure 115: Bahrain GCC Home Textile Industry Revenue (Million), by Geography 2024 & 2032
- Figure 116: Bahrain GCC Home Textile Industry Volume (K Unit), by Geography 2024 & 2032
- Figure 117: Bahrain GCC Home Textile Industry Revenue Share (%), by Geography 2024 & 2032
- Figure 118: Bahrain GCC Home Textile Industry Volume Share (%), by Geography 2024 & 2032
- Figure 119: Bahrain GCC Home Textile Industry Revenue (Million), by Country 2024 & 2032
- Figure 120: Bahrain GCC Home Textile Industry Volume (K Unit), by Country 2024 & 2032
- Figure 121: Bahrain GCC Home Textile Industry Revenue Share (%), by Country 2024 & 2032
- Figure 122: Bahrain GCC Home Textile Industry Volume Share (%), by Country 2024 & 2032
List of Tables
- Table 1: Global GCC Home Textile Industry Revenue Million Forecast, by Region 2019 & 2032
- Table 2: Global GCC Home Textile Industry Volume K Unit Forecast, by Region 2019 & 2032
- Table 3: Global GCC Home Textile Industry Revenue Million Forecast, by Product Type 2019 & 2032
- Table 4: Global GCC Home Textile Industry Volume K Unit Forecast, by Product Type 2019 & 2032
- Table 5: Global GCC Home Textile Industry Revenue Million Forecast, by Distribution Channel 2019 & 2032
- Table 6: Global GCC Home Textile Industry Volume K Unit Forecast, by Distribution Channel 2019 & 2032
- Table 7: Global GCC Home Textile Industry Revenue Million Forecast, by Geography 2019 & 2032
- Table 8: Global GCC Home Textile Industry Volume K Unit Forecast, by Geography 2019 & 2032
- Table 9: Global GCC Home Textile Industry Revenue Million Forecast, by Region 2019 & 2032
- Table 10: Global GCC Home Textile Industry Volume K Unit Forecast, by Region 2019 & 2032
- Table 11: Global GCC Home Textile Industry Revenue Million Forecast, by Country 2019 & 2032
- Table 12: Global GCC Home Textile Industry Volume K Unit Forecast, by Country 2019 & 2032
- Table 13: United States GCC Home Textile Industry Revenue (Million) Forecast, by Application 2019 & 2032
- Table 14: United States GCC Home Textile Industry Volume (K Unit) Forecast, by Application 2019 & 2032
- Table 15: Canada GCC Home Textile Industry Revenue (Million) Forecast, by Application 2019 & 2032
- Table 16: Canada GCC Home Textile Industry Volume (K Unit) Forecast, by Application 2019 & 2032
- Table 17: Mexico GCC Home Textile Industry Revenue (Million) Forecast, by Application 2019 & 2032
- Table 18: Mexico GCC Home Textile Industry Volume (K Unit) Forecast, by Application 2019 & 2032
- Table 19: Global GCC Home Textile Industry Revenue Million Forecast, by Country 2019 & 2032
- Table 20: Global GCC Home Textile Industry Volume K Unit Forecast, by Country 2019 & 2032
- Table 21: Germany GCC Home Textile Industry Revenue (Million) Forecast, by Application 2019 & 2032
- Table 22: Germany GCC Home Textile Industry Volume (K Unit) Forecast, by Application 2019 & 2032
- Table 23: United Kingdom GCC Home Textile Industry Revenue (Million) Forecast, by Application 2019 & 2032
- Table 24: United Kingdom GCC Home Textile Industry Volume (K Unit) Forecast, by Application 2019 & 2032
- Table 25: France GCC Home Textile Industry Revenue (Million) Forecast, by Application 2019 & 2032
- Table 26: France GCC Home Textile Industry Volume (K Unit) Forecast, by Application 2019 & 2032
- Table 27: Spain GCC Home Textile Industry Revenue (Million) Forecast, by Application 2019 & 2032
- Table 28: Spain GCC Home Textile Industry Volume (K Unit) Forecast, by Application 2019 & 2032
- Table 29: Italy GCC Home Textile Industry Revenue (Million) Forecast, by Application 2019 & 2032
- Table 30: Italy GCC Home Textile Industry Volume (K Unit) Forecast, by Application 2019 & 2032
- Table 31: Spain GCC Home Textile Industry Revenue (Million) Forecast, by Application 2019 & 2032
- Table 32: Spain GCC Home Textile Industry Volume (K Unit) Forecast, by Application 2019 & 2032
- Table 33: Belgium GCC Home Textile Industry Revenue (Million) Forecast, by Application 2019 & 2032
- Table 34: Belgium GCC Home Textile Industry Volume (K Unit) Forecast, by Application 2019 & 2032
- Table 35: Netherland GCC Home Textile Industry Revenue (Million) Forecast, by Application 2019 & 2032
- Table 36: Netherland GCC Home Textile Industry Volume (K Unit) Forecast, by Application 2019 & 2032
- Table 37: Nordics GCC Home Textile Industry Revenue (Million) Forecast, by Application 2019 & 2032
- Table 38: Nordics GCC Home Textile Industry Volume (K Unit) Forecast, by Application 2019 & 2032
- Table 39: Rest of Europe GCC Home Textile Industry Revenue (Million) Forecast, by Application 2019 & 2032
- Table 40: Rest of Europe GCC Home Textile Industry Volume (K Unit) Forecast, by Application 2019 & 2032
- Table 41: Global GCC Home Textile Industry Revenue Million Forecast, by Country 2019 & 2032
- Table 42: Global GCC Home Textile Industry Volume K Unit Forecast, by Country 2019 & 2032
- Table 43: China GCC Home Textile Industry Revenue (Million) Forecast, by Application 2019 & 2032
- Table 44: China GCC Home Textile Industry Volume (K Unit) Forecast, by Application 2019 & 2032
- Table 45: Japan GCC Home Textile Industry Revenue (Million) Forecast, by Application 2019 & 2032
- Table 46: Japan GCC Home Textile Industry Volume (K Unit) Forecast, by Application 2019 & 2032
- Table 47: India GCC Home Textile Industry Revenue (Million) Forecast, by Application 2019 & 2032
- Table 48: India GCC Home Textile Industry Volume (K Unit) Forecast, by Application 2019 & 2032
- Table 49: South Korea GCC Home Textile Industry Revenue (Million) Forecast, by Application 2019 & 2032
- Table 50: South Korea GCC Home Textile Industry Volume (K Unit) Forecast, by Application 2019 & 2032
- Table 51: Southeast Asia GCC Home Textile Industry Revenue (Million) Forecast, by Application 2019 & 2032
- Table 52: Southeast Asia GCC Home Textile Industry Volume (K Unit) Forecast, by Application 2019 & 2032
- Table 53: Australia GCC Home Textile Industry Revenue (Million) Forecast, by Application 2019 & 2032
- Table 54: Australia GCC Home Textile Industry Volume (K Unit) Forecast, by Application 2019 & 2032
- Table 55: Indonesia GCC Home Textile Industry Revenue (Million) Forecast, by Application 2019 & 2032
- Table 56: Indonesia GCC Home Textile Industry Volume (K Unit) Forecast, by Application 2019 & 2032
- Table 57: Phillipes GCC Home Textile Industry Revenue (Million) Forecast, by Application 2019 & 2032
- Table 58: Phillipes GCC Home Textile Industry Volume (K Unit) Forecast, by Application 2019 & 2032
- Table 59: Singapore GCC Home Textile Industry Revenue (Million) Forecast, by Application 2019 & 2032
- Table 60: Singapore GCC Home Textile Industry Volume (K Unit) Forecast, by Application 2019 & 2032
- Table 61: Thailandc GCC Home Textile Industry Revenue (Million) Forecast, by Application 2019 & 2032
- Table 62: Thailandc GCC Home Textile Industry Volume (K Unit) Forecast, by Application 2019 & 2032
- Table 63: Rest of Asia Pacific GCC Home Textile Industry Revenue (Million) Forecast, by Application 2019 & 2032
- Table 64: Rest of Asia Pacific GCC Home Textile Industry Volume (K Unit) Forecast, by Application 2019 & 2032
- Table 65: Global GCC Home Textile Industry Revenue Million Forecast, by Country 2019 & 2032
- Table 66: Global GCC Home Textile Industry Volume K Unit Forecast, by Country 2019 & 2032
- Table 67: Brazil GCC Home Textile Industry Revenue (Million) Forecast, by Application 2019 & 2032
- Table 68: Brazil GCC Home Textile Industry Volume (K Unit) Forecast, by Application 2019 & 2032
- Table 69: Argentina GCC Home Textile Industry Revenue (Million) Forecast, by Application 2019 & 2032
- Table 70: Argentina GCC Home Textile Industry Volume (K Unit) Forecast, by Application 2019 & 2032
- Table 71: Peru GCC Home Textile Industry Revenue (Million) Forecast, by Application 2019 & 2032
- Table 72: Peru GCC Home Textile Industry Volume (K Unit) Forecast, by Application 2019 & 2032
- Table 73: Chile GCC Home Textile Industry Revenue (Million) Forecast, by Application 2019 & 2032
- Table 74: Chile GCC Home Textile Industry Volume (K Unit) Forecast, by Application 2019 & 2032
- Table 75: Colombia GCC Home Textile Industry Revenue (Million) Forecast, by Application 2019 & 2032
- Table 76: Colombia GCC Home Textile Industry Volume (K Unit) Forecast, by Application 2019 & 2032
- Table 77: Ecuador GCC Home Textile Industry Revenue (Million) Forecast, by Application 2019 & 2032
- Table 78: Ecuador GCC Home Textile Industry Volume (K Unit) Forecast, by Application 2019 & 2032
- Table 79: Venezuela GCC Home Textile Industry Revenue (Million) Forecast, by Application 2019 & 2032
- Table 80: Venezuela GCC Home Textile Industry Volume (K Unit) Forecast, by Application 2019 & 2032
- Table 81: Rest of South America GCC Home Textile Industry Revenue (Million) Forecast, by Application 2019 & 2032
- Table 82: Rest of South America GCC Home Textile Industry Volume (K Unit) Forecast, by Application 2019 & 2032
- Table 83: Global GCC Home Textile Industry Revenue Million Forecast, by Country 2019 & 2032
- Table 84: Global GCC Home Textile Industry Volume K Unit Forecast, by Country 2019 & 2032
- Table 85: United States GCC Home Textile Industry Revenue (Million) Forecast, by Application 2019 & 2032
- Table 86: United States GCC Home Textile Industry Volume (K Unit) Forecast, by Application 2019 & 2032
- Table 87: Canada GCC Home Textile Industry Revenue (Million) Forecast, by Application 2019 & 2032
- Table 88: Canada GCC Home Textile Industry Volume (K Unit) Forecast, by Application 2019 & 2032
- Table 89: Mexico GCC Home Textile Industry Revenue (Million) Forecast, by Application 2019 & 2032
- Table 90: Mexico GCC Home Textile Industry Volume (K Unit) Forecast, by Application 2019 & 2032
- Table 91: Global GCC Home Textile Industry Revenue Million Forecast, by Country 2019 & 2032
- Table 92: Global GCC Home Textile Industry Volume K Unit Forecast, by Country 2019 & 2032
- Table 93: United Arab Emirates GCC Home Textile Industry Revenue (Million) Forecast, by Application 2019 & 2032
- Table 94: United Arab Emirates GCC Home Textile Industry Volume (K Unit) Forecast, by Application 2019 & 2032
- Table 95: Saudi Arabia GCC Home Textile Industry Revenue (Million) Forecast, by Application 2019 & 2032
- Table 96: Saudi Arabia GCC Home Textile Industry Volume (K Unit) Forecast, by Application 2019 & 2032
- Table 97: South Africa GCC Home Textile Industry Revenue (Million) Forecast, by Application 2019 & 2032
- Table 98: South Africa GCC Home Textile Industry Volume (K Unit) Forecast, by Application 2019 & 2032
- Table 99: Rest of Middle East and Africa GCC Home Textile Industry Revenue (Million) Forecast, by Application 2019 & 2032
- Table 100: Rest of Middle East and Africa GCC Home Textile Industry Volume (K Unit) Forecast, by Application 2019 & 2032
- Table 101: Global GCC Home Textile Industry Revenue Million Forecast, by Product Type 2019 & 2032
- Table 102: Global GCC Home Textile Industry Volume K Unit Forecast, by Product Type 2019 & 2032
- Table 103: Global GCC Home Textile Industry Revenue Million Forecast, by Distribution Channel 2019 & 2032
- Table 104: Global GCC Home Textile Industry Volume K Unit Forecast, by Distribution Channel 2019 & 2032
- Table 105: Global GCC Home Textile Industry Revenue Million Forecast, by Geography 2019 & 2032
- Table 106: Global GCC Home Textile Industry Volume K Unit Forecast, by Geography 2019 & 2032
- Table 107: Global GCC Home Textile Industry Revenue Million Forecast, by Country 2019 & 2032
- Table 108: Global GCC Home Textile Industry Volume K Unit Forecast, by Country 2019 & 2032
- Table 109: Global GCC Home Textile Industry Revenue Million Forecast, by Product Type 2019 & 2032
- Table 110: Global GCC Home Textile Industry Volume K Unit Forecast, by Product Type 2019 & 2032
- Table 111: Global GCC Home Textile Industry Revenue Million Forecast, by Distribution Channel 2019 & 2032
- Table 112: Global GCC Home Textile Industry Volume K Unit Forecast, by Distribution Channel 2019 & 2032
- Table 113: Global GCC Home Textile Industry Revenue Million Forecast, by Geography 2019 & 2032
- Table 114: Global GCC Home Textile Industry Volume K Unit Forecast, by Geography 2019 & 2032
- Table 115: Global GCC Home Textile Industry Revenue Million Forecast, by Country 2019 & 2032
- Table 116: Global GCC Home Textile Industry Volume K Unit Forecast, by Country 2019 & 2032
- Table 117: Global GCC Home Textile Industry Revenue Million Forecast, by Product Type 2019 & 2032
- Table 118: Global GCC Home Textile Industry Volume K Unit Forecast, by Product Type 2019 & 2032
- Table 119: Global GCC Home Textile Industry Revenue Million Forecast, by Distribution Channel 2019 & 2032
- Table 120: Global GCC Home Textile Industry Volume K Unit Forecast, by Distribution Channel 2019 & 2032
- Table 121: Global GCC Home Textile Industry Revenue Million Forecast, by Geography 2019 & 2032
- Table 122: Global GCC Home Textile Industry Volume K Unit Forecast, by Geography 2019 & 2032
- Table 123: Global GCC Home Textile Industry Revenue Million Forecast, by Country 2019 & 2032
- Table 124: Global GCC Home Textile Industry Volume K Unit Forecast, by Country 2019 & 2032
- Table 125: Global GCC Home Textile Industry Revenue Million Forecast, by Product Type 2019 & 2032
- Table 126: Global GCC Home Textile Industry Volume K Unit Forecast, by Product Type 2019 & 2032
- Table 127: Global GCC Home Textile Industry Revenue Million Forecast, by Distribution Channel 2019 & 2032
- Table 128: Global GCC Home Textile Industry Volume K Unit Forecast, by Distribution Channel 2019 & 2032
- Table 129: Global GCC Home Textile Industry Revenue Million Forecast, by Geography 2019 & 2032
- Table 130: Global GCC Home Textile Industry Volume K Unit Forecast, by Geography 2019 & 2032
- Table 131: Global GCC Home Textile Industry Revenue Million Forecast, by Country 2019 & 2032
- Table 132: Global GCC Home Textile Industry Volume K Unit Forecast, by Country 2019 & 2032
- Table 133: Global GCC Home Textile Industry Revenue Million Forecast, by Product Type 2019 & 2032
- Table 134: Global GCC Home Textile Industry Volume K Unit Forecast, by Product Type 2019 & 2032
- Table 135: Global GCC Home Textile Industry Revenue Million Forecast, by Distribution Channel 2019 & 2032
- Table 136: Global GCC Home Textile Industry Volume K Unit Forecast, by Distribution Channel 2019 & 2032
- Table 137: Global GCC Home Textile Industry Revenue Million Forecast, by Geography 2019 & 2032
- Table 138: Global GCC Home Textile Industry Volume K Unit Forecast, by Geography 2019 & 2032
- Table 139: Global GCC Home Textile Industry Revenue Million Forecast, by Country 2019 & 2032
- Table 140: Global GCC Home Textile Industry Volume K Unit Forecast, by Country 2019 & 2032
- Table 141: Global GCC Home Textile Industry Revenue Million Forecast, by Product Type 2019 & 2032
- Table 142: Global GCC Home Textile Industry Volume K Unit Forecast, by Product Type 2019 & 2032
- Table 143: Global GCC Home Textile Industry Revenue Million Forecast, by Distribution Channel 2019 & 2032
- Table 144: Global GCC Home Textile Industry Volume K Unit Forecast, by Distribution Channel 2019 & 2032
- Table 145: Global GCC Home Textile Industry Revenue Million Forecast, by Geography 2019 & 2032
- Table 146: Global GCC Home Textile Industry Volume K Unit Forecast, by Geography 2019 & 2032
- Table 147: Global GCC Home Textile Industry Revenue Million Forecast, by Country 2019 & 2032
- Table 148: Global GCC Home Textile Industry Volume K Unit Forecast, by Country 2019 & 2032
Frequently Asked Questions
1. What is the projected Compound Annual Growth Rate (CAGR) of the GCC Home Textile Industry?
The projected CAGR is approximately 3.69%.
2. Which companies are prominent players in the GCC Home Textile Industry?
Key companies in the market include AL Taqwa, Gulf Asian General Trading LLC, Deyarco, Satex, Housetex, Al Sorayai Group, Dicitex, Orient Textiles International LLC, CLF Como Luxury Fabrics LLC, B Tex International L L C.
3. What are the main segments of the GCC Home Textile Industry?
The market segments include Product Type, Distribution Channel, Geography.
4. Can you provide details about the market size?
The market size is estimated to be USD 1.68 Million as of 2022.
5. What are some drivers contributing to market growth?
Rise of Smart Kitchen is Driving the Market; Growing Urbanisation is Driving Need for Quick Meal Preparation.
6. What are the notable trends driving market growth?
Saudi Arabia is driving the growth of the market.
7. Are there any restraints impacting market growth?
Changing Needs and Taste of Customers; Limited Usage of the Product.
8. Can you provide examples of recent developments in the market?
February 2023: Frugado.com launched, offering a wide variety of curated items from international brands. Frugado.com provides shoppers with the perfect mix of stylish sophistication and affordability. Customers can find everything they need - from organic cotton beach towels to classic home textile items like throws, blankets, bedsheets, chic dresses, to kids’ fashion - in one place, making it super easy to stay up-to-date with their style preferences.
9. What pricing options are available for accessing the report?
Pricing options include single-user, multi-user, and enterprise licenses priced at USD 4750, USD 5250, and USD 8750 respectively.
10. Is the market size provided in terms of value or volume?
The market size is provided in terms of value, measured in Million and volume, measured in K Unit.
11. Are there any specific market keywords associated with the report?
Yes, the market keyword associated with the report is "GCC Home Textile Industry," which aids in identifying and referencing the specific market segment covered.
12. How do I determine which pricing option suits my needs best?
The pricing options vary based on user requirements and access needs. Individual users may opt for single-user licenses, while businesses requiring broader access may choose multi-user or enterprise licenses for cost-effective access to the report.
13. Are there any additional resources or data provided in the GCC Home Textile Industry report?
While the report offers comprehensive insights, it's advisable to review the specific contents or supplementary materials provided to ascertain if additional resources or data are available.
14. How can I stay updated on further developments or reports in the GCC Home Textile Industry?
To stay informed about further developments, trends, and reports in the GCC Home Textile Industry, consider subscribing to industry newsletters, following relevant companies and organizations, or regularly checking reputable industry news sources and publications.
Methodology
Step 1 - Identification of Relevant Samples Size from Population Database


Step 2 - Approaches for Defining Global Market Size (Value, Volume* & Price*)

Note*: In applicable scenarios
Step 3 - Data Sources
Primary Research
- Web Analytics
- Survey Reports
- Research Institute
- Latest Research Reports
- Opinion Leaders
Secondary Research
- Annual Reports
- White Paper
- Latest Press Release
- Industry Association
- Paid Database
- Investor Presentations

Step 4 - Data Triangulation
Involves using different sources of information in order to increase the validity of a study
These sources are likely to be stakeholders in a program - participants, other researchers, program staff, other community members, and so on.
Then we put all data in single framework & apply various statistical tools to find out the dynamic on the market.
During the analysis stage, feedback from the stakeholder groups would be compared to determine areas of agreement as well as areas of divergence


