
Key Insights
The Functional Near-infrared Optical Brain Imaging (fNIRI) market is experiencing robust growth, driven by the increasing prevalence of neurological disorders like Parkinson's disease, epilepsy, and dementia, coupled with the rising adoption of non-invasive brain imaging techniques. The market's Compound Annual Growth Rate (CAGR) of 5.65% from 2019-2033 indicates a steady expansion, projected to reach a substantial market size. Technological advancements leading to improved image resolution, portability, and affordability are key drivers. Furthermore, the growing demand for precise diagnostic tools in hospitals and diagnostic centers fuels market expansion. While the high initial investment cost for equipment can be a restraint, the increasing awareness of the benefits of fNIRI, particularly in early diagnosis and personalized treatment, is mitigating this factor. Segmentation analysis reveals a significant market share held by applications in Parkinson's Disease and Epilepsy, while the North American and European regions currently dominate due to advanced healthcare infrastructure and greater adoption rates. However, the Asia Pacific region is anticipated to witness significant growth in the coming years due to expanding healthcare spending and a rising prevalence of neurological diseases. This growth is expected to be fueled by increased investments in research and development, leading to innovations in fNIRI technology and its applications.
The competitive landscape includes a mix of established players like PerkinElmer Inc. and Shimadzu Corporation and smaller specialized companies like NIRx Medical Technologies LLC and Soterix Medical Inc. This competitive dynamic fosters innovation and drives down costs, making fNIRI more accessible. Future market growth will depend on several factors, including the continued development of sophisticated algorithms for data analysis, the integration of fNIRI with other neuroimaging modalities, and the expansion of clinical trials demonstrating the efficacy of fNIRI in various neurological applications. Successful collaborations between technology providers and healthcare institutions will be crucial in accelerating market penetration and expanding the utilization of fNIRI in clinical practice and research.
Functional Near-infrared Optical Brain Imaging Market: A Comprehensive Report (2019-2033)
This detailed report provides a comprehensive analysis of the Functional Near-infrared Optical Brain Imaging (fNIRS) market, offering invaluable insights for industry stakeholders, investors, and researchers. The study period covers 2019-2033, with 2025 as the base and estimated year, and a forecast period of 2025-2033. The report delves into market size, segmentation, growth drivers, challenges, competitive landscape, and key technological advancements, projecting a market value of xx Million by 2033.
Functional Near-infrared Optical Brain Imaging Market Structure & Competitive Dynamics
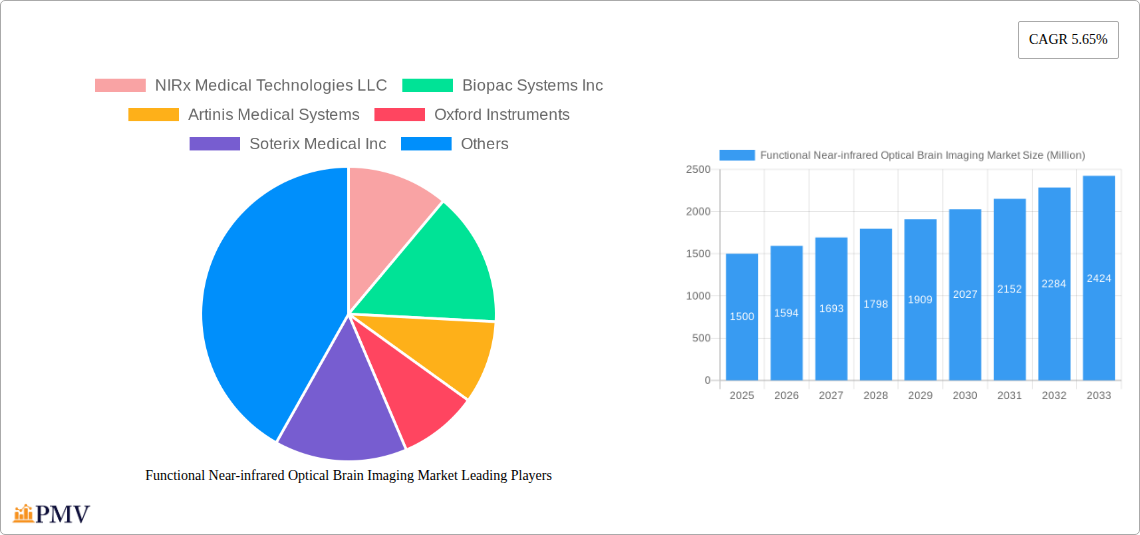
The fNIRS market exhibits a moderately concentrated structure, with key players such as NIRx Medical Technologies LLC, Biopac Systems Inc, Artinis Medical Systems, and Oxford Instruments holding significant market share. However, the emergence of smaller, innovative companies is increasing competition. The market is characterized by a dynamic innovation ecosystem, fueled by advancements in fNIRS technology and its applications in various neurological disorders. Regulatory frameworks, while generally supportive, vary across regions, impacting market access. Product substitutes, such as EEG and fMRI, exist, but fNIRS offers advantages in portability, cost-effectiveness, and non-invasiveness. The market has witnessed several M&A activities in recent years, although the exact deal values remain undisclosed in many cases (xx Million in total estimated M&A value from 2019-2024). End-user trends indicate a growing preference for portable and user-friendly fNIRS systems, particularly in diagnostic centers.
- Market Concentration: Moderately concentrated, with top players holding xx% market share in 2024.
- Innovation Ecosystem: Highly active, driven by advancements in sensor technology and data analysis.
- Regulatory Frameworks: Vary across regions, impacting market entry and adoption.
- M&A Activity: Moderate activity observed in the historical period, with xx Million in estimated deal value.
Functional Near-infrared Optical Brain Imaging Market Industry Trends & Insights
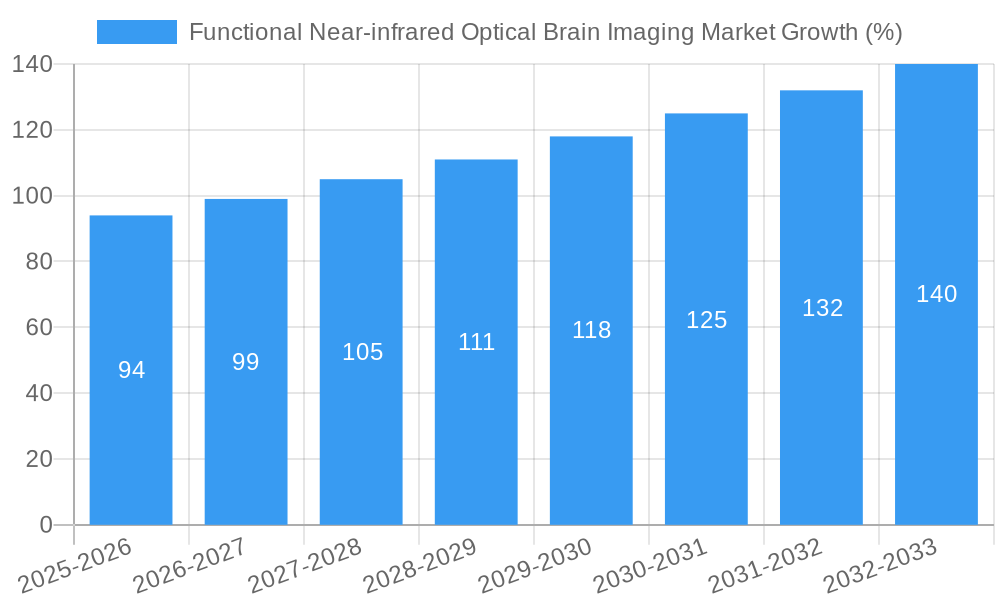
The fNIRS market is experiencing robust growth, driven by increasing prevalence of neurological disorders, rising demand for non-invasive brain imaging techniques, and technological advancements leading to improved accuracy and affordability. The market is expected to register a CAGR of xx% during the forecast period (2025-2033). This growth is fueled by the increasing adoption of fNIRS in clinical settings for diagnosis and monitoring of various conditions, including Parkinson's disease, epilepsy, and traumatic brain injury. Technological advancements, such as the development of wearable fNIRS devices and improved data analysis algorithms, are further accelerating market penetration. Consumer preferences are shifting towards portable, user-friendly systems with better data visualization capabilities. The competitive landscape remains dynamic, with both established players and new entrants vying for market share through product innovation and strategic partnerships. Market penetration in key regions like North America and Europe is high, with emerging markets showing significant growth potential.
Dominant Markets & Segments in Functional Near-infrared Optical Brain Imaging Market
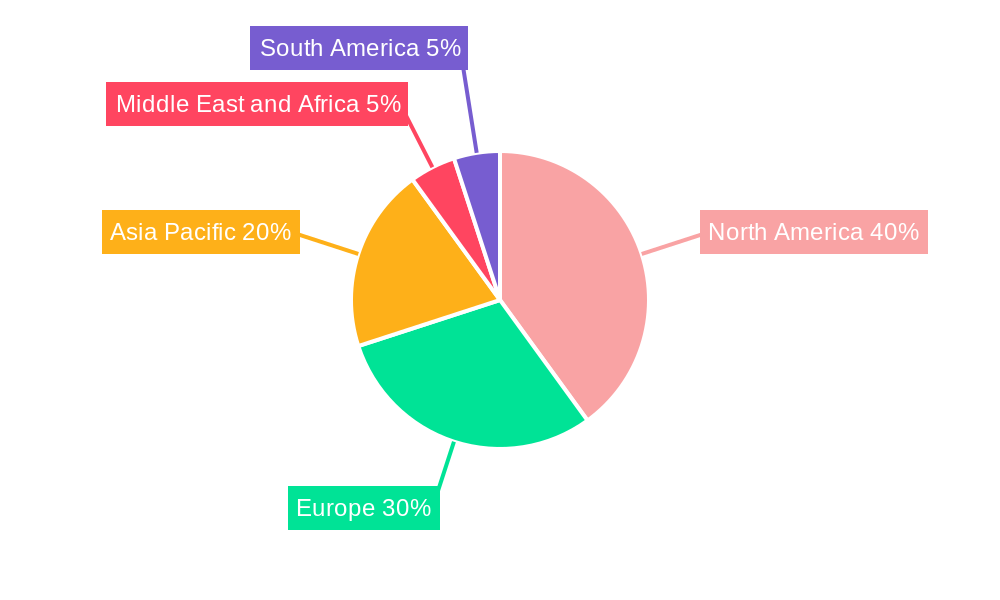
North America currently dominates the fNIRS market, driven by factors such as high healthcare expenditure, well-established healthcare infrastructure, and early adoption of advanced medical technologies. Within application types, the diagnosis and monitoring of Traumatic Brain Injury (TBI) currently holds a significant market share due to its high prevalence and unmet clinical needs. Hospitals are the leading end-users, accounting for a significant portion of the market revenue.
Key Drivers for North American Dominance:
- High healthcare expenditure and robust healthcare infrastructure.
- Early adoption of advanced medical technologies and research funding.
- High prevalence of neurological disorders.
Key Drivers for TBI Segment Dominance:
- High prevalence of TBI globally.
- Growing need for accurate and timely diagnosis and monitoring.
- fNIRS offers non-invasive and portable assessment capabilities.
Hospitals as Leading End-Users:
- Well-equipped with necessary infrastructure for fNIRS implementation.
- High patient volume driving increased demand.
Functional Near-infrared Optical Brain Imaging Market Product Innovations
Recent years have witnessed significant advancements in fNIRS technology, including the development of wearable and portable systems, enhanced sensor designs for improved signal quality, and sophisticated data analysis algorithms for better accuracy and clinical interpretation. These innovations address the limitations of traditional fNIRS systems and expand its applications across various neurological and cognitive research settings. The market is seeing a trend towards integration of fNIRS with other neuroimaging modalities for comprehensive brain assessments. This trend leads to more accurate and detailed neurophysiological information, thereby contributing to improved diagnostic accuracy and personalized treatment strategies.
Report Segmentation & Scope
The fNIRS market is segmented by application type (Parkinson's Disease, Epilepsy, Dementia, Traumatic Brain Injury, Sleep Disorders, Other Application Types) and end-user (Hospitals, Diagnostic Centers). Each segment exhibits unique growth projections, market sizes, and competitive dynamics. The "Other Application Types" segment is expected to experience significant growth due to the expanding scope of fNIRS applications in cognitive neuroscience research. Diagnostic centers are anticipated to show strong growth potential, driven by increased demand for cost-effective and easily accessible brain imaging services.
Key Drivers of Functional Near-infrared Optical Brain Imaging Market Growth
The growth of the fNIRS market is propelled by several factors, including technological advancements in sensor technology and data analysis leading to improved accuracy and accessibility, the increasing prevalence of neurological disorders requiring non-invasive diagnostic tools, and rising healthcare spending globally. Favorable regulatory environments in several key markets also support market expansion. The growing adoption of fNIRS in research settings contributes to the expansion of the market as well.
Challenges in the Functional Near-infrared Optical Brain Imaging Market Sector
Despite its significant potential, the fNIRS market faces challenges, including the relatively high cost of advanced systems, limitations in depth penetration of light, and the need for skilled personnel for data acquisition and analysis. Competition from alternative neuroimaging techniques, such as EEG and fMRI, also poses a significant challenge. The relatively slow adoption in certain regions due to limited awareness also impacts overall market growth. These factors collectively influence market growth, creating hurdles to widespread adoption.
Leading Players in the Functional Near-infrared Optical Brain Imaging Market Market
- NIRx Medical Technologies LLC
- Biopac Systems Inc
- Artinis Medical Systems
- Oxford Instruments
- Soterix Medical Inc
- Gowerlabs Ltd
- Fujifilm Holdings Corporation (Hitachi Ltd)
- PerkinElmer Inc
- Shimadzu Corporation
Key Developments in Functional Near-infrared Optical Brain Imaging Market Sector
- March 2022: Kernel launched Kernel Flow, a wearable TD-fNIRS headset offering high-resolution brain measurement. This development significantly impacts the market by increasing accessibility and usability.
- March 2022: MYndspan launched a brain imaging service utilizing brain connectivity analysis, expanding the application of fNIRS in brain health assessment. This expansion broadens the market's application beyond diagnostics.
Strategic Functional Near-infrared Optical Brain Imaging Market Outlook
The fNIRS market holds immense potential for growth, driven by continued technological advancements, increasing prevalence of neurological disorders, and the growing demand for non-invasive and cost-effective brain imaging solutions. Strategic opportunities exist for companies focusing on developing portable and user-friendly systems, integrating fNIRS with other neuroimaging modalities, and expanding into emerging markets. Companies that focus on developing robust data analysis tools and algorithms will also gain a competitive advantage in this rapidly evolving market.
Functional Near-infrared Optical Brain Imaging Market Segmentation
-
1. Application Type
- 1.1. Parkinson's Disease
- 1.2. Epilepsy
- 1.3. Dementia
- 1.4. Traumatic Brain Injury
- 1.5. Sleep Disorders
- 1.6. Other Application Types
-
2. End-User
- 2.1. Hospitals
- 2.2. Diagnostic Centers
Functional Near-infrared Optical Brain Imaging Market Segmentation By Geography
-
1. North America
- 1.1. United States
- 1.2. Canada
- 1.3. Mexico
-
2. Europe
- 2.1. Germany
- 2.2. United Kingdom
- 2.3. France
- 2.4. Italy
- 2.5. Spain
- 2.6. Rest of Europe
-
3. Asia Pacific
- 3.1. China
- 3.2. Japan
- 3.3. India
- 3.4. Australia
- 3.5. South Korea
- 3.6. Rest of Asia Pacific
-
4. Middle East and Africa
- 4.1. GCC
- 4.2. South Africa
- 4.3. Rest of Middle East and Africa
-
5. South America
- 5.1. Brazil
- 5.2. Argentina
- 5.3. Rest of South America
Functional Near-infrared Optical Brain Imaging Market REPORT HIGHLIGHTS
| Aspects | Details |
|---|---|
| Study Period | 2019-2033 |
| Base Year | 2024 |
| Estimated Year | 2025 |
| Forecast Period | 2025-2033 |
| Historical Period | 2019-2024 |
| Growth Rate | CAGR of 5.65% from 2019-2033 |
| Segmentation |
|
Table of Contents
- 1. Introduction
- 1.1. Research Scope
- 1.2. Market Segmentation
- 1.3. Research Methodology
- 1.4. Definitions and Assumptions
- 2. Executive Summary
- 2.1. Introduction
- 3. Market Dynamics
- 3.1. Introduction
- 3.2. Market Drivers
- 3.2.1. Rising Prevalence of Neurological Disorders; Emerging Trends in Products
- 3.3. Market Restrains
- 3.3.1. Lack of Skilled Professionals
- 3.4. Market Trends
- 3.4.1. Traumatic Brain Injury Segment Expects to Register a Strong Growth in the Forecast Period
- 4. Market Factor Analysis
- 4.1. Porters Five Forces
- 4.2. Supply/Value Chain
- 4.3. PESTEL analysis
- 4.4. Market Entropy
- 4.5. Patent/Trademark Analysis
- 5. Global Functional Near-infrared Optical Brain Imaging Market Analysis, Insights and Forecast, 2019-2031
- 5.1. Market Analysis, Insights and Forecast - by Application Type
- 5.1.1. Parkinson's Disease
- 5.1.2. Epilepsy
- 5.1.3. Dementia
- 5.1.4. Traumatic Brain Injury
- 5.1.5. Sleep Disorders
- 5.1.6. Other Application Types
- 5.2. Market Analysis, Insights and Forecast - by End-User
- 5.2.1. Hospitals
- 5.2.2. Diagnostic Centers
- 5.3. Market Analysis, Insights and Forecast - by Region
- 5.3.1. North America
- 5.3.2. Europe
- 5.3.3. Asia Pacific
- 5.3.4. Middle East and Africa
- 5.3.5. South America
- 5.1. Market Analysis, Insights and Forecast - by Application Type
- 6. North America Functional Near-infrared Optical Brain Imaging Market Analysis, Insights and Forecast, 2019-2031
- 6.1. Market Analysis, Insights and Forecast - by Application Type
- 6.1.1. Parkinson's Disease
- 6.1.2. Epilepsy
- 6.1.3. Dementia
- 6.1.4. Traumatic Brain Injury
- 6.1.5. Sleep Disorders
- 6.1.6. Other Application Types
- 6.2. Market Analysis, Insights and Forecast - by End-User
- 6.2.1. Hospitals
- 6.2.2. Diagnostic Centers
- 6.1. Market Analysis, Insights and Forecast - by Application Type
- 7. Europe Functional Near-infrared Optical Brain Imaging Market Analysis, Insights and Forecast, 2019-2031
- 7.1. Market Analysis, Insights and Forecast - by Application Type
- 7.1.1. Parkinson's Disease
- 7.1.2. Epilepsy
- 7.1.3. Dementia
- 7.1.4. Traumatic Brain Injury
- 7.1.5. Sleep Disorders
- 7.1.6. Other Application Types
- 7.2. Market Analysis, Insights and Forecast - by End-User
- 7.2.1. Hospitals
- 7.2.2. Diagnostic Centers
- 7.1. Market Analysis, Insights and Forecast - by Application Type
- 8. Asia Pacific Functional Near-infrared Optical Brain Imaging Market Analysis, Insights and Forecast, 2019-2031
- 8.1. Market Analysis, Insights and Forecast - by Application Type
- 8.1.1. Parkinson's Disease
- 8.1.2. Epilepsy
- 8.1.3. Dementia
- 8.1.4. Traumatic Brain Injury
- 8.1.5. Sleep Disorders
- 8.1.6. Other Application Types
- 8.2. Market Analysis, Insights and Forecast - by End-User
- 8.2.1. Hospitals
- 8.2.2. Diagnostic Centers
- 8.1. Market Analysis, Insights and Forecast - by Application Type
- 9. Middle East and Africa Functional Near-infrared Optical Brain Imaging Market Analysis, Insights and Forecast, 2019-2031
- 9.1. Market Analysis, Insights and Forecast - by Application Type
- 9.1.1. Parkinson's Disease
- 9.1.2. Epilepsy
- 9.1.3. Dementia
- 9.1.4. Traumatic Brain Injury
- 9.1.5. Sleep Disorders
- 9.1.6. Other Application Types
- 9.2. Market Analysis, Insights and Forecast - by End-User
- 9.2.1. Hospitals
- 9.2.2. Diagnostic Centers
- 9.1. Market Analysis, Insights and Forecast - by Application Type
- 10. South America Functional Near-infrared Optical Brain Imaging Market Analysis, Insights and Forecast, 2019-2031
- 10.1. Market Analysis, Insights and Forecast - by Application Type
- 10.1.1. Parkinson's Disease
- 10.1.2. Epilepsy
- 10.1.3. Dementia
- 10.1.4. Traumatic Brain Injury
- 10.1.5. Sleep Disorders
- 10.1.6. Other Application Types
- 10.2. Market Analysis, Insights and Forecast - by End-User
- 10.2.1. Hospitals
- 10.2.2. Diagnostic Centers
- 10.1. Market Analysis, Insights and Forecast - by Application Type
- 11. North America Functional Near-infrared Optical Brain Imaging Market Analysis, Insights and Forecast, 2019-2031
- 11.1. Market Analysis, Insights and Forecast - By Country/Sub-region
- 11.1.1. undefined
- 12. Europe Functional Near-infrared Optical Brain Imaging Market Analysis, Insights and Forecast, 2019-2031
- 12.1. Market Analysis, Insights and Forecast - By Country/Sub-region
- 12.1.1. undefined
- 13. Asia Pacific Functional Near-infrared Optical Brain Imaging Market Analysis, Insights and Forecast, 2019-2031
- 13.1. Market Analysis, Insights and Forecast - By Country/Sub-region
- 13.1.1. undefined
- 14. Middle East and Africa Functional Near-infrared Optical Brain Imaging Market Analysis, Insights and Forecast, 2019-2031
- 14.1. Market Analysis, Insights and Forecast - By Country/Sub-region
- 14.1.1. undefined
- 15. South America Functional Near-infrared Optical Brain Imaging Market Analysis, Insights and Forecast, 2019-2031
- 15.1. Market Analysis, Insights and Forecast - By Country/Sub-region
- 15.1.1. undefined
- 16. Competitive Analysis
- 16.1. Global Market Share Analysis 2024
- 16.2. Company Profiles
- 16.2.1 NIRx Medical Technologies LLC
- 16.2.1.1. Overview
- 16.2.1.2. Products
- 16.2.1.3. SWOT Analysis
- 16.2.1.4. Recent Developments
- 16.2.1.5. Financials (Based on Availability)
- 16.2.2 Biopac Systems Inc
- 16.2.2.1. Overview
- 16.2.2.2. Products
- 16.2.2.3. SWOT Analysis
- 16.2.2.4. Recent Developments
- 16.2.2.5. Financials (Based on Availability)
- 16.2.3 Artinis Medical Systems
- 16.2.3.1. Overview
- 16.2.3.2. Products
- 16.2.3.3. SWOT Analysis
- 16.2.3.4. Recent Developments
- 16.2.3.5. Financials (Based on Availability)
- 16.2.4 Oxford Instruments
- 16.2.4.1. Overview
- 16.2.4.2. Products
- 16.2.4.3. SWOT Analysis
- 16.2.4.4. Recent Developments
- 16.2.4.5. Financials (Based on Availability)
- 16.2.5 Soterix Medical Inc
- 16.2.5.1. Overview
- 16.2.5.2. Products
- 16.2.5.3. SWOT Analysis
- 16.2.5.4. Recent Developments
- 16.2.5.5. Financials (Based on Availability)
- 16.2.6 Gowerlabs Ltd
- 16.2.6.1. Overview
- 16.2.6.2. Products
- 16.2.6.3. SWOT Analysis
- 16.2.6.4. Recent Developments
- 16.2.6.5. Financials (Based on Availability)
- 16.2.7 Fujifilm Holdings Corporation (Hitachi Ltd )
- 16.2.7.1. Overview
- 16.2.7.2. Products
- 16.2.7.3. SWOT Analysis
- 16.2.7.4. Recent Developments
- 16.2.7.5. Financials (Based on Availability)
- 16.2.8 PerkinElmer Inc
- 16.2.8.1. Overview
- 16.2.8.2. Products
- 16.2.8.3. SWOT Analysis
- 16.2.8.4. Recent Developments
- 16.2.8.5. Financials (Based on Availability)
- 16.2.9 Shimadzu Corporation
- 16.2.9.1. Overview
- 16.2.9.2. Products
- 16.2.9.3. SWOT Analysis
- 16.2.9.4. Recent Developments
- 16.2.9.5. Financials (Based on Availability)
- 16.2.1 NIRx Medical Technologies LLC
List of Figures
- Figure 1: Global Functional Near-infrared Optical Brain Imaging Market Revenue Breakdown (Million, %) by Region 2024 & 2032
- Figure 2: Global Functional Near-infrared Optical Brain Imaging Market Volume Breakdown (K Unit, %) by Region 2024 & 2032
- Figure 3: North America Functional Near-infrared Optical Brain Imaging Market Revenue (Million), by Country 2024 & 2032
- Figure 4: North America Functional Near-infrared Optical Brain Imaging Market Volume (K Unit), by Country 2024 & 2032
- Figure 5: North America Functional Near-infrared Optical Brain Imaging Market Revenue Share (%), by Country 2024 & 2032
- Figure 6: North America Functional Near-infrared Optical Brain Imaging Market Volume Share (%), by Country 2024 & 2032
- Figure 7: Europe Functional Near-infrared Optical Brain Imaging Market Revenue (Million), by Country 2024 & 2032
- Figure 8: Europe Functional Near-infrared Optical Brain Imaging Market Volume (K Unit), by Country 2024 & 2032
- Figure 9: Europe Functional Near-infrared Optical Brain Imaging Market Revenue Share (%), by Country 2024 & 2032
- Figure 10: Europe Functional Near-infrared Optical Brain Imaging Market Volume Share (%), by Country 2024 & 2032
- Figure 11: Asia Pacific Functional Near-infrared Optical Brain Imaging Market Revenue (Million), by Country 2024 & 2032
- Figure 12: Asia Pacific Functional Near-infrared Optical Brain Imaging Market Volume (K Unit), by Country 2024 & 2032
- Figure 13: Asia Pacific Functional Near-infrared Optical Brain Imaging Market Revenue Share (%), by Country 2024 & 2032
- Figure 14: Asia Pacific Functional Near-infrared Optical Brain Imaging Market Volume Share (%), by Country 2024 & 2032
- Figure 15: Middle East and Africa Functional Near-infrared Optical Brain Imaging Market Revenue (Million), by Country 2024 & 2032
- Figure 16: Middle East and Africa Functional Near-infrared Optical Brain Imaging Market Volume (K Unit), by Country 2024 & 2032
- Figure 17: Middle East and Africa Functional Near-infrared Optical Brain Imaging Market Revenue Share (%), by Country 2024 & 2032
- Figure 18: Middle East and Africa Functional Near-infrared Optical Brain Imaging Market Volume Share (%), by Country 2024 & 2032
- Figure 19: South America Functional Near-infrared Optical Brain Imaging Market Revenue (Million), by Country 2024 & 2032
- Figure 20: South America Functional Near-infrared Optical Brain Imaging Market Volume (K Unit), by Country 2024 & 2032
- Figure 21: South America Functional Near-infrared Optical Brain Imaging Market Revenue Share (%), by Country 2024 & 2032
- Figure 22: South America Functional Near-infrared Optical Brain Imaging Market Volume Share (%), by Country 2024 & 2032
- Figure 23: North America Functional Near-infrared Optical Brain Imaging Market Revenue (Million), by Application Type 2024 & 2032
- Figure 24: North America Functional Near-infrared Optical Brain Imaging Market Volume (K Unit), by Application Type 2024 & 2032
- Figure 25: North America Functional Near-infrared Optical Brain Imaging Market Revenue Share (%), by Application Type 2024 & 2032
- Figure 26: North America Functional Near-infrared Optical Brain Imaging Market Volume Share (%), by Application Type 2024 & 2032
- Figure 27: North America Functional Near-infrared Optical Brain Imaging Market Revenue (Million), by End-User 2024 & 2032
- Figure 28: North America Functional Near-infrared Optical Brain Imaging Market Volume (K Unit), by End-User 2024 & 2032
- Figure 29: North America Functional Near-infrared Optical Brain Imaging Market Revenue Share (%), by End-User 2024 & 2032
- Figure 30: North America Functional Near-infrared Optical Brain Imaging Market Volume Share (%), by End-User 2024 & 2032
- Figure 31: North America Functional Near-infrared Optical Brain Imaging Market Revenue (Million), by Country 2024 & 2032
- Figure 32: North America Functional Near-infrared Optical Brain Imaging Market Volume (K Unit), by Country 2024 & 2032
- Figure 33: North America Functional Near-infrared Optical Brain Imaging Market Revenue Share (%), by Country 2024 & 2032
- Figure 34: North America Functional Near-infrared Optical Brain Imaging Market Volume Share (%), by Country 2024 & 2032
- Figure 35: Europe Functional Near-infrared Optical Brain Imaging Market Revenue (Million), by Application Type 2024 & 2032
- Figure 36: Europe Functional Near-infrared Optical Brain Imaging Market Volume (K Unit), by Application Type 2024 & 2032
- Figure 37: Europe Functional Near-infrared Optical Brain Imaging Market Revenue Share (%), by Application Type 2024 & 2032
- Figure 38: Europe Functional Near-infrared Optical Brain Imaging Market Volume Share (%), by Application Type 2024 & 2032
- Figure 39: Europe Functional Near-infrared Optical Brain Imaging Market Revenue (Million), by End-User 2024 & 2032
- Figure 40: Europe Functional Near-infrared Optical Brain Imaging Market Volume (K Unit), by End-User 2024 & 2032
- Figure 41: Europe Functional Near-infrared Optical Brain Imaging Market Revenue Share (%), by End-User 2024 & 2032
- Figure 42: Europe Functional Near-infrared Optical Brain Imaging Market Volume Share (%), by End-User 2024 & 2032
- Figure 43: Europe Functional Near-infrared Optical Brain Imaging Market Revenue (Million), by Country 2024 & 2032
- Figure 44: Europe Functional Near-infrared Optical Brain Imaging Market Volume (K Unit), by Country 2024 & 2032
- Figure 45: Europe Functional Near-infrared Optical Brain Imaging Market Revenue Share (%), by Country 2024 & 2032
- Figure 46: Europe Functional Near-infrared Optical Brain Imaging Market Volume Share (%), by Country 2024 & 2032
- Figure 47: Asia Pacific Functional Near-infrared Optical Brain Imaging Market Revenue (Million), by Application Type 2024 & 2032
- Figure 48: Asia Pacific Functional Near-infrared Optical Brain Imaging Market Volume (K Unit), by Application Type 2024 & 2032
- Figure 49: Asia Pacific Functional Near-infrared Optical Brain Imaging Market Revenue Share (%), by Application Type 2024 & 2032
- Figure 50: Asia Pacific Functional Near-infrared Optical Brain Imaging Market Volume Share (%), by Application Type 2024 & 2032
- Figure 51: Asia Pacific Functional Near-infrared Optical Brain Imaging Market Revenue (Million), by End-User 2024 & 2032
- Figure 52: Asia Pacific Functional Near-infrared Optical Brain Imaging Market Volume (K Unit), by End-User 2024 & 2032
- Figure 53: Asia Pacific Functional Near-infrared Optical Brain Imaging Market Revenue Share (%), by End-User 2024 & 2032
- Figure 54: Asia Pacific Functional Near-infrared Optical Brain Imaging Market Volume Share (%), by End-User 2024 & 2032
- Figure 55: Asia Pacific Functional Near-infrared Optical Brain Imaging Market Revenue (Million), by Country 2024 & 2032
- Figure 56: Asia Pacific Functional Near-infrared Optical Brain Imaging Market Volume (K Unit), by Country 2024 & 2032
- Figure 57: Asia Pacific Functional Near-infrared Optical Brain Imaging Market Revenue Share (%), by Country 2024 & 2032
- Figure 58: Asia Pacific Functional Near-infrared Optical Brain Imaging Market Volume Share (%), by Country 2024 & 2032
- Figure 59: Middle East and Africa Functional Near-infrared Optical Brain Imaging Market Revenue (Million), by Application Type 2024 & 2032
- Figure 60: Middle East and Africa Functional Near-infrared Optical Brain Imaging Market Volume (K Unit), by Application Type 2024 & 2032
- Figure 61: Middle East and Africa Functional Near-infrared Optical Brain Imaging Market Revenue Share (%), by Application Type 2024 & 2032
- Figure 62: Middle East and Africa Functional Near-infrared Optical Brain Imaging Market Volume Share (%), by Application Type 2024 & 2032
- Figure 63: Middle East and Africa Functional Near-infrared Optical Brain Imaging Market Revenue (Million), by End-User 2024 & 2032
- Figure 64: Middle East and Africa Functional Near-infrared Optical Brain Imaging Market Volume (K Unit), by End-User 2024 & 2032
- Figure 65: Middle East and Africa Functional Near-infrared Optical Brain Imaging Market Revenue Share (%), by End-User 2024 & 2032
- Figure 66: Middle East and Africa Functional Near-infrared Optical Brain Imaging Market Volume Share (%), by End-User 2024 & 2032
- Figure 67: Middle East and Africa Functional Near-infrared Optical Brain Imaging Market Revenue (Million), by Country 2024 & 2032
- Figure 68: Middle East and Africa Functional Near-infrared Optical Brain Imaging Market Volume (K Unit), by Country 2024 & 2032
- Figure 69: Middle East and Africa Functional Near-infrared Optical Brain Imaging Market Revenue Share (%), by Country 2024 & 2032
- Figure 70: Middle East and Africa Functional Near-infrared Optical Brain Imaging Market Volume Share (%), by Country 2024 & 2032
- Figure 71: South America Functional Near-infrared Optical Brain Imaging Market Revenue (Million), by Application Type 2024 & 2032
- Figure 72: South America Functional Near-infrared Optical Brain Imaging Market Volume (K Unit), by Application Type 2024 & 2032
- Figure 73: South America Functional Near-infrared Optical Brain Imaging Market Revenue Share (%), by Application Type 2024 & 2032
- Figure 74: South America Functional Near-infrared Optical Brain Imaging Market Volume Share (%), by Application Type 2024 & 2032
- Figure 75: South America Functional Near-infrared Optical Brain Imaging Market Revenue (Million), by End-User 2024 & 2032
- Figure 76: South America Functional Near-infrared Optical Brain Imaging Market Volume (K Unit), by End-User 2024 & 2032
- Figure 77: South America Functional Near-infrared Optical Brain Imaging Market Revenue Share (%), by End-User 2024 & 2032
- Figure 78: South America Functional Near-infrared Optical Brain Imaging Market Volume Share (%), by End-User 2024 & 2032
- Figure 79: South America Functional Near-infrared Optical Brain Imaging Market Revenue (Million), by Country 2024 & 2032
- Figure 80: South America Functional Near-infrared Optical Brain Imaging Market Volume (K Unit), by Country 2024 & 2032
- Figure 81: South America Functional Near-infrared Optical Brain Imaging Market Revenue Share (%), by Country 2024 & 2032
- Figure 82: South America Functional Near-infrared Optical Brain Imaging Market Volume Share (%), by Country 2024 & 2032
List of Tables
- Table 1: Global Functional Near-infrared Optical Brain Imaging Market Revenue Million Forecast, by Region 2019 & 2032
- Table 2: Global Functional Near-infrared Optical Brain Imaging Market Volume K Unit Forecast, by Region 2019 & 2032
- Table 3: Global Functional Near-infrared Optical Brain Imaging Market Revenue Million Forecast, by Application Type 2019 & 2032
- Table 4: Global Functional Near-infrared Optical Brain Imaging Market Volume K Unit Forecast, by Application Type 2019 & 2032
- Table 5: Global Functional Near-infrared Optical Brain Imaging Market Revenue Million Forecast, by End-User 2019 & 2032
- Table 6: Global Functional Near-infrared Optical Brain Imaging Market Volume K Unit Forecast, by End-User 2019 & 2032
- Table 7: Global Functional Near-infrared Optical Brain Imaging Market Revenue Million Forecast, by Region 2019 & 2032
- Table 8: Global Functional Near-infrared Optical Brain Imaging Market Volume K Unit Forecast, by Region 2019 & 2032
- Table 9: Global Functional Near-infrared Optical Brain Imaging Market Revenue Million Forecast, by Country 2019 & 2032
- Table 10: Global Functional Near-infrared Optical Brain Imaging Market Volume K Unit Forecast, by Country 2019 & 2032
- Table 11: Global Functional Near-infrared Optical Brain Imaging Market Revenue Million Forecast, by Country 2019 & 2032
- Table 12: Global Functional Near-infrared Optical Brain Imaging Market Volume K Unit Forecast, by Country 2019 & 2032
- Table 13: Global Functional Near-infrared Optical Brain Imaging Market Revenue Million Forecast, by Country 2019 & 2032
- Table 14: Global Functional Near-infrared Optical Brain Imaging Market Volume K Unit Forecast, by Country 2019 & 2032
- Table 15: Global Functional Near-infrared Optical Brain Imaging Market Revenue Million Forecast, by Country 2019 & 2032
- Table 16: Global Functional Near-infrared Optical Brain Imaging Market Volume K Unit Forecast, by Country 2019 & 2032
- Table 17: Global Functional Near-infrared Optical Brain Imaging Market Revenue Million Forecast, by Country 2019 & 2032
- Table 18: Global Functional Near-infrared Optical Brain Imaging Market Volume K Unit Forecast, by Country 2019 & 2032
- Table 19: Global Functional Near-infrared Optical Brain Imaging Market Revenue Million Forecast, by Application Type 2019 & 2032
- Table 20: Global Functional Near-infrared Optical Brain Imaging Market Volume K Unit Forecast, by Application Type 2019 & 2032
- Table 21: Global Functional Near-infrared Optical Brain Imaging Market Revenue Million Forecast, by End-User 2019 & 2032
- Table 22: Global Functional Near-infrared Optical Brain Imaging Market Volume K Unit Forecast, by End-User 2019 & 2032
- Table 23: Global Functional Near-infrared Optical Brain Imaging Market Revenue Million Forecast, by Country 2019 & 2032
- Table 24: Global Functional Near-infrared Optical Brain Imaging Market Volume K Unit Forecast, by Country 2019 & 2032
- Table 25: United States Functional Near-infrared Optical Brain Imaging Market Revenue (Million) Forecast, by Application 2019 & 2032
- Table 26: United States Functional Near-infrared Optical Brain Imaging Market Volume (K Unit) Forecast, by Application 2019 & 2032
- Table 27: Canada Functional Near-infrared Optical Brain Imaging Market Revenue (Million) Forecast, by Application 2019 & 2032
- Table 28: Canada Functional Near-infrared Optical Brain Imaging Market Volume (K Unit) Forecast, by Application 2019 & 2032
- Table 29: Mexico Functional Near-infrared Optical Brain Imaging Market Revenue (Million) Forecast, by Application 2019 & 2032
- Table 30: Mexico Functional Near-infrared Optical Brain Imaging Market Volume (K Unit) Forecast, by Application 2019 & 2032
- Table 31: Global Functional Near-infrared Optical Brain Imaging Market Revenue Million Forecast, by Application Type 2019 & 2032
- Table 32: Global Functional Near-infrared Optical Brain Imaging Market Volume K Unit Forecast, by Application Type 2019 & 2032
- Table 33: Global Functional Near-infrared Optical Brain Imaging Market Revenue Million Forecast, by End-User 2019 & 2032
- Table 34: Global Functional Near-infrared Optical Brain Imaging Market Volume K Unit Forecast, by End-User 2019 & 2032
- Table 35: Global Functional Near-infrared Optical Brain Imaging Market Revenue Million Forecast, by Country 2019 & 2032
- Table 36: Global Functional Near-infrared Optical Brain Imaging Market Volume K Unit Forecast, by Country 2019 & 2032
- Table 37: Germany Functional Near-infrared Optical Brain Imaging Market Revenue (Million) Forecast, by Application 2019 & 2032
- Table 38: Germany Functional Near-infrared Optical Brain Imaging Market Volume (K Unit) Forecast, by Application 2019 & 2032
- Table 39: United Kingdom Functional Near-infrared Optical Brain Imaging Market Revenue (Million) Forecast, by Application 2019 & 2032
- Table 40: United Kingdom Functional Near-infrared Optical Brain Imaging Market Volume (K Unit) Forecast, by Application 2019 & 2032
- Table 41: France Functional Near-infrared Optical Brain Imaging Market Revenue (Million) Forecast, by Application 2019 & 2032
- Table 42: France Functional Near-infrared Optical Brain Imaging Market Volume (K Unit) Forecast, by Application 2019 & 2032
- Table 43: Italy Functional Near-infrared Optical Brain Imaging Market Revenue (Million) Forecast, by Application 2019 & 2032
- Table 44: Italy Functional Near-infrared Optical Brain Imaging Market Volume (K Unit) Forecast, by Application 2019 & 2032
- Table 45: Spain Functional Near-infrared Optical Brain Imaging Market Revenue (Million) Forecast, by Application 2019 & 2032
- Table 46: Spain Functional Near-infrared Optical Brain Imaging Market Volume (K Unit) Forecast, by Application 2019 & 2032
- Table 47: Rest of Europe Functional Near-infrared Optical Brain Imaging Market Revenue (Million) Forecast, by Application 2019 & 2032
- Table 48: Rest of Europe Functional Near-infrared Optical Brain Imaging Market Volume (K Unit) Forecast, by Application 2019 & 2032
- Table 49: Global Functional Near-infrared Optical Brain Imaging Market Revenue Million Forecast, by Application Type 2019 & 2032
- Table 50: Global Functional Near-infrared Optical Brain Imaging Market Volume K Unit Forecast, by Application Type 2019 & 2032
- Table 51: Global Functional Near-infrared Optical Brain Imaging Market Revenue Million Forecast, by End-User 2019 & 2032
- Table 52: Global Functional Near-infrared Optical Brain Imaging Market Volume K Unit Forecast, by End-User 2019 & 2032
- Table 53: Global Functional Near-infrared Optical Brain Imaging Market Revenue Million Forecast, by Country 2019 & 2032
- Table 54: Global Functional Near-infrared Optical Brain Imaging Market Volume K Unit Forecast, by Country 2019 & 2032
- Table 55: China Functional Near-infrared Optical Brain Imaging Market Revenue (Million) Forecast, by Application 2019 & 2032
- Table 56: China Functional Near-infrared Optical Brain Imaging Market Volume (K Unit) Forecast, by Application 2019 & 2032
- Table 57: Japan Functional Near-infrared Optical Brain Imaging Market Revenue (Million) Forecast, by Application 2019 & 2032
- Table 58: Japan Functional Near-infrared Optical Brain Imaging Market Volume (K Unit) Forecast, by Application 2019 & 2032
- Table 59: India Functional Near-infrared Optical Brain Imaging Market Revenue (Million) Forecast, by Application 2019 & 2032
- Table 60: India Functional Near-infrared Optical Brain Imaging Market Volume (K Unit) Forecast, by Application 2019 & 2032
- Table 61: Australia Functional Near-infrared Optical Brain Imaging Market Revenue (Million) Forecast, by Application 2019 & 2032
- Table 62: Australia Functional Near-infrared Optical Brain Imaging Market Volume (K Unit) Forecast, by Application 2019 & 2032
- Table 63: South Korea Functional Near-infrared Optical Brain Imaging Market Revenue (Million) Forecast, by Application 2019 & 2032
- Table 64: South Korea Functional Near-infrared Optical Brain Imaging Market Volume (K Unit) Forecast, by Application 2019 & 2032
- Table 65: Rest of Asia Pacific Functional Near-infrared Optical Brain Imaging Market Revenue (Million) Forecast, by Application 2019 & 2032
- Table 66: Rest of Asia Pacific Functional Near-infrared Optical Brain Imaging Market Volume (K Unit) Forecast, by Application 2019 & 2032
- Table 67: Global Functional Near-infrared Optical Brain Imaging Market Revenue Million Forecast, by Application Type 2019 & 2032
- Table 68: Global Functional Near-infrared Optical Brain Imaging Market Volume K Unit Forecast, by Application Type 2019 & 2032
- Table 69: Global Functional Near-infrared Optical Brain Imaging Market Revenue Million Forecast, by End-User 2019 & 2032
- Table 70: Global Functional Near-infrared Optical Brain Imaging Market Volume K Unit Forecast, by End-User 2019 & 2032
- Table 71: Global Functional Near-infrared Optical Brain Imaging Market Revenue Million Forecast, by Country 2019 & 2032
- Table 72: Global Functional Near-infrared Optical Brain Imaging Market Volume K Unit Forecast, by Country 2019 & 2032
- Table 73: GCC Functional Near-infrared Optical Brain Imaging Market Revenue (Million) Forecast, by Application 2019 & 2032
- Table 74: GCC Functional Near-infrared Optical Brain Imaging Market Volume (K Unit) Forecast, by Application 2019 & 2032
- Table 75: South Africa Functional Near-infrared Optical Brain Imaging Market Revenue (Million) Forecast, by Application 2019 & 2032
- Table 76: South Africa Functional Near-infrared Optical Brain Imaging Market Volume (K Unit) Forecast, by Application 2019 & 2032
- Table 77: Rest of Middle East and Africa Functional Near-infrared Optical Brain Imaging Market Revenue (Million) Forecast, by Application 2019 & 2032
- Table 78: Rest of Middle East and Africa Functional Near-infrared Optical Brain Imaging Market Volume (K Unit) Forecast, by Application 2019 & 2032
- Table 79: Global Functional Near-infrared Optical Brain Imaging Market Revenue Million Forecast, by Application Type 2019 & 2032
- Table 80: Global Functional Near-infrared Optical Brain Imaging Market Volume K Unit Forecast, by Application Type 2019 & 2032
- Table 81: Global Functional Near-infrared Optical Brain Imaging Market Revenue Million Forecast, by End-User 2019 & 2032
- Table 82: Global Functional Near-infrared Optical Brain Imaging Market Volume K Unit Forecast, by End-User 2019 & 2032
- Table 83: Global Functional Near-infrared Optical Brain Imaging Market Revenue Million Forecast, by Country 2019 & 2032
- Table 84: Global Functional Near-infrared Optical Brain Imaging Market Volume K Unit Forecast, by Country 2019 & 2032
- Table 85: Brazil Functional Near-infrared Optical Brain Imaging Market Revenue (Million) Forecast, by Application 2019 & 2032
- Table 86: Brazil Functional Near-infrared Optical Brain Imaging Market Volume (K Unit) Forecast, by Application 2019 & 2032
- Table 87: Argentina Functional Near-infrared Optical Brain Imaging Market Revenue (Million) Forecast, by Application 2019 & 2032
- Table 88: Argentina Functional Near-infrared Optical Brain Imaging Market Volume (K Unit) Forecast, by Application 2019 & 2032
- Table 89: Rest of South America Functional Near-infrared Optical Brain Imaging Market Revenue (Million) Forecast, by Application 2019 & 2032
- Table 90: Rest of South America Functional Near-infrared Optical Brain Imaging Market Volume (K Unit) Forecast, by Application 2019 & 2032
Frequently Asked Questions
1. What is the projected Compound Annual Growth Rate (CAGR) of the Functional Near-infrared Optical Brain Imaging Market?
The projected CAGR is approximately 5.65%.
2. Which companies are prominent players in the Functional Near-infrared Optical Brain Imaging Market?
Key companies in the market include NIRx Medical Technologies LLC, Biopac Systems Inc, Artinis Medical Systems, Oxford Instruments, Soterix Medical Inc, Gowerlabs Ltd, Fujifilm Holdings Corporation (Hitachi Ltd ), PerkinElmer Inc, Shimadzu Corporation.
3. What are the main segments of the Functional Near-infrared Optical Brain Imaging Market?
The market segments include Application Type, End-User.
4. Can you provide details about the market size?
The market size is estimated to be USD XX Million as of 2022.
5. What are some drivers contributing to market growth?
Rising Prevalence of Neurological Disorders; Emerging Trends in Products.
6. What are the notable trends driving market growth?
Traumatic Brain Injury Segment Expects to Register a Strong Growth in the Forecast Period.
7. Are there any restraints impacting market growth?
Lack of Skilled Professionals.
8. Can you provide examples of recent developments in the market?
March 2022: Kernel, a neurotechnology company, developed a wearable headset device, Kernel Flow, for brain measurement which was based on time-domain functional near-infrared spectroscopy (TD-fNIRS), which enables accurate, high-resolution measurement of the brain and its functions by emitting picosecond pulses of light into tissue and measuring the arrival times of single photons. The device weighs 2.05 kg and contains 52 modules arranged in four plates that fit on either side of the head.
9. What pricing options are available for accessing the report?
Pricing options include single-user, multi-user, and enterprise licenses priced at USD 4750, USD 5250, and USD 8750 respectively.
10. Is the market size provided in terms of value or volume?
The market size is provided in terms of value, measured in Million and volume, measured in K Unit.
11. Are there any specific market keywords associated with the report?
Yes, the market keyword associated with the report is "Functional Near-infrared Optical Brain Imaging Market," which aids in identifying and referencing the specific market segment covered.
12. How do I determine which pricing option suits my needs best?
The pricing options vary based on user requirements and access needs. Individual users may opt for single-user licenses, while businesses requiring broader access may choose multi-user or enterprise licenses for cost-effective access to the report.
13. Are there any additional resources or data provided in the Functional Near-infrared Optical Brain Imaging Market report?
While the report offers comprehensive insights, it's advisable to review the specific contents or supplementary materials provided to ascertain if additional resources or data are available.
14. How can I stay updated on further developments or reports in the Functional Near-infrared Optical Brain Imaging Market?
To stay informed about further developments, trends, and reports in the Functional Near-infrared Optical Brain Imaging Market, consider subscribing to industry newsletters, following relevant companies and organizations, or regularly checking reputable industry news sources and publications.
Methodology
Step 1 - Identification of Relevant Samples Size from Population Database


Step 2 - Approaches for Defining Global Market Size (Value, Volume* & Price*)

Note*: In applicable scenarios
Step 3 - Data Sources
Primary Research
- Web Analytics
- Survey Reports
- Research Institute
- Latest Research Reports
- Opinion Leaders
Secondary Research
- Annual Reports
- White Paper
- Latest Press Release
- Industry Association
- Paid Database
- Investor Presentations

Step 4 - Data Triangulation
Involves using different sources of information in order to increase the validity of a study
These sources are likely to be stakeholders in a program - participants, other researchers, program staff, other community members, and so on.
Then we put all data in single framework & apply various statistical tools to find out the dynamic on the market.
During the analysis stage, feedback from the stakeholder groups would be compared to determine areas of agreement as well as areas of divergence


