

Key Insights
The global fully automatic hemorheology analyzer market is poised for substantial growth, propelled by the escalating incidence of cardiovascular diseases and a growing demand for advanced diagnostic solutions in healthcare. The market is segmented by application, including biotechnology and pharmaceutical companies, hospitals and diagnostic laboratories, and research and academic institutions, and by throughput, with categories such as ≥40 tests/hr, ≥60 tests/hr, and others. Hospitals and diagnostic laboratories represent the largest segment, driven by the critical need for efficient and precise blood analysis in routine clinical diagnostics. The increasing integration of automated systems within these facilities is a primary market driver, as fully automatic analyzers significantly enhance accuracy, reduce turnaround times, and boost throughput compared to manual methods. Technological innovations, including the incorporation of artificial intelligence and refined data analysis capabilities, are further stimulating market expansion. While the substantial initial investment may present a challenge, the long-term advantages in operational efficiency and diagnostic precision are expected to outweigh this concern, particularly in high-volume clinical environments. North America and Europe currently command significant market share due to robust healthcare spending and advanced infrastructure. However, emerging economies in the Asia-Pacific region are experiencing rapid growth, attributed to improving healthcare infrastructure and heightened awareness of cardiovascular conditions. The market is projected to witness continued expansion through 2033, with an anticipated significant increase in market value driven by technological innovation, rising healthcare expenditure, and broader adoption in developing nations.
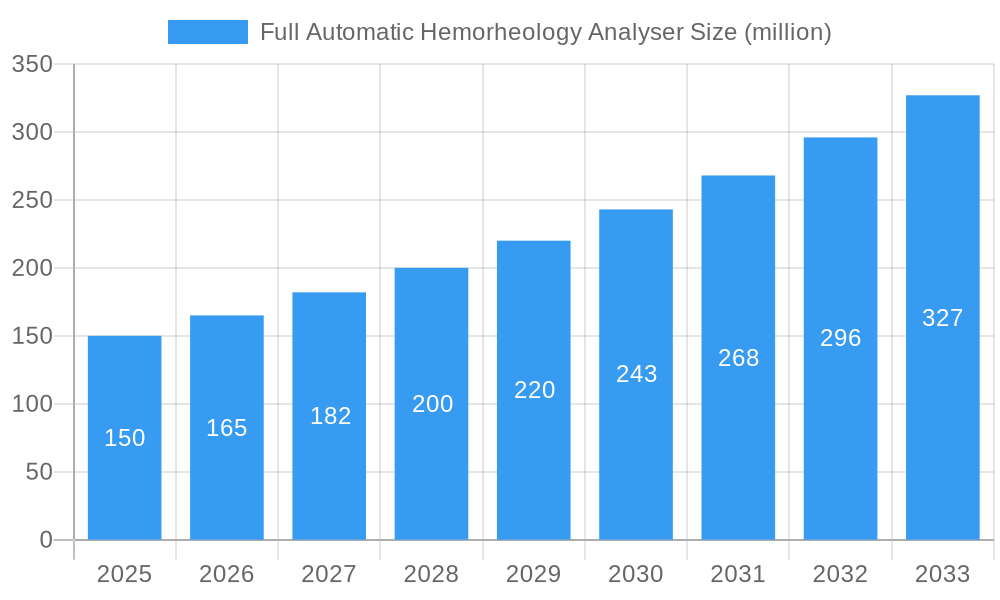
Full Automatic Hemorheology Analyser Market Size (In Billion)
The competitive landscape is characterized by a dynamic interplay of established market leaders and innovative emerging companies. Key strategies employed by major players include forming strategic partnerships, prioritizing technological advancements, and pursuing geographic expansion to solidify their market positions. The market anticipates increased consolidation in the coming years, with larger enterprises acquiring smaller entities to broaden their market reach and diversify their product offerings. Future market expansion will be influenced by several key factors, such as the development of novel diagnostic tests, the seamless integration of advanced analytics, and supportive government initiatives aimed at enhancing healthcare infrastructure. Sustained investment in research and development focused on improving analyzer accuracy, speed, and user-friendliness will further catalyze market growth. Moreover, a growing emphasis on point-of-care testing and telemedicine is expected to unlock new opportunities for the deployment of fully automatic hemorheology analyzers in remote and underserved communities.
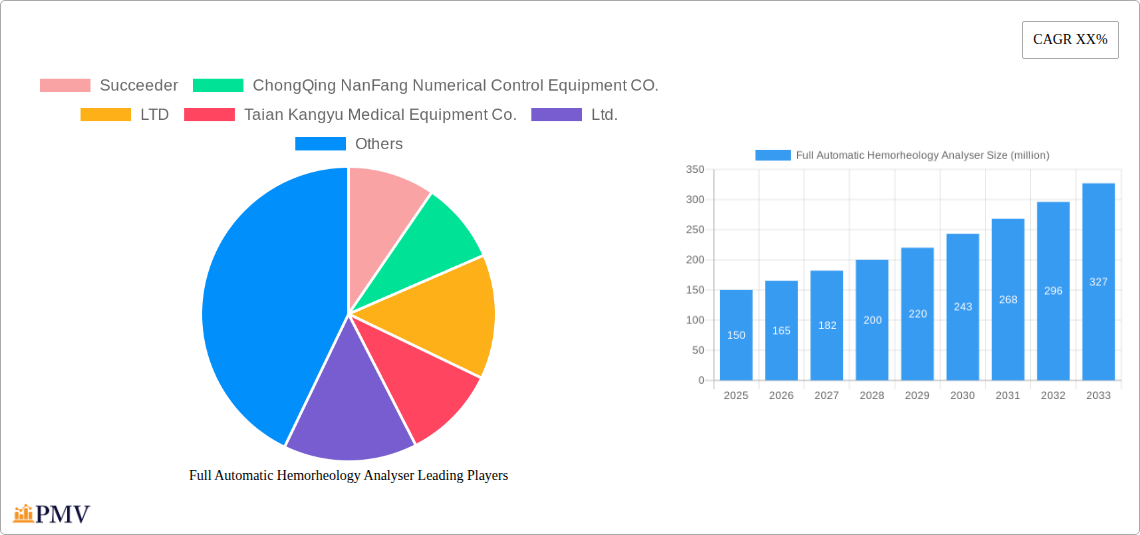
Full Automatic Hemorheology Analyser Company Market Share
Full Automatic Hemorheology Analyser Market Report: 2019-2033
This comprehensive report provides a detailed analysis of the global Full Automatic Hemorheology Analyser market, offering invaluable insights for stakeholders across the biotechnology, pharmaceutical, healthcare, and research sectors. The report covers the period 2019-2033, with a focus on the forecast period 2025-2033 and a base year of 2025. The market is segmented by application and testing capacity, providing a granular understanding of growth drivers, challenges, and competitive dynamics. With a market size projected to reach xx million by 2033, this report is a critical resource for strategic decision-making.
Full Automatic Hemorheology Analyser Market Structure & Competitive Dynamics
The global Full Automatic Hemorheology Analyser market exhibits a moderately concentrated structure, with a few major players holding significant market share. Succeeder, ChongQing NanFang Numerical Control Equipment CO.,LTD, Taian Kangyu Medical Equipment Co.,Ltd., and Beijing ZONCI Technology are among the key players, collectively accounting for an estimated xx million USD in revenue in 2025. Market concentration is influenced by factors such as technological advancements, regulatory approvals, and the intensity of competitive activity. Innovation ecosystems are dynamic, characterized by continuous R&D efforts focused on improving accuracy, speed, and automation of the analysers. Regulatory frameworks vary across regions, impacting market access and adoption rates. While currently limited, the potential for substitute technologies remains a consideration. End-user trends lean towards automation and higher throughput systems. M&A activity in the sector has been relatively low in the past five years, with an estimated total deal value of xx million USD during the historical period (2019-2024).
- Market Share (2025): Succeeder (xx%), ChongQing NanFang (xx%), Taian Kangyu (xx%), Beijing ZONCI (xx%), Others (xx%).
- M&A Deal Value (2019-2024): xx million USD
- Market Concentration Ratio (CR4, 2025): xx%
Full Automatic Hemorheology Analyser Industry Trends & Insights
The Full Automatic Hemorheology Analyser market is experiencing robust growth, driven by several key factors. The increasing prevalence of cardiovascular diseases and other blood-related disorders is a major driver, fueling demand for accurate and efficient diagnostic tools. Technological advancements, such as the incorporation of advanced sensors and sophisticated algorithms, are enhancing the accuracy and speed of analysis. The growing adoption of automation in healthcare settings is further contributing to the market's expansion. Consumer preferences are shifting towards faster turnaround times and user-friendly interfaces. Competitive dynamics are characterized by continuous innovation, strategic partnerships, and regional expansion. The market is projected to witness a compound annual growth rate (CAGR) of xx% during the forecast period (2025-2033), with market penetration expected to reach xx% by 2033.
Dominant Markets & Segments in Full Automatic Hemorheology Analyser
The North American region currently holds a dominant position in the Full Automatic Hemorheology Analyser market, driven by strong technological advancements, high healthcare expenditure, and significant investments in research and development. Within applications, Hospitals and Diagnostic Laboratories represent the largest segment, followed by Research and Academic Institutes. The segment of analysers with ≥60 tests/hr capacity demonstrates the fastest growth, reflecting the increasing demand for high-throughput solutions.
- Key Drivers for North American Dominance:
- High healthcare expenditure
- Strong regulatory framework supporting medical device adoption
- Robust presence of biotechnology and pharmaceutical companies
- Extensive R&D investments
- Dominant Segment: Hospitals and Diagnostic Laboratories, driven by the high volume of blood tests required for diagnosis and patient monitoring. The ≥60 tests/hr segment shows the fastest growth rate, fueled by the demand for higher throughput in large laboratories.
Full Automatic Hemorheology Analyser Product Innovations
Recent product innovations in the Full Automatic Hemorheology Analyser market have focused on enhancing automation, improving accuracy, and reducing testing times. Miniaturization of the devices is also an emerging trend, allowing for greater portability and accessibility. These advancements have broadened the applications of the technology and improved its market fit, particularly in point-of-care settings and resource-constrained environments. Manufacturers are incorporating advanced features like integrated data management systems and remote diagnostics to streamline workflows and improve overall efficiency.
Report Segmentation & Scope
This report segments the Full Automatic Hemorheology Analyser market based on application and testing capacity.
Application: Biotechnology and Pharmaceutical Companies, Hospitals and Diagnostic Laboratories, Research and Academic Institutes. The Hospitals and Diagnostic Laboratories segment is projected to maintain its dominance throughout the forecast period due to the high volume of tests required.
Type: ≥40 tests/hr, ≥60 tests/hr, Others. The ≥60 tests/hr segment is expected to exhibit the highest growth rate due to the demand for increased throughput and efficiency. Each segment is analyzed in terms of market size, growth rate, and competitive landscape.
Key Drivers of Full Automatic Hemorheology Analyser Growth
The growth of the Full Automatic Hemorheology Analyser market is propelled by several factors, including the rising prevalence of chronic diseases (like cardiovascular diseases and diabetes), the increasing demand for rapid and accurate diagnostics, technological advancements leading to enhanced accuracy and automation, and supportive government regulations promoting healthcare infrastructure development. Investment in R&D, particularly in point-of-care diagnostics, is also a significant growth driver.
Challenges in the Full Automatic Hemorheology Analyser Sector
The Full Automatic Hemorheology Analyser market faces challenges such as stringent regulatory approvals, particularly in new markets, the high initial investment costs associated with purchasing and maintaining these advanced systems, and the potential for supply chain disruptions impacting manufacturing and distribution. Competition from established players and the emergence of new technologies also pose challenges. These factors can impact the market's growth trajectory.
Leading Players in the Full Automatic Hemorheology Analyser Market
- Succeeder
- ChongQing NanFang Numerical Control Equipment CO.,LTD
- Taian Kangyu Medical Equipment Co.,Ltd.
- Beijing ZONCI Technology
Key Developments in Full Automatic Hemorheology Analyser Sector
- 2022 Q4: Succeeder launched a new generation of Full Automatic Hemorheology Analyser with improved accuracy and automation.
- 2023 Q1: Beijing ZONCI Technology announced a strategic partnership to expand its distribution network in Europe.
- 2024 Q2: Taian Kangyu Medical Equipment Co., Ltd. received regulatory approval for its new analyser in a major market. (Further developments are projected to occur but specific details are unavailable, xx)
Strategic Full Automatic Hemorheology Analyser Market Outlook
The Full Automatic Hemorheology Analyser market presents significant growth opportunities for companies that can adapt to the evolving demands of the healthcare sector. Focusing on technological innovation, strategic partnerships, and expansion into emerging markets will be key to success. Continued investment in R&D and the development of user-friendly, cost-effective systems will also be crucial for capturing market share in this dynamic and rapidly expanding market. The long-term outlook is positive, driven by the ongoing need for efficient and accurate blood analysis across various healthcare settings.
Full Automatic Hemorheology Analyser Segmentation
-
1. Application
- 1.1. Biotechnology and Pharmaceutical Companies
- 1.2. Hospitals and Diagnostic Laboratories
- 1.3. Research and Academic Institutes
-
2. Types
- 2.1. ≥40 tests/hr
- 2.2. ≥60 tests/hr
- 2.3. Others
Full Automatic Hemorheology Analyser Segmentation By Geography
-
1. North America
- 1.1. United States
- 1.2. Canada
- 1.3. Mexico
-
2. South America
- 2.1. Brazil
- 2.2. Argentina
- 2.3. Rest of South America
-
3. Europe
- 3.1. United Kingdom
- 3.2. Germany
- 3.3. France
- 3.4. Italy
- 3.5. Spain
- 3.6. Russia
- 3.7. Benelux
- 3.8. Nordics
- 3.9. Rest of Europe
-
4. Middle East & Africa
- 4.1. Turkey
- 4.2. Israel
- 4.3. GCC
- 4.4. North Africa
- 4.5. South Africa
- 4.6. Rest of Middle East & Africa
-
5. Asia Pacific
- 5.1. China
- 5.2. India
- 5.3. Japan
- 5.4. South Korea
- 5.5. ASEAN
- 5.6. Oceania
- 5.7. Rest of Asia Pacific

Full Automatic Hemorheology Analyser Regional Market Share
Geographic Coverage of Full Automatic Hemorheology Analyser
Full Automatic Hemorheology Analyser REPORT HIGHLIGHTS
| Aspects | Details |
|---|---|
| Study Period | 2020-2034 |
| Base Year | 2025 |
| Estimated Year | 2026 |
| Forecast Period | 2026-2034 |
| Historical Period | 2020-2025 |
| Growth Rate | CAGR of 4.9% from 2020-2034 |
| Segmentation |
|
Table of Contents
- 1. Introduction
- 1.1. Research Scope
- 1.2. Market Segmentation
- 1.3. Research Objective
- 1.4. Definitions and Assumptions
- 2. Executive Summary
- 2.1. Market Snapshot
- 3. Market Dynamics
- 3.1. Market Drivers
- 3.2. Market Restrains
- 3.3. Market Trends
- 3.4. Market Opportunities
- 4. Market Factor Analysis
- 4.1. Porters Five Forces
- 4.1.1. Bargaining Power of Suppliers
- 4.1.2. Bargaining Power of Buyers
- 4.1.3. Threat of New Entrants
- 4.1.4. Threat of Substitutes
- 4.1.5. Competitive Rivalry
- 4.2. PESTEL analysis
- 4.3. BCG Analysis
- 4.3.1. Stars (High Growth, High Market Share)
- 4.3.2. Cash Cows (Low Growth, High Market Share)
- 4.3.3. Question Mark (High Growth, Low Market Share)
- 4.3.4. Dogs (Low Growth, Low Market Share)
- 4.4. Ansoff Matrix Analysis
- 4.5. Supply Chain Analysis
- 4.6. Regulatory Landscape
- 4.7. Current Market Potential and Opportunity Assessment (TAM–SAM–SOM Framework)
- 4.8. PMV Analyst Note
- 4.1. Porters Five Forces
- 5. Market Analysis, Insights and Forecast 2021-2033
- 5.1. Market Analysis, Insights and Forecast - by Application
- 5.1.1. Biotechnology and Pharmaceutical Companies
- 5.1.2. Hospitals and Diagnostic Laboratories
- 5.1.3. Research and Academic Institutes
- 5.2. Market Analysis, Insights and Forecast - by Types
- 5.2.1. ≥40 tests/hr
- 5.2.2. ≥60 tests/hr
- 5.2.3. Others
- 5.3. Market Analysis, Insights and Forecast - by Region
- 5.3.1. North America
- 5.3.2. South America
- 5.3.3. Europe
- 5.3.4. Middle East & Africa
- 5.3.5. Asia Pacific
- 5.1. Market Analysis, Insights and Forecast - by Application
- 6. Global Full Automatic Hemorheology Analyser Analysis, Insights and Forecast, 2021-2033
- 6.1. Market Analysis, Insights and Forecast - by Application
- 6.1.1. Biotechnology and Pharmaceutical Companies
- 6.1.2. Hospitals and Diagnostic Laboratories
- 6.1.3. Research and Academic Institutes
- 6.2. Market Analysis, Insights and Forecast - by Types
- 6.2.1. ≥40 tests/hr
- 6.2.2. ≥60 tests/hr
- 6.2.3. Others
- 6.1. Market Analysis, Insights and Forecast - by Application
- 7. North America Full Automatic Hemorheology Analyser Analysis, Insights and Forecast, 2020-2032
- 7.1. Market Analysis, Insights and Forecast - by Application
- 7.1.1. Biotechnology and Pharmaceutical Companies
- 7.1.2. Hospitals and Diagnostic Laboratories
- 7.1.3. Research and Academic Institutes
- 7.2. Market Analysis, Insights and Forecast - by Types
- 7.2.1. ≥40 tests/hr
- 7.2.2. ≥60 tests/hr
- 7.2.3. Others
- 7.1. Market Analysis, Insights and Forecast - by Application
- 8. South America Full Automatic Hemorheology Analyser Analysis, Insights and Forecast, 2020-2032
- 8.1. Market Analysis, Insights and Forecast - by Application
- 8.1.1. Biotechnology and Pharmaceutical Companies
- 8.1.2. Hospitals and Diagnostic Laboratories
- 8.1.3. Research and Academic Institutes
- 8.2. Market Analysis, Insights and Forecast - by Types
- 8.2.1. ≥40 tests/hr
- 8.2.2. ≥60 tests/hr
- 8.2.3. Others
- 8.1. Market Analysis, Insights and Forecast - by Application
- 9. Europe Full Automatic Hemorheology Analyser Analysis, Insights and Forecast, 2020-2032
- 9.1. Market Analysis, Insights and Forecast - by Application
- 9.1.1. Biotechnology and Pharmaceutical Companies
- 9.1.2. Hospitals and Diagnostic Laboratories
- 9.1.3. Research and Academic Institutes
- 9.2. Market Analysis, Insights and Forecast - by Types
- 9.2.1. ≥40 tests/hr
- 9.2.2. ≥60 tests/hr
- 9.2.3. Others
- 9.1. Market Analysis, Insights and Forecast - by Application
- 10. Middle East & Africa Full Automatic Hemorheology Analyser Analysis, Insights and Forecast, 2020-2032
- 10.1. Market Analysis, Insights and Forecast - by Application
- 10.1.1. Biotechnology and Pharmaceutical Companies
- 10.1.2. Hospitals and Diagnostic Laboratories
- 10.1.3. Research and Academic Institutes
- 10.2. Market Analysis, Insights and Forecast - by Types
- 10.2.1. ≥40 tests/hr
- 10.2.2. ≥60 tests/hr
- 10.2.3. Others
- 10.1. Market Analysis, Insights and Forecast - by Application
- 11. Asia Pacific Full Automatic Hemorheology Analyser Analysis, Insights and Forecast, 2020-2032
- 11.1. Market Analysis, Insights and Forecast - by Application
- 11.1.1. Biotechnology and Pharmaceutical Companies
- 11.1.2. Hospitals and Diagnostic Laboratories
- 11.1.3. Research and Academic Institutes
- 11.2. Market Analysis, Insights and Forecast - by Types
- 11.2.1. ≥40 tests/hr
- 11.2.2. ≥60 tests/hr
- 11.2.3. Others
- 11.1. Market Analysis, Insights and Forecast - by Application
- 12. Competitive Analysis
- 12.1. Company Profiles
- 12.1.1 Succeeder
- 12.1.1.1. Company Overview
- 12.1.1.2. Products
- 12.1.1.3. Company Financials
- 12.1.1.4. SWOT Analysis
- 12.1.2 ChongQing NanFang Numerical Control Equipment CO.
- 12.1.2.1. Company Overview
- 12.1.2.2. Products
- 12.1.2.3. Company Financials
- 12.1.2.4. SWOT Analysis
- 12.1.3 LTD
- 12.1.3.1. Company Overview
- 12.1.3.2. Products
- 12.1.3.3. Company Financials
- 12.1.3.4. SWOT Analysis
- 12.1.4 Taian Kangyu Medical Equipment Co.
- 12.1.4.1. Company Overview
- 12.1.4.2. Products
- 12.1.4.3. Company Financials
- 12.1.4.4. SWOT Analysis
- 12.1.5 Ltd.
- 12.1.5.1. Company Overview
- 12.1.5.2. Products
- 12.1.5.3. Company Financials
- 12.1.5.4. SWOT Analysis
- 12.1.6 Beijing ZONCI Technology
- 12.1.6.1. Company Overview
- 12.1.6.2. Products
- 12.1.6.3. Company Financials
- 12.1.6.4. SWOT Analysis
- 12.1.1 Succeeder
- 12.2. Market Entropy
- 12.2.1 Company's Key Areas Served
- 12.2.2 Recent Developments
- 12.3. Company Market Share Analysis 2025
- 12.3.1 Top 5 Companies Market Share Analysis
- 12.3.2 Top 3 Companies Market Share Analysis
- 12.4. List of Potential Customers
- 13. Research Methodology
List of Figures
- Figure 1: Global Full Automatic Hemorheology Analyser Revenue Breakdown (million, %) by Region 2025 & 2033
- Figure 2: Global Full Automatic Hemorheology Analyser Volume Breakdown (K, %) by Region 2025 & 2033
- Figure 3: North America Full Automatic Hemorheology Analyser Revenue (million), by Application 2025 & 2033
- Figure 4: North America Full Automatic Hemorheology Analyser Volume (K), by Application 2025 & 2033
- Figure 5: North America Full Automatic Hemorheology Analyser Revenue Share (%), by Application 2025 & 2033
- Figure 6: North America Full Automatic Hemorheology Analyser Volume Share (%), by Application 2025 & 2033
- Figure 7: North America Full Automatic Hemorheology Analyser Revenue (million), by Types 2025 & 2033
- Figure 8: North America Full Automatic Hemorheology Analyser Volume (K), by Types 2025 & 2033
- Figure 9: North America Full Automatic Hemorheology Analyser Revenue Share (%), by Types 2025 & 2033
- Figure 10: North America Full Automatic Hemorheology Analyser Volume Share (%), by Types 2025 & 2033
- Figure 11: North America Full Automatic Hemorheology Analyser Revenue (million), by Country 2025 & 2033
- Figure 12: North America Full Automatic Hemorheology Analyser Volume (K), by Country 2025 & 2033
- Figure 13: North America Full Automatic Hemorheology Analyser Revenue Share (%), by Country 2025 & 2033
- Figure 14: North America Full Automatic Hemorheology Analyser Volume Share (%), by Country 2025 & 2033
- Figure 15: South America Full Automatic Hemorheology Analyser Revenue (million), by Application 2025 & 2033
- Figure 16: South America Full Automatic Hemorheology Analyser Volume (K), by Application 2025 & 2033
- Figure 17: South America Full Automatic Hemorheology Analyser Revenue Share (%), by Application 2025 & 2033
- Figure 18: South America Full Automatic Hemorheology Analyser Volume Share (%), by Application 2025 & 2033
- Figure 19: South America Full Automatic Hemorheology Analyser Revenue (million), by Types 2025 & 2033
- Figure 20: South America Full Automatic Hemorheology Analyser Volume (K), by Types 2025 & 2033
- Figure 21: South America Full Automatic Hemorheology Analyser Revenue Share (%), by Types 2025 & 2033
- Figure 22: South America Full Automatic Hemorheology Analyser Volume Share (%), by Types 2025 & 2033
- Figure 23: South America Full Automatic Hemorheology Analyser Revenue (million), by Country 2025 & 2033
- Figure 24: South America Full Automatic Hemorheology Analyser Volume (K), by Country 2025 & 2033
- Figure 25: South America Full Automatic Hemorheology Analyser Revenue Share (%), by Country 2025 & 2033
- Figure 26: South America Full Automatic Hemorheology Analyser Volume Share (%), by Country 2025 & 2033
- Figure 27: Europe Full Automatic Hemorheology Analyser Revenue (million), by Application 2025 & 2033
- Figure 28: Europe Full Automatic Hemorheology Analyser Volume (K), by Application 2025 & 2033
- Figure 29: Europe Full Automatic Hemorheology Analyser Revenue Share (%), by Application 2025 & 2033
- Figure 30: Europe Full Automatic Hemorheology Analyser Volume Share (%), by Application 2025 & 2033
- Figure 31: Europe Full Automatic Hemorheology Analyser Revenue (million), by Types 2025 & 2033
- Figure 32: Europe Full Automatic Hemorheology Analyser Volume (K), by Types 2025 & 2033
- Figure 33: Europe Full Automatic Hemorheology Analyser Revenue Share (%), by Types 2025 & 2033
- Figure 34: Europe Full Automatic Hemorheology Analyser Volume Share (%), by Types 2025 & 2033
- Figure 35: Europe Full Automatic Hemorheology Analyser Revenue (million), by Country 2025 & 2033
- Figure 36: Europe Full Automatic Hemorheology Analyser Volume (K), by Country 2025 & 2033
- Figure 37: Europe Full Automatic Hemorheology Analyser Revenue Share (%), by Country 2025 & 2033
- Figure 38: Europe Full Automatic Hemorheology Analyser Volume Share (%), by Country 2025 & 2033
- Figure 39: Middle East & Africa Full Automatic Hemorheology Analyser Revenue (million), by Application 2025 & 2033
- Figure 40: Middle East & Africa Full Automatic Hemorheology Analyser Volume (K), by Application 2025 & 2033
- Figure 41: Middle East & Africa Full Automatic Hemorheology Analyser Revenue Share (%), by Application 2025 & 2033
- Figure 42: Middle East & Africa Full Automatic Hemorheology Analyser Volume Share (%), by Application 2025 & 2033
- Figure 43: Middle East & Africa Full Automatic Hemorheology Analyser Revenue (million), by Types 2025 & 2033
- Figure 44: Middle East & Africa Full Automatic Hemorheology Analyser Volume (K), by Types 2025 & 2033
- Figure 45: Middle East & Africa Full Automatic Hemorheology Analyser Revenue Share (%), by Types 2025 & 2033
- Figure 46: Middle East & Africa Full Automatic Hemorheology Analyser Volume Share (%), by Types 2025 & 2033
- Figure 47: Middle East & Africa Full Automatic Hemorheology Analyser Revenue (million), by Country 2025 & 2033
- Figure 48: Middle East & Africa Full Automatic Hemorheology Analyser Volume (K), by Country 2025 & 2033
- Figure 49: Middle East & Africa Full Automatic Hemorheology Analyser Revenue Share (%), by Country 2025 & 2033
- Figure 50: Middle East & Africa Full Automatic Hemorheology Analyser Volume Share (%), by Country 2025 & 2033
- Figure 51: Asia Pacific Full Automatic Hemorheology Analyser Revenue (million), by Application 2025 & 2033
- Figure 52: Asia Pacific Full Automatic Hemorheology Analyser Volume (K), by Application 2025 & 2033
- Figure 53: Asia Pacific Full Automatic Hemorheology Analyser Revenue Share (%), by Application 2025 & 2033
- Figure 54: Asia Pacific Full Automatic Hemorheology Analyser Volume Share (%), by Application 2025 & 2033
- Figure 55: Asia Pacific Full Automatic Hemorheology Analyser Revenue (million), by Types 2025 & 2033
- Figure 56: Asia Pacific Full Automatic Hemorheology Analyser Volume (K), by Types 2025 & 2033
- Figure 57: Asia Pacific Full Automatic Hemorheology Analyser Revenue Share (%), by Types 2025 & 2033
- Figure 58: Asia Pacific Full Automatic Hemorheology Analyser Volume Share (%), by Types 2025 & 2033
- Figure 59: Asia Pacific Full Automatic Hemorheology Analyser Revenue (million), by Country 2025 & 2033
- Figure 60: Asia Pacific Full Automatic Hemorheology Analyser Volume (K), by Country 2025 & 2033
- Figure 61: Asia Pacific Full Automatic Hemorheology Analyser Revenue Share (%), by Country 2025 & 2033
- Figure 62: Asia Pacific Full Automatic Hemorheology Analyser Volume Share (%), by Country 2025 & 2033
List of Tables
- Table 1: Global Full Automatic Hemorheology Analyser Revenue million Forecast, by Application 2020 & 2033
- Table 2: Global Full Automatic Hemorheology Analyser Volume K Forecast, by Application 2020 & 2033
- Table 3: Global Full Automatic Hemorheology Analyser Revenue million Forecast, by Types 2020 & 2033
- Table 4: Global Full Automatic Hemorheology Analyser Volume K Forecast, by Types 2020 & 2033
- Table 5: Global Full Automatic Hemorheology Analyser Revenue million Forecast, by Region 2020 & 2033
- Table 6: Global Full Automatic Hemorheology Analyser Volume K Forecast, by Region 2020 & 2033
- Table 7: Global Full Automatic Hemorheology Analyser Revenue million Forecast, by Application 2020 & 2033
- Table 8: Global Full Automatic Hemorheology Analyser Volume K Forecast, by Application 2020 & 2033
- Table 9: Global Full Automatic Hemorheology Analyser Revenue million Forecast, by Types 2020 & 2033
- Table 10: Global Full Automatic Hemorheology Analyser Volume K Forecast, by Types 2020 & 2033
- Table 11: Global Full Automatic Hemorheology Analyser Revenue million Forecast, by Country 2020 & 2033
- Table 12: Global Full Automatic Hemorheology Analyser Volume K Forecast, by Country 2020 & 2033
- Table 13: United States Full Automatic Hemorheology Analyser Revenue (million) Forecast, by Application 2020 & 2033
- Table 14: United States Full Automatic Hemorheology Analyser Volume (K) Forecast, by Application 2020 & 2033
- Table 15: Canada Full Automatic Hemorheology Analyser Revenue (million) Forecast, by Application 2020 & 2033
- Table 16: Canada Full Automatic Hemorheology Analyser Volume (K) Forecast, by Application 2020 & 2033
- Table 17: Mexico Full Automatic Hemorheology Analyser Revenue (million) Forecast, by Application 2020 & 2033
- Table 18: Mexico Full Automatic Hemorheology Analyser Volume (K) Forecast, by Application 2020 & 2033
- Table 19: Global Full Automatic Hemorheology Analyser Revenue million Forecast, by Application 2020 & 2033
- Table 20: Global Full Automatic Hemorheology Analyser Volume K Forecast, by Application 2020 & 2033
- Table 21: Global Full Automatic Hemorheology Analyser Revenue million Forecast, by Types 2020 & 2033
- Table 22: Global Full Automatic Hemorheology Analyser Volume K Forecast, by Types 2020 & 2033
- Table 23: Global Full Automatic Hemorheology Analyser Revenue million Forecast, by Country 2020 & 2033
- Table 24: Global Full Automatic Hemorheology Analyser Volume K Forecast, by Country 2020 & 2033
- Table 25: Brazil Full Automatic Hemorheology Analyser Revenue (million) Forecast, by Application 2020 & 2033
- Table 26: Brazil Full Automatic Hemorheology Analyser Volume (K) Forecast, by Application 2020 & 2033
- Table 27: Argentina Full Automatic Hemorheology Analyser Revenue (million) Forecast, by Application 2020 & 2033
- Table 28: Argentina Full Automatic Hemorheology Analyser Volume (K) Forecast, by Application 2020 & 2033
- Table 29: Rest of South America Full Automatic Hemorheology Analyser Revenue (million) Forecast, by Application 2020 & 2033
- Table 30: Rest of South America Full Automatic Hemorheology Analyser Volume (K) Forecast, by Application 2020 & 2033
- Table 31: Global Full Automatic Hemorheology Analyser Revenue million Forecast, by Application 2020 & 2033
- Table 32: Global Full Automatic Hemorheology Analyser Volume K Forecast, by Application 2020 & 2033
- Table 33: Global Full Automatic Hemorheology Analyser Revenue million Forecast, by Types 2020 & 2033
- Table 34: Global Full Automatic Hemorheology Analyser Volume K Forecast, by Types 2020 & 2033
- Table 35: Global Full Automatic Hemorheology Analyser Revenue million Forecast, by Country 2020 & 2033
- Table 36: Global Full Automatic Hemorheology Analyser Volume K Forecast, by Country 2020 & 2033
- Table 37: United Kingdom Full Automatic Hemorheology Analyser Revenue (million) Forecast, by Application 2020 & 2033
- Table 38: United Kingdom Full Automatic Hemorheology Analyser Volume (K) Forecast, by Application 2020 & 2033
- Table 39: Germany Full Automatic Hemorheology Analyser Revenue (million) Forecast, by Application 2020 & 2033
- Table 40: Germany Full Automatic Hemorheology Analyser Volume (K) Forecast, by Application 2020 & 2033
- Table 41: France Full Automatic Hemorheology Analyser Revenue (million) Forecast, by Application 2020 & 2033
- Table 42: France Full Automatic Hemorheology Analyser Volume (K) Forecast, by Application 2020 & 2033
- Table 43: Italy Full Automatic Hemorheology Analyser Revenue (million) Forecast, by Application 2020 & 2033
- Table 44: Italy Full Automatic Hemorheology Analyser Volume (K) Forecast, by Application 2020 & 2033
- Table 45: Spain Full Automatic Hemorheology Analyser Revenue (million) Forecast, by Application 2020 & 2033
- Table 46: Spain Full Automatic Hemorheology Analyser Volume (K) Forecast, by Application 2020 & 2033
- Table 47: Russia Full Automatic Hemorheology Analyser Revenue (million) Forecast, by Application 2020 & 2033
- Table 48: Russia Full Automatic Hemorheology Analyser Volume (K) Forecast, by Application 2020 & 2033
- Table 49: Benelux Full Automatic Hemorheology Analyser Revenue (million) Forecast, by Application 2020 & 2033
- Table 50: Benelux Full Automatic Hemorheology Analyser Volume (K) Forecast, by Application 2020 & 2033
- Table 51: Nordics Full Automatic Hemorheology Analyser Revenue (million) Forecast, by Application 2020 & 2033
- Table 52: Nordics Full Automatic Hemorheology Analyser Volume (K) Forecast, by Application 2020 & 2033
- Table 53: Rest of Europe Full Automatic Hemorheology Analyser Revenue (million) Forecast, by Application 2020 & 2033
- Table 54: Rest of Europe Full Automatic Hemorheology Analyser Volume (K) Forecast, by Application 2020 & 2033
- Table 55: Global Full Automatic Hemorheology Analyser Revenue million Forecast, by Application 2020 & 2033
- Table 56: Global Full Automatic Hemorheology Analyser Volume K Forecast, by Application 2020 & 2033
- Table 57: Global Full Automatic Hemorheology Analyser Revenue million Forecast, by Types 2020 & 2033
- Table 58: Global Full Automatic Hemorheology Analyser Volume K Forecast, by Types 2020 & 2033
- Table 59: Global Full Automatic Hemorheology Analyser Revenue million Forecast, by Country 2020 & 2033
- Table 60: Global Full Automatic Hemorheology Analyser Volume K Forecast, by Country 2020 & 2033
- Table 61: Turkey Full Automatic Hemorheology Analyser Revenue (million) Forecast, by Application 2020 & 2033
- Table 62: Turkey Full Automatic Hemorheology Analyser Volume (K) Forecast, by Application 2020 & 2033
- Table 63: Israel Full Automatic Hemorheology Analyser Revenue (million) Forecast, by Application 2020 & 2033
- Table 64: Israel Full Automatic Hemorheology Analyser Volume (K) Forecast, by Application 2020 & 2033
- Table 65: GCC Full Automatic Hemorheology Analyser Revenue (million) Forecast, by Application 2020 & 2033
- Table 66: GCC Full Automatic Hemorheology Analyser Volume (K) Forecast, by Application 2020 & 2033
- Table 67: North Africa Full Automatic Hemorheology Analyser Revenue (million) Forecast, by Application 2020 & 2033
- Table 68: North Africa Full Automatic Hemorheology Analyser Volume (K) Forecast, by Application 2020 & 2033
- Table 69: South Africa Full Automatic Hemorheology Analyser Revenue (million) Forecast, by Application 2020 & 2033
- Table 70: South Africa Full Automatic Hemorheology Analyser Volume (K) Forecast, by Application 2020 & 2033
- Table 71: Rest of Middle East & Africa Full Automatic Hemorheology Analyser Revenue (million) Forecast, by Application 2020 & 2033
- Table 72: Rest of Middle East & Africa Full Automatic Hemorheology Analyser Volume (K) Forecast, by Application 2020 & 2033
- Table 73: Global Full Automatic Hemorheology Analyser Revenue million Forecast, by Application 2020 & 2033
- Table 74: Global Full Automatic Hemorheology Analyser Volume K Forecast, by Application 2020 & 2033
- Table 75: Global Full Automatic Hemorheology Analyser Revenue million Forecast, by Types 2020 & 2033
- Table 76: Global Full Automatic Hemorheology Analyser Volume K Forecast, by Types 2020 & 2033
- Table 77: Global Full Automatic Hemorheology Analyser Revenue million Forecast, by Country 2020 & 2033
- Table 78: Global Full Automatic Hemorheology Analyser Volume K Forecast, by Country 2020 & 2033
- Table 79: China Full Automatic Hemorheology Analyser Revenue (million) Forecast, by Application 2020 & 2033
- Table 80: China Full Automatic Hemorheology Analyser Volume (K) Forecast, by Application 2020 & 2033
- Table 81: India Full Automatic Hemorheology Analyser Revenue (million) Forecast, by Application 2020 & 2033
- Table 82: India Full Automatic Hemorheology Analyser Volume (K) Forecast, by Application 2020 & 2033
- Table 83: Japan Full Automatic Hemorheology Analyser Revenue (million) Forecast, by Application 2020 & 2033
- Table 84: Japan Full Automatic Hemorheology Analyser Volume (K) Forecast, by Application 2020 & 2033
- Table 85: South Korea Full Automatic Hemorheology Analyser Revenue (million) Forecast, by Application 2020 & 2033
- Table 86: South Korea Full Automatic Hemorheology Analyser Volume (K) Forecast, by Application 2020 & 2033
- Table 87: ASEAN Full Automatic Hemorheology Analyser Revenue (million) Forecast, by Application 2020 & 2033
- Table 88: ASEAN Full Automatic Hemorheology Analyser Volume (K) Forecast, by Application 2020 & 2033
- Table 89: Oceania Full Automatic Hemorheology Analyser Revenue (million) Forecast, by Application 2020 & 2033
- Table 90: Oceania Full Automatic Hemorheology Analyser Volume (K) Forecast, by Application 2020 & 2033
- Table 91: Rest of Asia Pacific Full Automatic Hemorheology Analyser Revenue (million) Forecast, by Application 2020 & 2033
- Table 92: Rest of Asia Pacific Full Automatic Hemorheology Analyser Volume (K) Forecast, by Application 2020 & 2033
Frequently Asked Questions
1. What is the projected Compound Annual Growth Rate (CAGR) of the Full Automatic Hemorheology Analyser?
The projected CAGR is approximately 4.9%.
2. Which companies are prominent players in the Full Automatic Hemorheology Analyser?
Key companies in the market include Succeeder, ChongQing NanFang Numerical Control Equipment CO., LTD, Taian Kangyu Medical Equipment Co., Ltd., Beijing ZONCI Technology.
3. What are the main segments of the Full Automatic Hemorheology Analyser?
The market segments include Application, Types.
4. Can you provide details about the market size?
The market size is estimated to be USD 3633 million as of 2022.
5. What are some drivers contributing to market growth?
N/A
6. What are the notable trends driving market growth?
N/A
7. Are there any restraints impacting market growth?
N/A
8. Can you provide examples of recent developments in the market?
N/A
9. What pricing options are available for accessing the report?
Pricing options include single-user, multi-user, and enterprise licenses priced at USD 3350.00, USD 5025.00, and USD 6700.00 respectively.
10. Is the market size provided in terms of value or volume?
The market size is provided in terms of value, measured in million and volume, measured in K.
11. Are there any specific market keywords associated with the report?
Yes, the market keyword associated with the report is "Full Automatic Hemorheology Analyser," which aids in identifying and referencing the specific market segment covered.
12. How do I determine which pricing option suits my needs best?
The pricing options vary based on user requirements and access needs. Individual users may opt for single-user licenses, while businesses requiring broader access may choose multi-user or enterprise licenses for cost-effective access to the report.
13. Are there any additional resources or data provided in the Full Automatic Hemorheology Analyser report?
While the report offers comprehensive insights, it's advisable to review the specific contents or supplementary materials provided to ascertain if additional resources or data are available.
14. How can I stay updated on further developments or reports in the Full Automatic Hemorheology Analyser?
To stay informed about further developments, trends, and reports in the Full Automatic Hemorheology Analyser, consider subscribing to industry newsletters, following relevant companies and organizations, or regularly checking reputable industry news sources and publications.
Methodology
Step 1 - Identification of Relevant Samples Size from Population Database


Step 2 - Approaches for Defining Global Market Size (Value, Volume* & Price*)

Note*: In applicable scenarios
Step 3 - Data Sources
Primary Research
- Web Analytics
- Survey Reports
- Research Institute
- Latest Research Reports
- Opinion Leaders
Secondary Research
- Annual Reports
- White Paper
- Latest Press Release
- Industry Association
- Paid Database
- Investor Presentations

Step 4 - Data Triangulation
Involves using different sources of information in order to increase the validity of a study
These sources are likely to be stakeholders in a program - participants, other researchers, program staff, other community members, and so on.
Then we put all data in single framework & apply various statistical tools to find out the dynamic on the market.
During the analysis stage, feedback from the stakeholder groups would be compared to determine areas of agreement as well as areas of divergence