


Key Insights
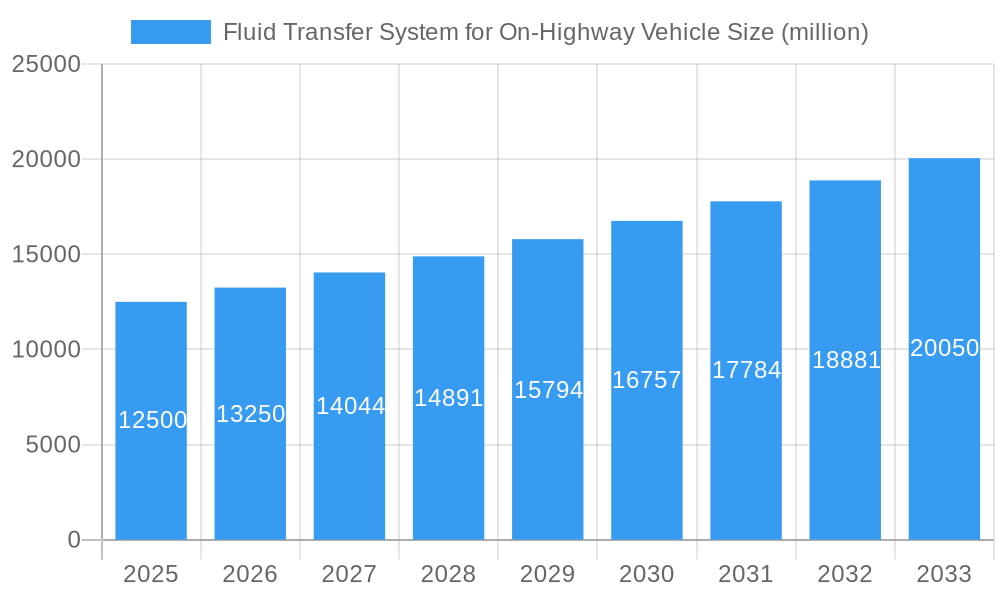
The global market for Fluid Transfer Systems for On-Highway Vehicles is projected to experience robust growth, driven by increasing production of passenger cars, light commercial vehicles, trucks, and buses. An estimated market size of $12,500 million in 2025 is expected to expand significantly, fueled by the automotive industry's ongoing demand for efficient and reliable fluid management solutions. Key growth drivers include advancements in vehicle technology, such as the adoption of sophisticated engine cooling systems, advanced braking mechanisms, and sophisticated power steering, all of which rely heavily on advanced fluid transfer components like hoses and tubing. Furthermore, the rising global vehicle parc and the continuous replacement of older vehicles will sustain demand for these essential components. Emerging economies, particularly in Asia Pacific and South America, are anticipated to contribute substantially to market expansion due to increasing vehicle ownership and the growth of their respective automotive manufacturing sectors.
Fluid Transfer System for On-Highway Vehicle Market Size (In Billion)

The market dynamics are shaped by several key trends. The increasing emphasis on fuel efficiency and reduced emissions is pushing manufacturers to develop lighter, more durable, and higher-performing fluid transfer systems. This includes the growing adoption of advanced materials and innovative designs in hoses and tubing to withstand higher operating pressures and temperatures. However, the market also faces restraints, such as the volatility in raw material prices, particularly for rubber and plastics, which can impact manufacturing costs and profit margins. Intense competition among established players and emerging manufacturers also presents a challenge, necessitating continuous innovation and cost optimization strategies. Despite these challenges, the market is poised for sustained expansion, with technological advancements and evolving regulatory landscapes expected to create new opportunities for growth and innovation in the fluid transfer systems sector for on-highway vehicles.
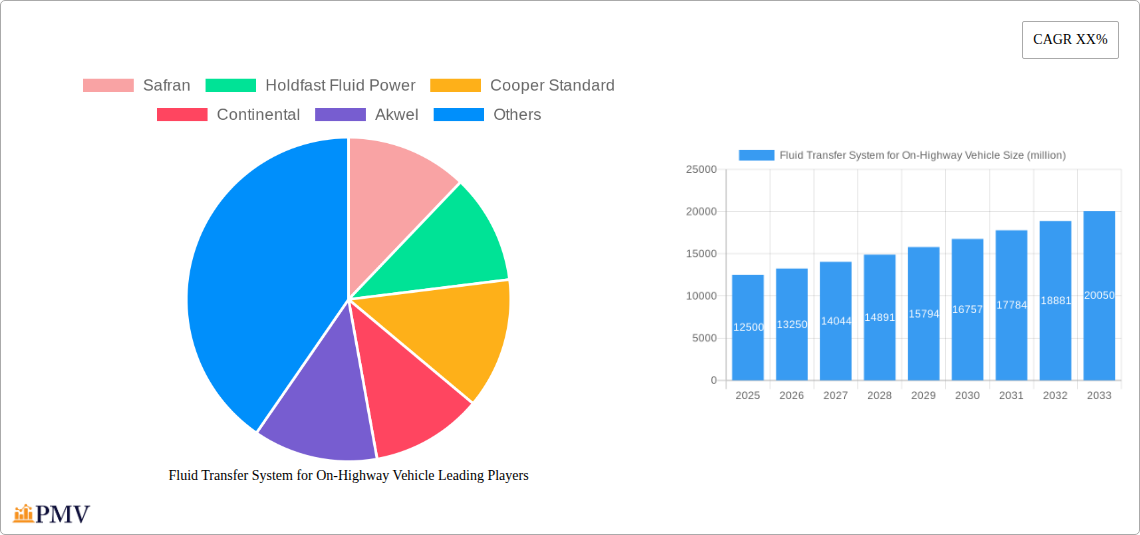
Fluid Transfer System for On-Highway Vehicle Company Market Share
Global Fluid Transfer System for On-Highway Vehicle Market Analysis and Forecast 2025-2033
This comprehensive report provides an in-depth analysis of the global Fluid Transfer System for On-Highway Vehicle market, covering the study period of 2019–2033, with a base year of 2025 and a forecast period from 2025–2033. We delve into market size, trends, drivers, challenges, and competitive landscapes, offering strategic insights for industry stakeholders. Our analysis encompasses key segments such as Passenger Cars, Light Commercial Vehicles, Trucks, and Buses, and product types including Hoses and Tubing. Leading companies like Safran, Holdfast Fluid Power, Cooper Standard, Continental, Akwel, Kongsberg Automotive, and TI Fluid Systems are thoroughly examined.
Fluid Transfer System for On-Highway Vehicle Market Structure & Competitive Dynamics
The global Fluid Transfer System for On-Highway Vehicle market exhibits a moderately consolidated structure, with a few key players holding significant market share. The estimated market share for the leading companies in 2025 is projected to be approximately 60%. Innovation ecosystems are robust, driven by continuous advancements in material science and manufacturing processes, particularly in lightweight and durable fluid transfer solutions. Regulatory frameworks, such as emission standards and safety mandates, significantly influence product development and material choices, favoring advanced polymers and reinforced tubing. Product substitutes, while present in niche applications, are largely outcompeted by the specialized performance and reliability of dedicated fluid transfer systems. End-user trends lean towards enhanced fuel efficiency, reduced emissions, and improved vehicle performance, driving demand for sophisticated, integrated fluid transfer solutions. Mergers and acquisitions (M&A) activities have been moderate, with estimated M&A deal values in the tens of millions of dollars annually, focusing on technology acquisition and market expansion. Key M&A trends include acquisitions of specialized component manufacturers to bolster product portfolios and integration of advanced material technologies.
Fluid Transfer System for On-Highway Vehicle Industry Trends & Insights
The Fluid Transfer System for On-Highway Vehicle market is poised for substantial growth, with a projected Compound Annual Growth Rate (CAGR) of XX% during the forecast period. This growth is propelled by several key industry trends. Firstly, the increasing global vehicle production, especially in emerging economies, directly fuels demand for these essential automotive components. The projected global vehicle production for 2025 is in the range of 80 million to 90 million units. Secondly, stringent environmental regulations worldwide are pushing manufacturers to develop lighter, more efficient, and emission-compliant vehicle systems. This includes the need for highly reliable fluid transfer systems for various applications, from fuel delivery to cooling and braking. Technological disruptions are also playing a pivotal role. The advent of advanced composite materials and innovative manufacturing techniques is leading to the development of more durable, heat-resistant, and chemically inert fluid transfer solutions. For instance, advancements in fluoropolymer-lined hoses and high-performance thermoplastic tubing are gaining traction for their superior resistance to aggressive fluids and extreme temperatures. Consumer preferences are shifting towards vehicles with improved performance, lower maintenance costs, and enhanced safety features. Fluid transfer systems contribute significantly to these aspects by ensuring leak-free operation, optimal fluid flow, and robust performance under diverse operating conditions. The competitive dynamics are characterized by a focus on cost optimization, product differentiation through innovation, and strategic partnerships. Companies are investing heavily in research and development to stay ahead of the curve, particularly in areas like electrification and alternative fuel systems, which will require novel fluid transfer solutions. The market penetration of advanced fluid transfer systems is expected to grow as vehicle manufacturers increasingly adopt these technologies to meet evolving industry standards and consumer expectations. The estimated market penetration for advanced fluid transfer systems in new vehicle production is projected to reach XX% by 2033.
Dominant Markets & Segments in Fluid Transfer System for On-Highway Vehicle
The Passenger Car segment is the dominant market within the fluid transfer system for on-highway vehicles, driven by the sheer volume of production and ongoing technological advancements in this sector. In 2025, passenger cars are estimated to account for approximately 65% of the total market revenue, with a projected market size of $XX billion. Key drivers for this dominance include:
- Economic Policies: Favorable economic policies in major automotive markets like Asia-Pacific and North America stimulate consumer spending on passenger vehicles, thereby increasing the demand for fluid transfer systems.
- Infrastructure Development: Continuous improvement in road infrastructure worldwide supports higher vehicle sales, directly impacting the need for automotive components.
The Hoses segment is the leading product type, estimated to hold a market share of roughly 60% in 2025, with a market valuation of $XX billion. The dominance of hoses is attributed to:
- Versatility: Hoses are indispensable for a wide range of fluid transfer applications, including fuel lines, coolant systems, brake lines, and power steering.
- Technological Advancements: Innovations in materials like EPDM, NBR, and fluoropolymers have enhanced hose durability, temperature resistance, and chemical compatibility, making them preferred choices.
- Cost-Effectiveness: Compared to certain tubing solutions, hoses often offer a more cost-effective option for various applications without compromising performance.
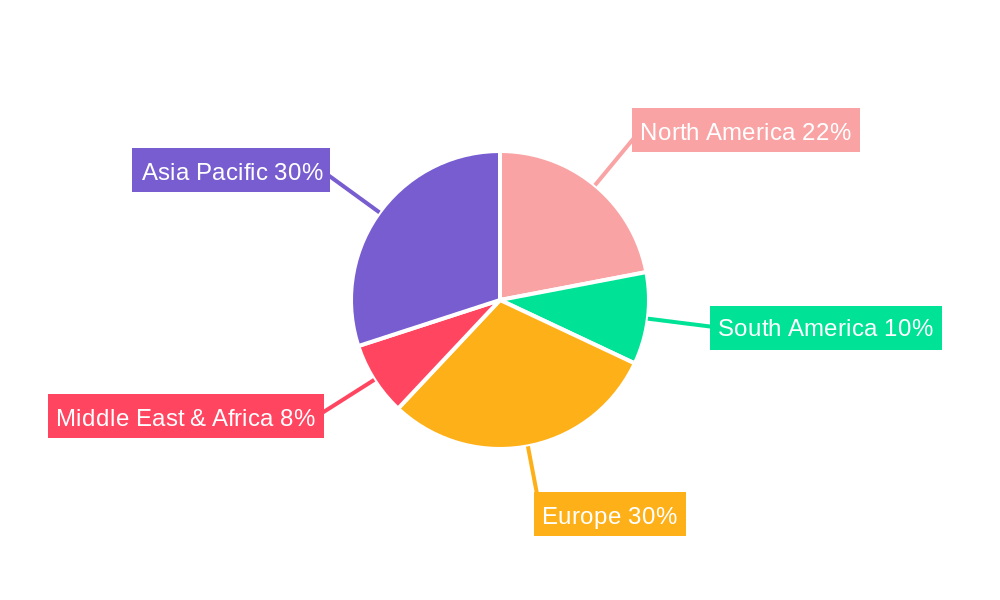
Regionally, Asia-Pacific is the dominant market, projected to command approximately 40% of the global market share in 2025. This dominance is underpinned by:
- Massive Vehicle Production Hubs: Countries like China, India, and South Korea are major global automotive manufacturing centers, leading to substantial demand for fluid transfer systems.
- Growing Middle Class and Disposable Income: Rising disposable incomes in these regions fuel consumer demand for new vehicles, including passenger cars and commercial vehicles.
- Government Initiatives: Supportive government policies for the automotive sector, including incentives for electric vehicle (EV) adoption, indirectly boost the demand for advanced fluid transfer systems.
Fluid Transfer System for On-Highway Vehicle Product Innovations
The market is witnessing significant product innovations in fluid transfer systems for on-highway vehicles, driven by the pursuit of enhanced performance, safety, and environmental compliance. Key developments include the introduction of advanced composite hoses that offer superior strength-to-weight ratios, reducing overall vehicle mass and improving fuel efficiency. Innovations in tubing materials, such as high-performance thermoplastic elastomers (TPEs) and reinforced polymers, are enabling greater resistance to extreme temperatures and aggressive fluids, crucial for next-generation powertrain systems, including those in electric vehicles. Furthermore, integrated fluid transfer solutions, which combine multiple components into single, streamlined units, are emerging to simplify assembly, reduce potential leak points, and optimize system performance. These product developments are directly addressing market needs for durability, reliability, and compatibility with evolving automotive technologies.
Report Segmentation & Scope
This report segments the global Fluid Transfer System for On-Highway Vehicle market by Application and Type. The Application segments include Passenger Car, Light Commercial Vehicle, Truck, and Bus. The Type segments are Hoses and Tubing.
- Passenger Car: This segment is expected to continue its dominance, driven by high production volumes. Its market size is projected to reach $XX billion by 2025, with an anticipated CAGR of XX% during the forecast period. Competitive dynamics involve major automotive suppliers catering to diverse passenger vehicle platforms.
- Light Commercial Vehicle: This segment is experiencing steady growth, fueled by the expansion of e-commerce and logistics. Its market size is estimated at $XX billion in 2025, with a projected CAGR of XX%.
- Truck: The truck segment is influenced by freight transportation demand and infrastructure projects. Its market size is anticipated to be $XX billion in 2025, with a CAGR of XX%.
- Bus: This segment's growth is tied to public transportation needs and government investments. Its market size is projected to reach $XX billion in 2025, with a CAGR of XX%.
- Hoses: This segment represents the largest product type, estimated at $XX billion in 2025, driven by widespread application across all vehicle types and its inherent flexibility and cost-effectiveness.
- Tubing: While smaller in market share, the tubing segment is poised for significant growth due to advancements in materials and applications in specialized systems, estimated at $XX billion in 2025.
Key Drivers of Fluid Transfer System for On-Highway Vehicle Growth
Several factors are driving the growth of the Fluid Transfer System for On-Highway Vehicle market. The increasing global vehicle production volumes, particularly in emerging economies, directly translate to higher demand for these essential components. Stringent emission regulations and fuel efficiency standards globally necessitate the adoption of advanced, leak-free fluid transfer systems that minimize environmental impact. Technological advancements in material science, leading to lighter, more durable, and heat-resistant hoses and tubing, are crucial for modern vehicle designs. Furthermore, the expanding fleet of commercial vehicles, including trucks and buses, for logistics and public transportation, fuels the demand for robust fluid transfer solutions. The growing adoption of electric and hybrid vehicles also presents new opportunities, requiring specialized fluid transfer systems for battery cooling, thermal management, and power delivery.
Challenges in the Fluid Transfer System for On-Highway Vehicle Sector
Despite the positive growth trajectory, the Fluid Transfer System for On-Highway Vehicle sector faces several challenges. Intense price competition among suppliers can put pressure on profit margins. Fluctuations in raw material prices, such as polymers and rubber, can impact manufacturing costs and product pricing. Supply chain disruptions, as experienced in recent years, can affect the availability of essential materials and components. Moreover, the evolving landscape of vehicle electrification and alternative powertrains requires continuous R&D investment to develop new fluid transfer solutions, posing a significant challenge for manufacturers to keep pace with technological shifts. The rigorous quality and safety standards in the automotive industry also demand substantial investment in testing and validation.
Leading Players in the Fluid Transfer System for On-Highway Vehicle Market
- Safran
- Holdfast Fluid Power
- Cooper Standard
- Continental
- Akwel
- Kongsberg Automotive
- TI Fluid Systems
Key Developments in Fluid Transfer System for On-Highway Vehicle Sector
- 2023: Cooper Standard launched a new generation of advanced polymer fuel hoses offering enhanced chemical resistance and lower permeation.
- 2023: Continental announced advancements in its electric vehicle thermal management fluid transfer solutions.
- 2022: TI Fluid Systems expanded its production capacity for advanced tubing solutions to meet growing demand.
- 2022: Akwel focused on developing lightweight and compact fluid transfer systems for commercial vehicles.
- 2021: Kongsberg Automotive introduced innovative solutions for brake fluid transfer in heavy-duty trucks.
- 2021: Safran reported advancements in its fluid transfer components for aviation-grade applications, with potential spin-offs to automotive.
Strategic Fluid Transfer System for On-Highway Vehicle Market Outlook
The strategic outlook for the Fluid Transfer System for On-Highway Vehicle market is highly promising, driven by an ongoing demand for efficiency, safety, and sustainability in the automotive industry. The increasing integration of advanced materials and smart technologies within fluid transfer systems will continue to shape market dynamics. Opportunities lie in developing specialized solutions for the burgeoning electric vehicle market, particularly for thermal management and battery cooling. Collaborations between fluid transfer system manufacturers and original equipment manufacturers (OEMs) will be crucial for co-developing tailor-made solutions. Furthermore, the focus on lightweighting and reducing vehicle emissions will continue to drive innovation, creating a sustained demand for high-performance, durable, and cost-effective fluid transfer systems across all on-highway vehicle segments.
Fluid Transfer System for On-Highway Vehicle Segmentation
-
1. Application
- 1.1. Passenger Car
- 1.2. Light Commercial Vehicle
- 1.3. Truck
- 1.4. Bus
-
2. Types
- 2.1. Hoses
- 2.2. Tubing
Fluid Transfer System for On-Highway Vehicle Segmentation By Geography
-
1. North America
- 1.1. United States
- 1.2. Canada
- 1.3. Mexico
-
2. South America
- 2.1. Brazil
- 2.2. Argentina
- 2.3. Rest of South America
-
3. Europe
- 3.1. United Kingdom
- 3.2. Germany
- 3.3. France
- 3.4. Italy
- 3.5. Spain
- 3.6. Russia
- 3.7. Benelux
- 3.8. Nordics
- 3.9. Rest of Europe
-
4. Middle East & Africa
- 4.1. Turkey
- 4.2. Israel
- 4.3. GCC
- 4.4. North Africa
- 4.5. South Africa
- 4.6. Rest of Middle East & Africa
-
5. Asia Pacific
- 5.1. China
- 5.2. India
- 5.3. Japan
- 5.4. South Korea
- 5.5. ASEAN
- 5.6. Oceania
- 5.7. Rest of Asia Pacific
Fluid Transfer System for On-Highway Vehicle Regional Market Share
Geographic Coverage of Fluid Transfer System for On-Highway Vehicle
Fluid Transfer System for On-Highway Vehicle REPORT HIGHLIGHTS
| Aspects | Details |
|---|---|
| Study Period | 2020-2034 |
| Base Year | 2025 |
| Estimated Year | 2026 |
| Forecast Period | 2026-2034 |
| Historical Period | 2020-2025 |
| Growth Rate | CAGR of 3.3% from 2020-2034 |
| Segmentation |
|
Table of Contents
- 1. Introduction
- 1.1. Research Scope
- 1.2. Market Segmentation
- 1.3. Research Methodology
- 1.4. Definitions and Assumptions
- 2. Executive Summary
- 2.1. Introduction
- 3. Market Dynamics
- 3.1. Introduction
- 3.2. Market Drivers
- 3.3. Market Restrains
- 3.4. Market Trends
- 4. Market Factor Analysis
- 4.1. Porters Five Forces
- 4.2. Supply/Value Chain
- 4.3. PESTEL analysis
- 4.4. Market Entropy
- 4.5. Patent/Trademark Analysis
- 5. Global Fluid Transfer System for On-Highway Vehicle Analysis, Insights and Forecast, 2020-2032
- 5.1. Market Analysis, Insights and Forecast - by Application
- 5.1.1. Passenger Car
- 5.1.2. Light Commercial Vehicle
- 5.1.3. Truck
- 5.1.4. Bus
- 5.2. Market Analysis, Insights and Forecast - by Types
- 5.2.1. Hoses
- 5.2.2. Tubing
- 5.3. Market Analysis, Insights and Forecast - by Region
- 5.3.1. North America
- 5.3.2. South America
- 5.3.3. Europe
- 5.3.4. Middle East & Africa
- 5.3.5. Asia Pacific
- 5.1. Market Analysis, Insights and Forecast - by Application
- 6. North America Fluid Transfer System for On-Highway Vehicle Analysis, Insights and Forecast, 2020-2032
- 6.1. Market Analysis, Insights and Forecast - by Application
- 6.1.1. Passenger Car
- 6.1.2. Light Commercial Vehicle
- 6.1.3. Truck
- 6.1.4. Bus
- 6.2. Market Analysis, Insights and Forecast - by Types
- 6.2.1. Hoses
- 6.2.2. Tubing
- 6.1. Market Analysis, Insights and Forecast - by Application
- 7. South America Fluid Transfer System for On-Highway Vehicle Analysis, Insights and Forecast, 2020-2032
- 7.1. Market Analysis, Insights and Forecast - by Application
- 7.1.1. Passenger Car
- 7.1.2. Light Commercial Vehicle
- 7.1.3. Truck
- 7.1.4. Bus
- 7.2. Market Analysis, Insights and Forecast - by Types
- 7.2.1. Hoses
- 7.2.2. Tubing
- 7.1. Market Analysis, Insights and Forecast - by Application
- 8. Europe Fluid Transfer System for On-Highway Vehicle Analysis, Insights and Forecast, 2020-2032
- 8.1. Market Analysis, Insights and Forecast - by Application
- 8.1.1. Passenger Car
- 8.1.2. Light Commercial Vehicle
- 8.1.3. Truck
- 8.1.4. Bus
- 8.2. Market Analysis, Insights and Forecast - by Types
- 8.2.1. Hoses
- 8.2.2. Tubing
- 8.1. Market Analysis, Insights and Forecast - by Application
- 9. Middle East & Africa Fluid Transfer System for On-Highway Vehicle Analysis, Insights and Forecast, 2020-2032
- 9.1. Market Analysis, Insights and Forecast - by Application
- 9.1.1. Passenger Car
- 9.1.2. Light Commercial Vehicle
- 9.1.3. Truck
- 9.1.4. Bus
- 9.2. Market Analysis, Insights and Forecast - by Types
- 9.2.1. Hoses
- 9.2.2. Tubing
- 9.1. Market Analysis, Insights and Forecast - by Application
- 10. Asia Pacific Fluid Transfer System for On-Highway Vehicle Analysis, Insights and Forecast, 2020-2032
- 10.1. Market Analysis, Insights and Forecast - by Application
- 10.1.1. Passenger Car
- 10.1.2. Light Commercial Vehicle
- 10.1.3. Truck
- 10.1.4. Bus
- 10.2. Market Analysis, Insights and Forecast - by Types
- 10.2.1. Hoses
- 10.2.2. Tubing
- 10.1. Market Analysis, Insights and Forecast - by Application
- 11. Competitive Analysis
- 11.1. Global Market Share Analysis 2025
- 11.2. Company Profiles
- 11.2.1 Safran
- 11.2.1.1. Overview
- 11.2.1.2. Products
- 11.2.1.3. SWOT Analysis
- 11.2.1.4. Recent Developments
- 11.2.1.5. Financials (Based on Availability)
- 11.2.2 Holdfast Fluid Power
- 11.2.2.1. Overview
- 11.2.2.2. Products
- 11.2.2.3. SWOT Analysis
- 11.2.2.4. Recent Developments
- 11.2.2.5. Financials (Based on Availability)
- 11.2.3 Cooper Standard
- 11.2.3.1. Overview
- 11.2.3.2. Products
- 11.2.3.3. SWOT Analysis
- 11.2.3.4. Recent Developments
- 11.2.3.5. Financials (Based on Availability)
- 11.2.4 Continental
- 11.2.4.1. Overview
- 11.2.4.2. Products
- 11.2.4.3. SWOT Analysis
- 11.2.4.4. Recent Developments
- 11.2.4.5. Financials (Based on Availability)
- 11.2.5 Akwel
- 11.2.5.1. Overview
- 11.2.5.2. Products
- 11.2.5.3. SWOT Analysis
- 11.2.5.4. Recent Developments
- 11.2.5.5. Financials (Based on Availability)
- 11.2.6 Kongsberg Automotive
- 11.2.6.1. Overview
- 11.2.6.2. Products
- 11.2.6.3. SWOT Analysis
- 11.2.6.4. Recent Developments
- 11.2.6.5. Financials (Based on Availability)
- 11.2.7 TI fluid systems
- 11.2.7.1. Overview
- 11.2.7.2. Products
- 11.2.7.3. SWOT Analysis
- 11.2.7.4. Recent Developments
- 11.2.7.5. Financials (Based on Availability)
- 11.2.1 Safran
List of Figures
- Figure 1: Global Fluid Transfer System for On-Highway Vehicle Revenue Breakdown (undefined, %) by Region 2025 & 2033
- Figure 2: Global Fluid Transfer System for On-Highway Vehicle Volume Breakdown (K, %) by Region 2025 & 2033
- Figure 3: North America Fluid Transfer System for On-Highway Vehicle Revenue (undefined), by Application 2025 & 2033
- Figure 4: North America Fluid Transfer System for On-Highway Vehicle Volume (K), by Application 2025 & 2033
- Figure 5: North America Fluid Transfer System for On-Highway Vehicle Revenue Share (%), by Application 2025 & 2033
- Figure 6: North America Fluid Transfer System for On-Highway Vehicle Volume Share (%), by Application 2025 & 2033
- Figure 7: North America Fluid Transfer System for On-Highway Vehicle Revenue (undefined), by Types 2025 & 2033
- Figure 8: North America Fluid Transfer System for On-Highway Vehicle Volume (K), by Types 2025 & 2033
- Figure 9: North America Fluid Transfer System for On-Highway Vehicle Revenue Share (%), by Types 2025 & 2033
- Figure 10: North America Fluid Transfer System for On-Highway Vehicle Volume Share (%), by Types 2025 & 2033
- Figure 11: North America Fluid Transfer System for On-Highway Vehicle Revenue (undefined), by Country 2025 & 2033
- Figure 12: North America Fluid Transfer System for On-Highway Vehicle Volume (K), by Country 2025 & 2033
- Figure 13: North America Fluid Transfer System for On-Highway Vehicle Revenue Share (%), by Country 2025 & 2033
- Figure 14: North America Fluid Transfer System for On-Highway Vehicle Volume Share (%), by Country 2025 & 2033
- Figure 15: South America Fluid Transfer System for On-Highway Vehicle Revenue (undefined), by Application 2025 & 2033
- Figure 16: South America Fluid Transfer System for On-Highway Vehicle Volume (K), by Application 2025 & 2033
- Figure 17: South America Fluid Transfer System for On-Highway Vehicle Revenue Share (%), by Application 2025 & 2033
- Figure 18: South America Fluid Transfer System for On-Highway Vehicle Volume Share (%), by Application 2025 & 2033
- Figure 19: South America Fluid Transfer System for On-Highway Vehicle Revenue (undefined), by Types 2025 & 2033
- Figure 20: South America Fluid Transfer System for On-Highway Vehicle Volume (K), by Types 2025 & 2033
- Figure 21: South America Fluid Transfer System for On-Highway Vehicle Revenue Share (%), by Types 2025 & 2033
- Figure 22: South America Fluid Transfer System for On-Highway Vehicle Volume Share (%), by Types 2025 & 2033
- Figure 23: South America Fluid Transfer System for On-Highway Vehicle Revenue (undefined), by Country 2025 & 2033
- Figure 24: South America Fluid Transfer System for On-Highway Vehicle Volume (K), by Country 2025 & 2033
- Figure 25: South America Fluid Transfer System for On-Highway Vehicle Revenue Share (%), by Country 2025 & 2033
- Figure 26: South America Fluid Transfer System for On-Highway Vehicle Volume Share (%), by Country 2025 & 2033
- Figure 27: Europe Fluid Transfer System for On-Highway Vehicle Revenue (undefined), by Application 2025 & 2033
- Figure 28: Europe Fluid Transfer System for On-Highway Vehicle Volume (K), by Application 2025 & 2033
- Figure 29: Europe Fluid Transfer System for On-Highway Vehicle Revenue Share (%), by Application 2025 & 2033
- Figure 30: Europe Fluid Transfer System for On-Highway Vehicle Volume Share (%), by Application 2025 & 2033
- Figure 31: Europe Fluid Transfer System for On-Highway Vehicle Revenue (undefined), by Types 2025 & 2033
- Figure 32: Europe Fluid Transfer System for On-Highway Vehicle Volume (K), by Types 2025 & 2033
- Figure 33: Europe Fluid Transfer System for On-Highway Vehicle Revenue Share (%), by Types 2025 & 2033
- Figure 34: Europe Fluid Transfer System for On-Highway Vehicle Volume Share (%), by Types 2025 & 2033
- Figure 35: Europe Fluid Transfer System for On-Highway Vehicle Revenue (undefined), by Country 2025 & 2033
- Figure 36: Europe Fluid Transfer System for On-Highway Vehicle Volume (K), by Country 2025 & 2033
- Figure 37: Europe Fluid Transfer System for On-Highway Vehicle Revenue Share (%), by Country 2025 & 2033
- Figure 38: Europe Fluid Transfer System for On-Highway Vehicle Volume Share (%), by Country 2025 & 2033
- Figure 39: Middle East & Africa Fluid Transfer System for On-Highway Vehicle Revenue (undefined), by Application 2025 & 2033
- Figure 40: Middle East & Africa Fluid Transfer System for On-Highway Vehicle Volume (K), by Application 2025 & 2033
- Figure 41: Middle East & Africa Fluid Transfer System for On-Highway Vehicle Revenue Share (%), by Application 2025 & 2033
- Figure 42: Middle East & Africa Fluid Transfer System for On-Highway Vehicle Volume Share (%), by Application 2025 & 2033
- Figure 43: Middle East & Africa Fluid Transfer System for On-Highway Vehicle Revenue (undefined), by Types 2025 & 2033
- Figure 44: Middle East & Africa Fluid Transfer System for On-Highway Vehicle Volume (K), by Types 2025 & 2033
- Figure 45: Middle East & Africa Fluid Transfer System for On-Highway Vehicle Revenue Share (%), by Types 2025 & 2033
- Figure 46: Middle East & Africa Fluid Transfer System for On-Highway Vehicle Volume Share (%), by Types 2025 & 2033
- Figure 47: Middle East & Africa Fluid Transfer System for On-Highway Vehicle Revenue (undefined), by Country 2025 & 2033
- Figure 48: Middle East & Africa Fluid Transfer System for On-Highway Vehicle Volume (K), by Country 2025 & 2033
- Figure 49: Middle East & Africa Fluid Transfer System for On-Highway Vehicle Revenue Share (%), by Country 2025 & 2033
- Figure 50: Middle East & Africa Fluid Transfer System for On-Highway Vehicle Volume Share (%), by Country 2025 & 2033
- Figure 51: Asia Pacific Fluid Transfer System for On-Highway Vehicle Revenue (undefined), by Application 2025 & 2033
- Figure 52: Asia Pacific Fluid Transfer System for On-Highway Vehicle Volume (K), by Application 2025 & 2033
- Figure 53: Asia Pacific Fluid Transfer System for On-Highway Vehicle Revenue Share (%), by Application 2025 & 2033
- Figure 54: Asia Pacific Fluid Transfer System for On-Highway Vehicle Volume Share (%), by Application 2025 & 2033
- Figure 55: Asia Pacific Fluid Transfer System for On-Highway Vehicle Revenue (undefined), by Types 2025 & 2033
- Figure 56: Asia Pacific Fluid Transfer System for On-Highway Vehicle Volume (K), by Types 2025 & 2033
- Figure 57: Asia Pacific Fluid Transfer System for On-Highway Vehicle Revenue Share (%), by Types 2025 & 2033
- Figure 58: Asia Pacific Fluid Transfer System for On-Highway Vehicle Volume Share (%), by Types 2025 & 2033
- Figure 59: Asia Pacific Fluid Transfer System for On-Highway Vehicle Revenue (undefined), by Country 2025 & 2033
- Figure 60: Asia Pacific Fluid Transfer System for On-Highway Vehicle Volume (K), by Country 2025 & 2033
- Figure 61: Asia Pacific Fluid Transfer System for On-Highway Vehicle Revenue Share (%), by Country 2025 & 2033
- Figure 62: Asia Pacific Fluid Transfer System for On-Highway Vehicle Volume Share (%), by Country 2025 & 2033
List of Tables
- Table 1: Global Fluid Transfer System for On-Highway Vehicle Revenue undefined Forecast, by Application 2020 & 2033
- Table 2: Global Fluid Transfer System for On-Highway Vehicle Volume K Forecast, by Application 2020 & 2033
- Table 3: Global Fluid Transfer System for On-Highway Vehicle Revenue undefined Forecast, by Types 2020 & 2033
- Table 4: Global Fluid Transfer System for On-Highway Vehicle Volume K Forecast, by Types 2020 & 2033
- Table 5: Global Fluid Transfer System for On-Highway Vehicle Revenue undefined Forecast, by Region 2020 & 2033
- Table 6: Global Fluid Transfer System for On-Highway Vehicle Volume K Forecast, by Region 2020 & 2033
- Table 7: Global Fluid Transfer System for On-Highway Vehicle Revenue undefined Forecast, by Application 2020 & 2033
- Table 8: Global Fluid Transfer System for On-Highway Vehicle Volume K Forecast, by Application 2020 & 2033
- Table 9: Global Fluid Transfer System for On-Highway Vehicle Revenue undefined Forecast, by Types 2020 & 2033
- Table 10: Global Fluid Transfer System for On-Highway Vehicle Volume K Forecast, by Types 2020 & 2033
- Table 11: Global Fluid Transfer System for On-Highway Vehicle Revenue undefined Forecast, by Country 2020 & 2033
- Table 12: Global Fluid Transfer System for On-Highway Vehicle Volume K Forecast, by Country 2020 & 2033
- Table 13: United States Fluid Transfer System for On-Highway Vehicle Revenue (undefined) Forecast, by Application 2020 & 2033
- Table 14: United States Fluid Transfer System for On-Highway Vehicle Volume (K) Forecast, by Application 2020 & 2033
- Table 15: Canada Fluid Transfer System for On-Highway Vehicle Revenue (undefined) Forecast, by Application 2020 & 2033
- Table 16: Canada Fluid Transfer System for On-Highway Vehicle Volume (K) Forecast, by Application 2020 & 2033
- Table 17: Mexico Fluid Transfer System for On-Highway Vehicle Revenue (undefined) Forecast, by Application 2020 & 2033
- Table 18: Mexico Fluid Transfer System for On-Highway Vehicle Volume (K) Forecast, by Application 2020 & 2033
- Table 19: Global Fluid Transfer System for On-Highway Vehicle Revenue undefined Forecast, by Application 2020 & 2033
- Table 20: Global Fluid Transfer System for On-Highway Vehicle Volume K Forecast, by Application 2020 & 2033
- Table 21: Global Fluid Transfer System for On-Highway Vehicle Revenue undefined Forecast, by Types 2020 & 2033
- Table 22: Global Fluid Transfer System for On-Highway Vehicle Volume K Forecast, by Types 2020 & 2033
- Table 23: Global Fluid Transfer System for On-Highway Vehicle Revenue undefined Forecast, by Country 2020 & 2033
- Table 24: Global Fluid Transfer System for On-Highway Vehicle Volume K Forecast, by Country 2020 & 2033
- Table 25: Brazil Fluid Transfer System for On-Highway Vehicle Revenue (undefined) Forecast, by Application 2020 & 2033
- Table 26: Brazil Fluid Transfer System for On-Highway Vehicle Volume (K) Forecast, by Application 2020 & 2033
- Table 27: Argentina Fluid Transfer System for On-Highway Vehicle Revenue (undefined) Forecast, by Application 2020 & 2033
- Table 28: Argentina Fluid Transfer System for On-Highway Vehicle Volume (K) Forecast, by Application 2020 & 2033
- Table 29: Rest of South America Fluid Transfer System for On-Highway Vehicle Revenue (undefined) Forecast, by Application 2020 & 2033
- Table 30: Rest of South America Fluid Transfer System for On-Highway Vehicle Volume (K) Forecast, by Application 2020 & 2033
- Table 31: Global Fluid Transfer System for On-Highway Vehicle Revenue undefined Forecast, by Application 2020 & 2033
- Table 32: Global Fluid Transfer System for On-Highway Vehicle Volume K Forecast, by Application 2020 & 2033
- Table 33: Global Fluid Transfer System for On-Highway Vehicle Revenue undefined Forecast, by Types 2020 & 2033
- Table 34: Global Fluid Transfer System for On-Highway Vehicle Volume K Forecast, by Types 2020 & 2033
- Table 35: Global Fluid Transfer System for On-Highway Vehicle Revenue undefined Forecast, by Country 2020 & 2033
- Table 36: Global Fluid Transfer System for On-Highway Vehicle Volume K Forecast, by Country 2020 & 2033
- Table 37: United Kingdom Fluid Transfer System for On-Highway Vehicle Revenue (undefined) Forecast, by Application 2020 & 2033
- Table 38: United Kingdom Fluid Transfer System for On-Highway Vehicle Volume (K) Forecast, by Application 2020 & 2033
- Table 39: Germany Fluid Transfer System for On-Highway Vehicle Revenue (undefined) Forecast, by Application 2020 & 2033
- Table 40: Germany Fluid Transfer System for On-Highway Vehicle Volume (K) Forecast, by Application 2020 & 2033
- Table 41: France Fluid Transfer System for On-Highway Vehicle Revenue (undefined) Forecast, by Application 2020 & 2033
- Table 42: France Fluid Transfer System for On-Highway Vehicle Volume (K) Forecast, by Application 2020 & 2033
- Table 43: Italy Fluid Transfer System for On-Highway Vehicle Revenue (undefined) Forecast, by Application 2020 & 2033
- Table 44: Italy Fluid Transfer System for On-Highway Vehicle Volume (K) Forecast, by Application 2020 & 2033
- Table 45: Spain Fluid Transfer System for On-Highway Vehicle Revenue (undefined) Forecast, by Application 2020 & 2033
- Table 46: Spain Fluid Transfer System for On-Highway Vehicle Volume (K) Forecast, by Application 2020 & 2033
- Table 47: Russia Fluid Transfer System for On-Highway Vehicle Revenue (undefined) Forecast, by Application 2020 & 2033
- Table 48: Russia Fluid Transfer System for On-Highway Vehicle Volume (K) Forecast, by Application 2020 & 2033
- Table 49: Benelux Fluid Transfer System for On-Highway Vehicle Revenue (undefined) Forecast, by Application 2020 & 2033
- Table 50: Benelux Fluid Transfer System for On-Highway Vehicle Volume (K) Forecast, by Application 2020 & 2033
- Table 51: Nordics Fluid Transfer System for On-Highway Vehicle Revenue (undefined) Forecast, by Application 2020 & 2033
- Table 52: Nordics Fluid Transfer System for On-Highway Vehicle Volume (K) Forecast, by Application 2020 & 2033
- Table 53: Rest of Europe Fluid Transfer System for On-Highway Vehicle Revenue (undefined) Forecast, by Application 2020 & 2033
- Table 54: Rest of Europe Fluid Transfer System for On-Highway Vehicle Volume (K) Forecast, by Application 2020 & 2033
- Table 55: Global Fluid Transfer System for On-Highway Vehicle Revenue undefined Forecast, by Application 2020 & 2033
- Table 56: Global Fluid Transfer System for On-Highway Vehicle Volume K Forecast, by Application 2020 & 2033
- Table 57: Global Fluid Transfer System for On-Highway Vehicle Revenue undefined Forecast, by Types 2020 & 2033
- Table 58: Global Fluid Transfer System for On-Highway Vehicle Volume K Forecast, by Types 2020 & 2033
- Table 59: Global Fluid Transfer System for On-Highway Vehicle Revenue undefined Forecast, by Country 2020 & 2033
- Table 60: Global Fluid Transfer System for On-Highway Vehicle Volume K Forecast, by Country 2020 & 2033
- Table 61: Turkey Fluid Transfer System for On-Highway Vehicle Revenue (undefined) Forecast, by Application 2020 & 2033
- Table 62: Turkey Fluid Transfer System for On-Highway Vehicle Volume (K) Forecast, by Application 2020 & 2033
- Table 63: Israel Fluid Transfer System for On-Highway Vehicle Revenue (undefined) Forecast, by Application 2020 & 2033
- Table 64: Israel Fluid Transfer System for On-Highway Vehicle Volume (K) Forecast, by Application 2020 & 2033
- Table 65: GCC Fluid Transfer System for On-Highway Vehicle Revenue (undefined) Forecast, by Application 2020 & 2033
- Table 66: GCC Fluid Transfer System for On-Highway Vehicle Volume (K) Forecast, by Application 2020 & 2033
- Table 67: North Africa Fluid Transfer System for On-Highway Vehicle Revenue (undefined) Forecast, by Application 2020 & 2033
- Table 68: North Africa Fluid Transfer System for On-Highway Vehicle Volume (K) Forecast, by Application 2020 & 2033
- Table 69: South Africa Fluid Transfer System for On-Highway Vehicle Revenue (undefined) Forecast, by Application 2020 & 2033
- Table 70: South Africa Fluid Transfer System for On-Highway Vehicle Volume (K) Forecast, by Application 2020 & 2033
- Table 71: Rest of Middle East & Africa Fluid Transfer System for On-Highway Vehicle Revenue (undefined) Forecast, by Application 2020 & 2033
- Table 72: Rest of Middle East & Africa Fluid Transfer System for On-Highway Vehicle Volume (K) Forecast, by Application 2020 & 2033
- Table 73: Global Fluid Transfer System for On-Highway Vehicle Revenue undefined Forecast, by Application 2020 & 2033
- Table 74: Global Fluid Transfer System for On-Highway Vehicle Volume K Forecast, by Application 2020 & 2033
- Table 75: Global Fluid Transfer System for On-Highway Vehicle Revenue undefined Forecast, by Types 2020 & 2033
- Table 76: Global Fluid Transfer System for On-Highway Vehicle Volume K Forecast, by Types 2020 & 2033
- Table 77: Global Fluid Transfer System for On-Highway Vehicle Revenue undefined Forecast, by Country 2020 & 2033
- Table 78: Global Fluid Transfer System for On-Highway Vehicle Volume K Forecast, by Country 2020 & 2033
- Table 79: China Fluid Transfer System for On-Highway Vehicle Revenue (undefined) Forecast, by Application 2020 & 2033
- Table 80: China Fluid Transfer System for On-Highway Vehicle Volume (K) Forecast, by Application 2020 & 2033
- Table 81: India Fluid Transfer System for On-Highway Vehicle Revenue (undefined) Forecast, by Application 2020 & 2033
- Table 82: India Fluid Transfer System for On-Highway Vehicle Volume (K) Forecast, by Application 2020 & 2033
- Table 83: Japan Fluid Transfer System for On-Highway Vehicle Revenue (undefined) Forecast, by Application 2020 & 2033
- Table 84: Japan Fluid Transfer System for On-Highway Vehicle Volume (K) Forecast, by Application 2020 & 2033
- Table 85: South Korea Fluid Transfer System for On-Highway Vehicle Revenue (undefined) Forecast, by Application 2020 & 2033
- Table 86: South Korea Fluid Transfer System for On-Highway Vehicle Volume (K) Forecast, by Application 2020 & 2033
- Table 87: ASEAN Fluid Transfer System for On-Highway Vehicle Revenue (undefined) Forecast, by Application 2020 & 2033
- Table 88: ASEAN Fluid Transfer System for On-Highway Vehicle Volume (K) Forecast, by Application 2020 & 2033
- Table 89: Oceania Fluid Transfer System for On-Highway Vehicle Revenue (undefined) Forecast, by Application 2020 & 2033
- Table 90: Oceania Fluid Transfer System for On-Highway Vehicle Volume (K) Forecast, by Application 2020 & 2033
- Table 91: Rest of Asia Pacific Fluid Transfer System for On-Highway Vehicle Revenue (undefined) Forecast, by Application 2020 & 2033
- Table 92: Rest of Asia Pacific Fluid Transfer System for On-Highway Vehicle Volume (K) Forecast, by Application 2020 & 2033
Frequently Asked Questions
1. What is the projected Compound Annual Growth Rate (CAGR) of the Fluid Transfer System for On-Highway Vehicle?
The projected CAGR is approximately 3.3%.
2. Which companies are prominent players in the Fluid Transfer System for On-Highway Vehicle?
Key companies in the market include Safran, Holdfast Fluid Power, Cooper Standard, Continental, Akwel, Kongsberg Automotive, TI fluid systems.
3. What are the main segments of the Fluid Transfer System for On-Highway Vehicle?
The market segments include Application, Types.
4. Can you provide details about the market size?
The market size is estimated to be USD XXX N/A as of 2022.
5. What are some drivers contributing to market growth?
N/A
6. What are the notable trends driving market growth?
N/A
7. Are there any restraints impacting market growth?
N/A
8. Can you provide examples of recent developments in the market?
N/A
9. What pricing options are available for accessing the report?
Pricing options include single-user, multi-user, and enterprise licenses priced at USD 3350.00, USD 5025.00, and USD 6700.00 respectively.
10. Is the market size provided in terms of value or volume?
The market size is provided in terms of value, measured in N/A and volume, measured in K.
11. Are there any specific market keywords associated with the report?
Yes, the market keyword associated with the report is "Fluid Transfer System for On-Highway Vehicle," which aids in identifying and referencing the specific market segment covered.
12. How do I determine which pricing option suits my needs best?
The pricing options vary based on user requirements and access needs. Individual users may opt for single-user licenses, while businesses requiring broader access may choose multi-user or enterprise licenses for cost-effective access to the report.
13. Are there any additional resources or data provided in the Fluid Transfer System for On-Highway Vehicle report?
While the report offers comprehensive insights, it's advisable to review the specific contents or supplementary materials provided to ascertain if additional resources or data are available.
14. How can I stay updated on further developments or reports in the Fluid Transfer System for On-Highway Vehicle?
To stay informed about further developments, trends, and reports in the Fluid Transfer System for On-Highway Vehicle, consider subscribing to industry newsletters, following relevant companies and organizations, or regularly checking reputable industry news sources and publications.
Methodology
Step 1 - Identification of Relevant Samples Size from Population Database


Step 2 - Approaches for Defining Global Market Size (Value, Volume* & Price*)

Note*: In applicable scenarios
Step 3 - Data Sources
Primary Research
- Web Analytics
- Survey Reports
- Research Institute
- Latest Research Reports
- Opinion Leaders
Secondary Research
- Annual Reports
- White Paper
- Latest Press Release
- Industry Association
- Paid Database
- Investor Presentations

Step 4 - Data Triangulation
Involves using different sources of information in order to increase the validity of a study
These sources are likely to be stakeholders in a program - participants, other researchers, program staff, other community members, and so on.
Then we put all data in single framework & apply various statistical tools to find out the dynamic on the market.
During the analysis stage, feedback from the stakeholder groups would be compared to determine areas of agreement as well as areas of divergence