
Key Insights
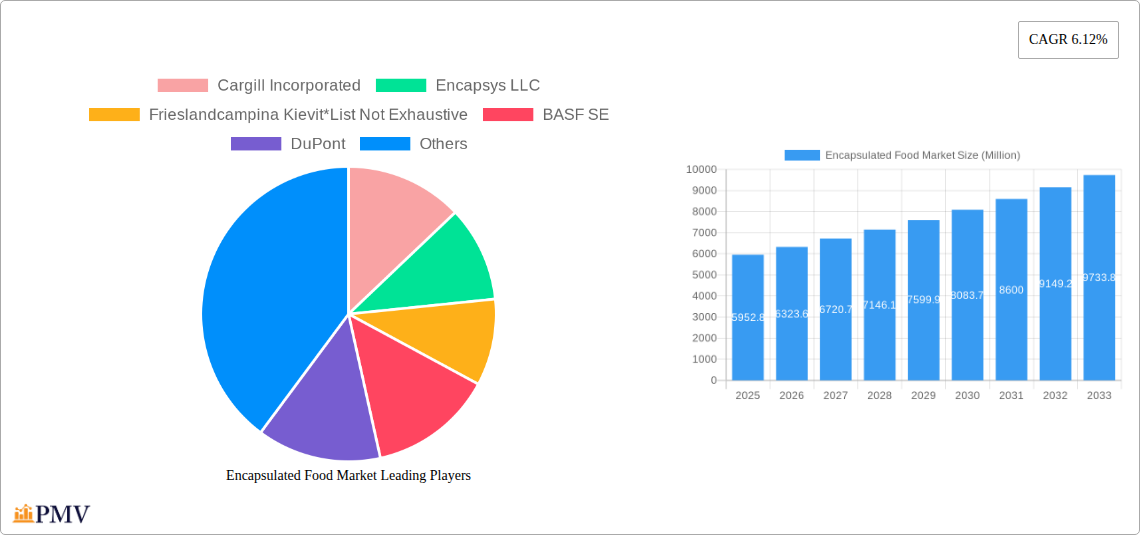
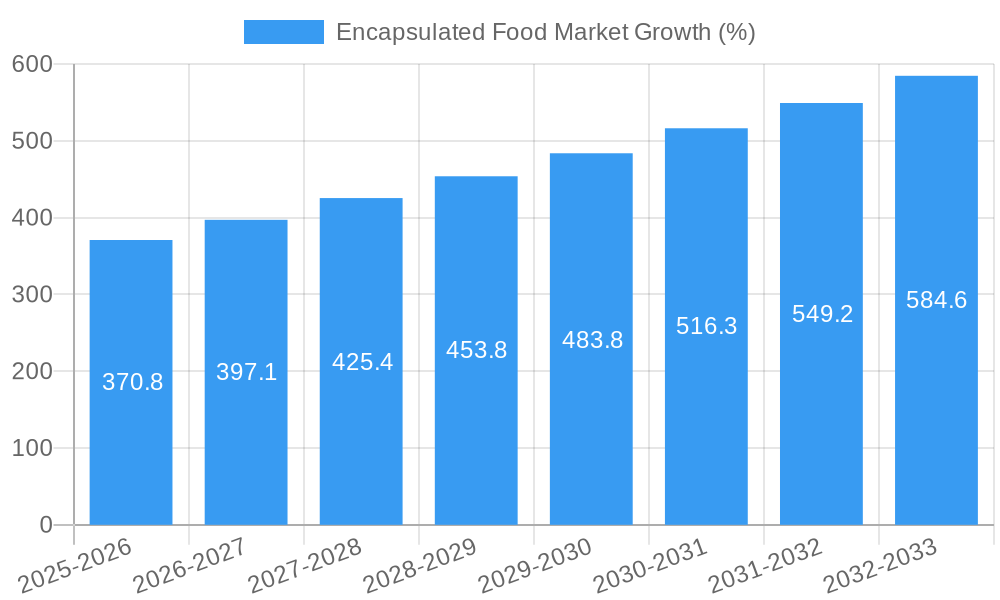
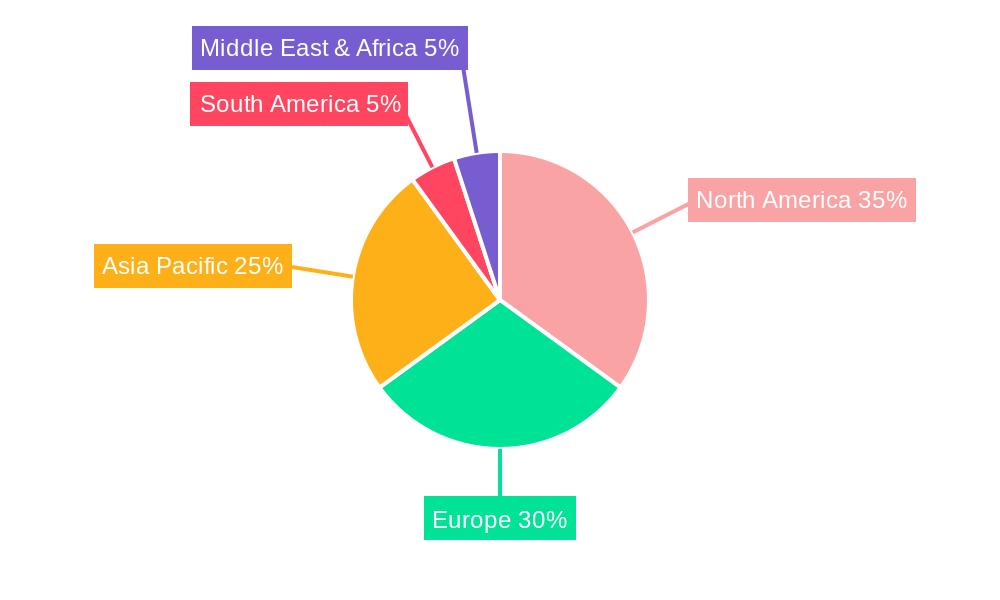
The global encapsulated food market, valued at $5,952.8 million in 2025, is projected to experience robust growth, driven by increasing demand for functional foods and supplements. The market's expansion is fueled by several key factors. Consumers are increasingly seeking foods with enhanced nutritional value, extended shelf life, and improved organoleptic properties (taste, texture, smell). Encapsulation technologies effectively address these needs by protecting sensitive ingredients like probiotics, vitamins, and essential oils from degradation during processing and storage, ensuring their bioavailability and efficacy. The rising prevalence of chronic diseases further contributes to the market's growth, as encapsulated nutrients offer targeted delivery and improved absorption, enhancing their therapeutic potential. Technological advancements in encapsulation methods, particularly the development of more sustainable and cost-effective techniques, also contribute to market expansion. The diverse range of applications across various food segments, including dairy, bakery, beverages, and nutraceuticals, broadens the market's reach. Growth is expected across all segments, with microencapsulation and nanoencapsulation technologies experiencing significant adoption. Polysaccharides, proteins, and lipids are the dominant shell materials, reflecting their biocompatibility and functional properties. Vitamins, minerals, and probiotics are the most commonly encapsulated core phase materials, showcasing the market's focus on health and wellness. Regional growth will vary, with North America and Europe maintaining significant market shares due to high consumer awareness and strong regulatory frameworks supporting functional foods. However, the Asia-Pacific region is poised for rapid growth, driven by rising disposable incomes and increasing health consciousness.
The competitive landscape is characterized by the presence of both large multinational corporations and specialized encapsulation technology providers. Major players are actively involved in research and development, striving to create innovative encapsulation solutions tailored to specific market needs. Strategic collaborations and mergers and acquisitions are likely to reshape the industry, further accelerating market growth. Despite the positive outlook, regulatory hurdles and potential cost constraints associated with advanced encapsulation technologies could pose challenges. However, ongoing innovation and increasing consumer demand are expected to outweigh these challenges, leading to a sustained period of growth for the encapsulated food market throughout the forecast period (2025-2033). The consistent CAGR of 6.12% indicates a steadily expanding market driven by the factors previously discussed.
Encapsulated Food Market: A Comprehensive Report (2019-2033)
This comprehensive report provides an in-depth analysis of the global encapsulated food market, offering valuable insights for industry stakeholders, investors, and researchers. The report covers the period from 2019 to 2033, with a focus on the forecast period of 2025-2033 and a base year of 2025. The market is segmented by technology (microencapsulation, nanoencapsulation, hybrid technologies), material type (polysaccharides, proteins, lipids, emulsifiers, other shell materials), and core phase (vitamins, minerals, enzymes, organic acids, additives, probiotics, prebiotics, essential oils, other core phase materials). The total market size in 2025 is estimated at $XX Million, with a projected CAGR of XX% during the forecast period. Key players like Cargill Incorporated, Encapsys LLC, Frieslandcampina Kievit, BASF SE, DuPont, ADVANCED BIONUTRITION CORP, Ingredion Incorporated, and GAT Food Essentials GmbH are profiled, providing a competitive landscape analysis.
Encapsulated Food Market Market Structure & Competitive Dynamics
The encapsulated food market exhibits a moderately concentrated structure, with a few major players holding significant market share. Cargill Incorporated and BASF SE, for example, command a substantial portion of the market, while numerous smaller companies cater to niche segments. The market's competitive landscape is characterized by intense innovation, particularly in developing novel encapsulation technologies and materials to enhance product stability, bioavailability, and sensory attributes. Regulatory frameworks, varying across regions, significantly influence market dynamics, impacting the adoption of new technologies and materials. Product substitutes, such as traditional food preservation methods, pose a competitive threat, though the superior performance of encapsulated foods in terms of stability and targeted delivery is driving market growth. End-user trends toward healthier and more convenient food products further fuel market expansion. M&A activity has been moderate, with deal values averaging $XX Million in recent years, reflecting strategic efforts by larger players to expand their product portfolios and geographic reach. This consolidation is expected to continue, further shaping the competitive landscape.
Encapsulated Food Market Industry Trends & Insights
The encapsulated food market is experiencing robust growth, driven by several key factors. The increasing demand for functional foods and dietary supplements, enriched with vitamins, minerals, probiotics, and other beneficial compounds, is a primary growth driver. Technological advancements in encapsulation techniques, particularly nanoencapsulation, allow for enhanced delivery and improved product stability, expanding applications across diverse food categories. Consumer preference for convenient and shelf-stable food products also boosts market demand. The market penetration of encapsulated foods varies by region and product type; however, a steady increase in adoption across developed and developing economies is observed. The CAGR for the period 2025-2033 is projected at XX%, demonstrating significant growth potential. This growth, however, is not uniform across all segments. The competitive landscape, marked by the continuous development of new technologies and product formulations, ensures a dynamic and evolving market. The changing regulatory landscape influences the market's trajectory as well, introducing both opportunities and challenges.
Dominant Markets & Segments in Encapsulated Food Market
The North American region currently holds a dominant position in the global encapsulated food market, driven by high consumer demand for functional foods and strong presence of major players. Within the market segments:
- By Technology: Microencapsulation currently holds the largest market share, due to its established technology and relatively lower cost compared to nanoencapsulation. However, nanoencapsulation is experiencing rapid growth due to its superior efficacy. Hybrid technologies are emerging as a promising segment, combining the advantages of both micro- and nanoencapsulation.
- By Material Type: Polysaccharides are the most widely used encapsulating material, owing to their biocompatibility and cost-effectiveness. Proteins are gaining traction due to their excellent functional properties.
- By Core Phase: Vitamins and probiotics are major drivers of market growth, reflecting the growing health-conscious consumer base. Minerals and essential oils are also significant segments, demonstrating consistent growth.
Key drivers of regional dominance include robust economic growth, favorable regulatory environments, and well-established food processing infrastructure.
Encapsulated Food Market Product Innovations
Recent innovations in the encapsulated food market focus on developing novel encapsulation materials with improved biocompatibility, controlled release properties, and enhanced stability. This includes the use of biodegradable and sustainable materials to address growing environmental concerns. New applications are emerging in areas such as personalized nutrition, targeted delivery of bioactive compounds, and enhanced sensory attributes of food products. The competitive advantage lies in delivering superior efficacy, stability, and consumer appeal, utilizing these innovative technologies to cater to specific market demands and trends.
Report Segmentation & Scope
This report comprehensively segments the encapsulated food market across three key aspects:
By Technology: Microencapsulation, Nanoencapsulation, and Hybrid Technologies, each segment exhibiting different growth trajectories and competitive landscapes. Microencapsulation holds a significant share, while nanoencapsulation is poised for rapid growth, and hybrid technologies are creating unique opportunities.
By Material Type: Polysaccharides, Proteins, Lipids, Emulsifiers, and Other Shell Materials. Each material type offers specific advantages in terms of cost, functionality, and biocompatibility influencing market share and adoption rates.
By Core Phase: Vitamins, Minerals, Enzymes, Organic Acids, Additives, Probiotics, Prebiotics, Essential Oils, and Other Core Phase Materials. Each core phase material targets specific functionalities, impacting overall growth and segment-specific dynamics. Market sizes and growth projections for each segment are detailed within the full report.
Key Drivers of Encapsulated Food Market Growth
Several key factors propel the growth of the encapsulated food market. These include the rising demand for functional foods and supplements, driven by increasing health consciousness. Technological advancements, such as improved encapsulation techniques and the development of novel biocompatible materials, enhance product efficacy and stability. Favorable regulatory policies in certain regions also support market expansion. Finally, the growing adoption of encapsulated foods by food and beverage manufacturers contributes to market growth, particularly within the convenience food segment.
Challenges in the Encapsulated Food Market Sector
Despite significant growth potential, the encapsulated food market faces challenges. High production costs associated with advanced encapsulation technologies can hinder market expansion, particularly in price-sensitive regions. Stringent regulatory approvals for new materials and technologies can create barriers to market entry. Supply chain disruptions can impact raw material availability and production efficiency. Intense competition among existing players and the emergence of new market entrants also create pressure on pricing and profit margins.
Leading Players in the Encapsulated Food Market Market
- Cargill Incorporated
- Encapsys LLC
- Frieslandcampina Kievit
- BASF SE
- DuPont
- ADVANCED BIONUTRITION CORP
- Ingredion Incorporated
- GAT Food Essentials GmbH
Key Developments in Encapsulated Food Market Sector
- 2022 Q4: Cargill Incorporated launched a new line of microencapsulated probiotics for dairy applications.
- 2023 Q1: BASF SE announced a strategic partnership to develop sustainable encapsulation materials.
- 2023 Q2: A major M&A deal involving two key players in the nanoencapsulation technology sector reshaped the competitive landscape (Deal Value: $XX Million).
Strategic Encapsulated Food Market Market Outlook
The encapsulated food market is poised for significant growth in the coming years, fueled by continued innovation in encapsulation technologies, expanding applications across diverse food categories, and rising consumer demand for functional foods. Strategic opportunities exist in developing sustainable and cost-effective encapsulation materials, exploring new applications in personalized nutrition, and expanding into emerging markets. Focus on product innovation and strategic partnerships will be crucial for companies to succeed in this dynamic market.
Encapsulated Food Market Segmentation
-
1. Technology
- 1.1. Microencapsulation
- 1.2. Nano encapsulation
- 1.3. Hybrid technologies
-
2. Material Type
- 2.1. Polysaccharides
- 2.2. Proteins
- 2.3. Lipids
- 2.4. Emulsifiers
- 2.5. Other Shell Materials
-
3. Core Phase
- 3.1. Vitamins
- 3.2. Minerals
- 3.3. Enzymes
- 3.4. Organic Acids
- 3.5. Additives
- 3.6. Probiotics
- 3.7. Prebiotics
- 3.8. Essential oils
- 3.9. Other Core Phase Materials
Encapsulated Food Market Segmentation By Geography
-
1. North America
- 1.1. United States
- 1.2. Canada
- 1.3. Mexico
- 1.4. Rest of North America
-
2. Europe
- 2.1. United Kingdom
- 2.2. Germany
- 2.3. France
- 2.4. Russia
- 2.5. Italy
- 2.6. Spain
- 2.7. Rest of Europe
-
3. Asia Pacific
- 3.1. India
- 3.2. China
- 3.3. Japan
- 3.4. Australia
- 3.5. Rest of Asia Pacific
-
4. South America
- 4.1. Brazil
- 4.2. Argentina
- 4.3. Rest of South America
- 5. Middle East
-
6. South Africa
- 6.1. Saudi Arabia
- 6.2. Rest of Middle East
Encapsulated Food Market REPORT HIGHLIGHTS
| Aspects | Details |
|---|---|
| Study Period | 2019-2033 |
| Base Year | 2024 |
| Estimated Year | 2025 |
| Forecast Period | 2025-2033 |
| Historical Period | 2019-2024 |
| Growth Rate | CAGR of 6.12% from 2019-2033 |
| Segmentation |
|
Table of Contents
- 1. Introduction
- 1.1. Research Scope
- 1.2. Market Segmentation
- 1.3. Research Methodology
- 1.4. Definitions and Assumptions
- 2. Executive Summary
- 2.1. Introduction
- 3. Market Dynamics
- 3.1. Introduction
- 3.2. Market Drivers
- 3.2.1. Awareness of Health Benefits Associated with Tocotrienol; Escalating Demand for Anti-Aging Products Containing Tocotrienol
- 3.3. Market Restrains
- 3.3.1. Availability of Substitutes
- 3.4. Market Trends
- 3.4.1. Growing Demand of Dietary Supplement
- 4. Market Factor Analysis
- 4.1. Porters Five Forces
- 4.2. Supply/Value Chain
- 4.3. PESTEL analysis
- 4.4. Market Entropy
- 4.5. Patent/Trademark Analysis
- 5. Global Encapsulated Food Market Analysis, Insights and Forecast, 2019-2031
- 5.1. Market Analysis, Insights and Forecast - by Technology
- 5.1.1. Microencapsulation
- 5.1.2. Nano encapsulation
- 5.1.3. Hybrid technologies
- 5.2. Market Analysis, Insights and Forecast - by Material Type
- 5.2.1. Polysaccharides
- 5.2.2. Proteins
- 5.2.3. Lipids
- 5.2.4. Emulsifiers
- 5.2.5. Other Shell Materials
- 5.3. Market Analysis, Insights and Forecast - by Core Phase
- 5.3.1. Vitamins
- 5.3.2. Minerals
- 5.3.3. Enzymes
- 5.3.4. Organic Acids
- 5.3.5. Additives
- 5.3.6. Probiotics
- 5.3.7. Prebiotics
- 5.3.8. Essential oils
- 5.3.9. Other Core Phase Materials
- 5.4. Market Analysis, Insights and Forecast - by Region
- 5.4.1. North America
- 5.4.2. Europe
- 5.4.3. Asia Pacific
- 5.4.4. South America
- 5.4.5. Middle East
- 5.4.6. South Africa
- 5.1. Market Analysis, Insights and Forecast - by Technology
- 6. North America Encapsulated Food Market Analysis, Insights and Forecast, 2019-2031
- 6.1. Market Analysis, Insights and Forecast - by Technology
- 6.1.1. Microencapsulation
- 6.1.2. Nano encapsulation
- 6.1.3. Hybrid technologies
- 6.2. Market Analysis, Insights and Forecast - by Material Type
- 6.2.1. Polysaccharides
- 6.2.2. Proteins
- 6.2.3. Lipids
- 6.2.4. Emulsifiers
- 6.2.5. Other Shell Materials
- 6.3. Market Analysis, Insights and Forecast - by Core Phase
- 6.3.1. Vitamins
- 6.3.2. Minerals
- 6.3.3. Enzymes
- 6.3.4. Organic Acids
- 6.3.5. Additives
- 6.3.6. Probiotics
- 6.3.7. Prebiotics
- 6.3.8. Essential oils
- 6.3.9. Other Core Phase Materials
- 6.1. Market Analysis, Insights and Forecast - by Technology
- 7. Europe Encapsulated Food Market Analysis, Insights and Forecast, 2019-2031
- 7.1. Market Analysis, Insights and Forecast - by Technology
- 7.1.1. Microencapsulation
- 7.1.2. Nano encapsulation
- 7.1.3. Hybrid technologies
- 7.2. Market Analysis, Insights and Forecast - by Material Type
- 7.2.1. Polysaccharides
- 7.2.2. Proteins
- 7.2.3. Lipids
- 7.2.4. Emulsifiers
- 7.2.5. Other Shell Materials
- 7.3. Market Analysis, Insights and Forecast - by Core Phase
- 7.3.1. Vitamins
- 7.3.2. Minerals
- 7.3.3. Enzymes
- 7.3.4. Organic Acids
- 7.3.5. Additives
- 7.3.6. Probiotics
- 7.3.7. Prebiotics
- 7.3.8. Essential oils
- 7.3.9. Other Core Phase Materials
- 7.1. Market Analysis, Insights and Forecast - by Technology
- 8. Asia Pacific Encapsulated Food Market Analysis, Insights and Forecast, 2019-2031
- 8.1. Market Analysis, Insights and Forecast - by Technology
- 8.1.1. Microencapsulation
- 8.1.2. Nano encapsulation
- 8.1.3. Hybrid technologies
- 8.2. Market Analysis, Insights and Forecast - by Material Type
- 8.2.1. Polysaccharides
- 8.2.2. Proteins
- 8.2.3. Lipids
- 8.2.4. Emulsifiers
- 8.2.5. Other Shell Materials
- 8.3. Market Analysis, Insights and Forecast - by Core Phase
- 8.3.1. Vitamins
- 8.3.2. Minerals
- 8.3.3. Enzymes
- 8.3.4. Organic Acids
- 8.3.5. Additives
- 8.3.6. Probiotics
- 8.3.7. Prebiotics
- 8.3.8. Essential oils
- 8.3.9. Other Core Phase Materials
- 8.1. Market Analysis, Insights and Forecast - by Technology
- 9. South America Encapsulated Food Market Analysis, Insights and Forecast, 2019-2031
- 9.1. Market Analysis, Insights and Forecast - by Technology
- 9.1.1. Microencapsulation
- 9.1.2. Nano encapsulation
- 9.1.3. Hybrid technologies
- 9.2. Market Analysis, Insights and Forecast - by Material Type
- 9.2.1. Polysaccharides
- 9.2.2. Proteins
- 9.2.3. Lipids
- 9.2.4. Emulsifiers
- 9.2.5. Other Shell Materials
- 9.3. Market Analysis, Insights and Forecast - by Core Phase
- 9.3.1. Vitamins
- 9.3.2. Minerals
- 9.3.3. Enzymes
- 9.3.4. Organic Acids
- 9.3.5. Additives
- 9.3.6. Probiotics
- 9.3.7. Prebiotics
- 9.3.8. Essential oils
- 9.3.9. Other Core Phase Materials
- 9.1. Market Analysis, Insights and Forecast - by Technology
- 10. Middle East Encapsulated Food Market Analysis, Insights and Forecast, 2019-2031
- 10.1. Market Analysis, Insights and Forecast - by Technology
- 10.1.1. Microencapsulation
- 10.1.2. Nano encapsulation
- 10.1.3. Hybrid technologies
- 10.2. Market Analysis, Insights and Forecast - by Material Type
- 10.2.1. Polysaccharides
- 10.2.2. Proteins
- 10.2.3. Lipids
- 10.2.4. Emulsifiers
- 10.2.5. Other Shell Materials
- 10.3. Market Analysis, Insights and Forecast - by Core Phase
- 10.3.1. Vitamins
- 10.3.2. Minerals
- 10.3.3. Enzymes
- 10.3.4. Organic Acids
- 10.3.5. Additives
- 10.3.6. Probiotics
- 10.3.7. Prebiotics
- 10.3.8. Essential oils
- 10.3.9. Other Core Phase Materials
- 10.1. Market Analysis, Insights and Forecast - by Technology
- 11. South Africa Encapsulated Food Market Analysis, Insights and Forecast, 2019-2031
- 11.1. Market Analysis, Insights and Forecast - by Technology
- 11.1.1. Microencapsulation
- 11.1.2. Nano encapsulation
- 11.1.3. Hybrid technologies
- 11.2. Market Analysis, Insights and Forecast - by Material Type
- 11.2.1. Polysaccharides
- 11.2.2. Proteins
- 11.2.3. Lipids
- 11.2.4. Emulsifiers
- 11.2.5. Other Shell Materials
- 11.3. Market Analysis, Insights and Forecast - by Core Phase
- 11.3.1. Vitamins
- 11.3.2. Minerals
- 11.3.3. Enzymes
- 11.3.4. Organic Acids
- 11.3.5. Additives
- 11.3.6. Probiotics
- 11.3.7. Prebiotics
- 11.3.8. Essential oils
- 11.3.9. Other Core Phase Materials
- 11.1. Market Analysis, Insights and Forecast - by Technology
- 12. North America Encapsulated Food Market Analysis, Insights and Forecast, 2019-2031
- 12.1. Market Analysis, Insights and Forecast - By Country/Sub-region
- 12.1.1 United States
- 12.1.2 Canada
- 12.1.3 Mexico
- 12.1.4 Rest of North America
- 13. Europe Encapsulated Food Market Analysis, Insights and Forecast, 2019-2031
- 13.1. Market Analysis, Insights and Forecast - By Country/Sub-region
- 13.1.1 United Kingdom
- 13.1.2 Germany
- 13.1.3 France
- 13.1.4 Russia
- 13.1.5 Italy
- 13.1.6 Spain
- 13.1.7 Rest of Europe
- 14. Asia Pacific Encapsulated Food Market Analysis, Insights and Forecast, 2019-2031
- 14.1. Market Analysis, Insights and Forecast - By Country/Sub-region
- 14.1.1 India
- 14.1.2 China
- 14.1.3 Japan
- 14.1.4 Australia
- 14.1.5 Rest of Asia Pacific
- 15. South America Encapsulated Food Market Analysis, Insights and Forecast, 2019-2031
- 15.1. Market Analysis, Insights and Forecast - By Country/Sub-region
- 15.1.1 Brazil
- 15.1.2 Argentina
- 15.1.3 Rest of South America
- 16. Middle East & Africa Encapsulated Food Market Analysis, Insights and Forecast, 2019-2031
- 16.1. Market Analysis, Insights and Forecast - By Country/Sub-region
- 16.1.1 UAE
- 16.1.2 South Africa
- 16.1.3 Saudi Arabia
- 16.1.4 Rest of MEA
- 17. Competitive Analysis
- 17.1. Global Market Share Analysis 2024
- 17.2. Company Profiles
- 17.2.1 Cargill Incorporated
- 17.2.1.1. Overview
- 17.2.1.2. Products
- 17.2.1.3. SWOT Analysis
- 17.2.1.4. Recent Developments
- 17.2.1.5. Financials (Based on Availability)
- 17.2.2 Encapsys LLC
- 17.2.2.1. Overview
- 17.2.2.2. Products
- 17.2.2.3. SWOT Analysis
- 17.2.2.4. Recent Developments
- 17.2.2.5. Financials (Based on Availability)
- 17.2.3 Frieslandcampina Kievit*List Not Exhaustive
- 17.2.3.1. Overview
- 17.2.3.2. Products
- 17.2.3.3. SWOT Analysis
- 17.2.3.4. Recent Developments
- 17.2.3.5. Financials (Based on Availability)
- 17.2.4 BASF SE
- 17.2.4.1. Overview
- 17.2.4.2. Products
- 17.2.4.3. SWOT Analysis
- 17.2.4.4. Recent Developments
- 17.2.4.5. Financials (Based on Availability)
- 17.2.5 DuPont
- 17.2.5.1. Overview
- 17.2.5.2. Products
- 17.2.5.3. SWOT Analysis
- 17.2.5.4. Recent Developments
- 17.2.5.5. Financials (Based on Availability)
- 17.2.6 ADVANCED BIONUTRITION CORP
- 17.2.6.1. Overview
- 17.2.6.2. Products
- 17.2.6.3. SWOT Analysis
- 17.2.6.4. Recent Developments
- 17.2.6.5. Financials (Based on Availability)
- 17.2.7 Ingredion Incorporated
- 17.2.7.1. Overview
- 17.2.7.2. Products
- 17.2.7.3. SWOT Analysis
- 17.2.7.4. Recent Developments
- 17.2.7.5. Financials (Based on Availability)
- 17.2.8 GAT Food Essentials GmbH
- 17.2.8.1. Overview
- 17.2.8.2. Products
- 17.2.8.3. SWOT Analysis
- 17.2.8.4. Recent Developments
- 17.2.8.5. Financials (Based on Availability)
- 17.2.1 Cargill Incorporated
List of Figures
- Figure 1: Global Encapsulated Food Market Revenue Breakdown (Million, %) by Region 2024 & 2032
- Figure 2: Global Encapsulated Food Market Volume Breakdown (Tons, %) by Region 2024 & 2032
- Figure 3: North America Encapsulated Food Market Revenue (Million), by Country 2024 & 2032
- Figure 4: North America Encapsulated Food Market Volume (Tons), by Country 2024 & 2032
- Figure 5: North America Encapsulated Food Market Revenue Share (%), by Country 2024 & 2032
- Figure 6: North America Encapsulated Food Market Volume Share (%), by Country 2024 & 2032
- Figure 7: Europe Encapsulated Food Market Revenue (Million), by Country 2024 & 2032
- Figure 8: Europe Encapsulated Food Market Volume (Tons), by Country 2024 & 2032
- Figure 9: Europe Encapsulated Food Market Revenue Share (%), by Country 2024 & 2032
- Figure 10: Europe Encapsulated Food Market Volume Share (%), by Country 2024 & 2032
- Figure 11: Asia Pacific Encapsulated Food Market Revenue (Million), by Country 2024 & 2032
- Figure 12: Asia Pacific Encapsulated Food Market Volume (Tons), by Country 2024 & 2032
- Figure 13: Asia Pacific Encapsulated Food Market Revenue Share (%), by Country 2024 & 2032
- Figure 14: Asia Pacific Encapsulated Food Market Volume Share (%), by Country 2024 & 2032
- Figure 15: South America Encapsulated Food Market Revenue (Million), by Country 2024 & 2032
- Figure 16: South America Encapsulated Food Market Volume (Tons), by Country 2024 & 2032
- Figure 17: South America Encapsulated Food Market Revenue Share (%), by Country 2024 & 2032
- Figure 18: South America Encapsulated Food Market Volume Share (%), by Country 2024 & 2032
- Figure 19: Middle East & Africa Encapsulated Food Market Revenue (Million), by Country 2024 & 2032
- Figure 20: Middle East & Africa Encapsulated Food Market Volume (Tons), by Country 2024 & 2032
- Figure 21: Middle East & Africa Encapsulated Food Market Revenue Share (%), by Country 2024 & 2032
- Figure 22: Middle East & Africa Encapsulated Food Market Volume Share (%), by Country 2024 & 2032
- Figure 23: North America Encapsulated Food Market Revenue (Million), by Technology 2024 & 2032
- Figure 24: North America Encapsulated Food Market Volume (Tons), by Technology 2024 & 2032
- Figure 25: North America Encapsulated Food Market Revenue Share (%), by Technology 2024 & 2032
- Figure 26: North America Encapsulated Food Market Volume Share (%), by Technology 2024 & 2032
- Figure 27: North America Encapsulated Food Market Revenue (Million), by Material Type 2024 & 2032
- Figure 28: North America Encapsulated Food Market Volume (Tons), by Material Type 2024 & 2032
- Figure 29: North America Encapsulated Food Market Revenue Share (%), by Material Type 2024 & 2032
- Figure 30: North America Encapsulated Food Market Volume Share (%), by Material Type 2024 & 2032
- Figure 31: North America Encapsulated Food Market Revenue (Million), by Core Phase 2024 & 2032
- Figure 32: North America Encapsulated Food Market Volume (Tons), by Core Phase 2024 & 2032
- Figure 33: North America Encapsulated Food Market Revenue Share (%), by Core Phase 2024 & 2032
- Figure 34: North America Encapsulated Food Market Volume Share (%), by Core Phase 2024 & 2032
- Figure 35: North America Encapsulated Food Market Revenue (Million), by Country 2024 & 2032
- Figure 36: North America Encapsulated Food Market Volume (Tons), by Country 2024 & 2032
- Figure 37: North America Encapsulated Food Market Revenue Share (%), by Country 2024 & 2032
- Figure 38: North America Encapsulated Food Market Volume Share (%), by Country 2024 & 2032
- Figure 39: Europe Encapsulated Food Market Revenue (Million), by Technology 2024 & 2032
- Figure 40: Europe Encapsulated Food Market Volume (Tons), by Technology 2024 & 2032
- Figure 41: Europe Encapsulated Food Market Revenue Share (%), by Technology 2024 & 2032
- Figure 42: Europe Encapsulated Food Market Volume Share (%), by Technology 2024 & 2032
- Figure 43: Europe Encapsulated Food Market Revenue (Million), by Material Type 2024 & 2032
- Figure 44: Europe Encapsulated Food Market Volume (Tons), by Material Type 2024 & 2032
- Figure 45: Europe Encapsulated Food Market Revenue Share (%), by Material Type 2024 & 2032
- Figure 46: Europe Encapsulated Food Market Volume Share (%), by Material Type 2024 & 2032
- Figure 47: Europe Encapsulated Food Market Revenue (Million), by Core Phase 2024 & 2032
- Figure 48: Europe Encapsulated Food Market Volume (Tons), by Core Phase 2024 & 2032
- Figure 49: Europe Encapsulated Food Market Revenue Share (%), by Core Phase 2024 & 2032
- Figure 50: Europe Encapsulated Food Market Volume Share (%), by Core Phase 2024 & 2032
- Figure 51: Europe Encapsulated Food Market Revenue (Million), by Country 2024 & 2032
- Figure 52: Europe Encapsulated Food Market Volume (Tons), by Country 2024 & 2032
- Figure 53: Europe Encapsulated Food Market Revenue Share (%), by Country 2024 & 2032
- Figure 54: Europe Encapsulated Food Market Volume Share (%), by Country 2024 & 2032
- Figure 55: Asia Pacific Encapsulated Food Market Revenue (Million), by Technology 2024 & 2032
- Figure 56: Asia Pacific Encapsulated Food Market Volume (Tons), by Technology 2024 & 2032
- Figure 57: Asia Pacific Encapsulated Food Market Revenue Share (%), by Technology 2024 & 2032
- Figure 58: Asia Pacific Encapsulated Food Market Volume Share (%), by Technology 2024 & 2032
- Figure 59: Asia Pacific Encapsulated Food Market Revenue (Million), by Material Type 2024 & 2032
- Figure 60: Asia Pacific Encapsulated Food Market Volume (Tons), by Material Type 2024 & 2032
- Figure 61: Asia Pacific Encapsulated Food Market Revenue Share (%), by Material Type 2024 & 2032
- Figure 62: Asia Pacific Encapsulated Food Market Volume Share (%), by Material Type 2024 & 2032
- Figure 63: Asia Pacific Encapsulated Food Market Revenue (Million), by Core Phase 2024 & 2032
- Figure 64: Asia Pacific Encapsulated Food Market Volume (Tons), by Core Phase 2024 & 2032
- Figure 65: Asia Pacific Encapsulated Food Market Revenue Share (%), by Core Phase 2024 & 2032
- Figure 66: Asia Pacific Encapsulated Food Market Volume Share (%), by Core Phase 2024 & 2032
- Figure 67: Asia Pacific Encapsulated Food Market Revenue (Million), by Country 2024 & 2032
- Figure 68: Asia Pacific Encapsulated Food Market Volume (Tons), by Country 2024 & 2032
- Figure 69: Asia Pacific Encapsulated Food Market Revenue Share (%), by Country 2024 & 2032
- Figure 70: Asia Pacific Encapsulated Food Market Volume Share (%), by Country 2024 & 2032
- Figure 71: South America Encapsulated Food Market Revenue (Million), by Technology 2024 & 2032
- Figure 72: South America Encapsulated Food Market Volume (Tons), by Technology 2024 & 2032
- Figure 73: South America Encapsulated Food Market Revenue Share (%), by Technology 2024 & 2032
- Figure 74: South America Encapsulated Food Market Volume Share (%), by Technology 2024 & 2032
- Figure 75: South America Encapsulated Food Market Revenue (Million), by Material Type 2024 & 2032
- Figure 76: South America Encapsulated Food Market Volume (Tons), by Material Type 2024 & 2032
- Figure 77: South America Encapsulated Food Market Revenue Share (%), by Material Type 2024 & 2032
- Figure 78: South America Encapsulated Food Market Volume Share (%), by Material Type 2024 & 2032
- Figure 79: South America Encapsulated Food Market Revenue (Million), by Core Phase 2024 & 2032
- Figure 80: South America Encapsulated Food Market Volume (Tons), by Core Phase 2024 & 2032
- Figure 81: South America Encapsulated Food Market Revenue Share (%), by Core Phase 2024 & 2032
- Figure 82: South America Encapsulated Food Market Volume Share (%), by Core Phase 2024 & 2032
- Figure 83: South America Encapsulated Food Market Revenue (Million), by Country 2024 & 2032
- Figure 84: South America Encapsulated Food Market Volume (Tons), by Country 2024 & 2032
- Figure 85: South America Encapsulated Food Market Revenue Share (%), by Country 2024 & 2032
- Figure 86: South America Encapsulated Food Market Volume Share (%), by Country 2024 & 2032
- Figure 87: Middle East Encapsulated Food Market Revenue (Million), by Technology 2024 & 2032
- Figure 88: Middle East Encapsulated Food Market Volume (Tons), by Technology 2024 & 2032
- Figure 89: Middle East Encapsulated Food Market Revenue Share (%), by Technology 2024 & 2032
- Figure 90: Middle East Encapsulated Food Market Volume Share (%), by Technology 2024 & 2032
- Figure 91: Middle East Encapsulated Food Market Revenue (Million), by Material Type 2024 & 2032
- Figure 92: Middle East Encapsulated Food Market Volume (Tons), by Material Type 2024 & 2032
- Figure 93: Middle East Encapsulated Food Market Revenue Share (%), by Material Type 2024 & 2032
- Figure 94: Middle East Encapsulated Food Market Volume Share (%), by Material Type 2024 & 2032
- Figure 95: Middle East Encapsulated Food Market Revenue (Million), by Core Phase 2024 & 2032
- Figure 96: Middle East Encapsulated Food Market Volume (Tons), by Core Phase 2024 & 2032
- Figure 97: Middle East Encapsulated Food Market Revenue Share (%), by Core Phase 2024 & 2032
- Figure 98: Middle East Encapsulated Food Market Volume Share (%), by Core Phase 2024 & 2032
- Figure 99: Middle East Encapsulated Food Market Revenue (Million), by Country 2024 & 2032
- Figure 100: Middle East Encapsulated Food Market Volume (Tons), by Country 2024 & 2032
- Figure 101: Middle East Encapsulated Food Market Revenue Share (%), by Country 2024 & 2032
- Figure 102: Middle East Encapsulated Food Market Volume Share (%), by Country 2024 & 2032
- Figure 103: South Africa Encapsulated Food Market Revenue (Million), by Technology 2024 & 2032
- Figure 104: South Africa Encapsulated Food Market Volume (Tons), by Technology 2024 & 2032
- Figure 105: South Africa Encapsulated Food Market Revenue Share (%), by Technology 2024 & 2032
- Figure 106: South Africa Encapsulated Food Market Volume Share (%), by Technology 2024 & 2032
- Figure 107: South Africa Encapsulated Food Market Revenue (Million), by Material Type 2024 & 2032
- Figure 108: South Africa Encapsulated Food Market Volume (Tons), by Material Type 2024 & 2032
- Figure 109: South Africa Encapsulated Food Market Revenue Share (%), by Material Type 2024 & 2032
- Figure 110: South Africa Encapsulated Food Market Volume Share (%), by Material Type 2024 & 2032
- Figure 111: South Africa Encapsulated Food Market Revenue (Million), by Core Phase 2024 & 2032
- Figure 112: South Africa Encapsulated Food Market Volume (Tons), by Core Phase 2024 & 2032
- Figure 113: South Africa Encapsulated Food Market Revenue Share (%), by Core Phase 2024 & 2032
- Figure 114: South Africa Encapsulated Food Market Volume Share (%), by Core Phase 2024 & 2032
- Figure 115: South Africa Encapsulated Food Market Revenue (Million), by Country 2024 & 2032
- Figure 116: South Africa Encapsulated Food Market Volume (Tons), by Country 2024 & 2032
- Figure 117: South Africa Encapsulated Food Market Revenue Share (%), by Country 2024 & 2032
- Figure 118: South Africa Encapsulated Food Market Volume Share (%), by Country 2024 & 2032
List of Tables
- Table 1: Global Encapsulated Food Market Revenue Million Forecast, by Region 2019 & 2032
- Table 2: Global Encapsulated Food Market Volume Tons Forecast, by Region 2019 & 2032
- Table 3: Global Encapsulated Food Market Revenue Million Forecast, by Technology 2019 & 2032
- Table 4: Global Encapsulated Food Market Volume Tons Forecast, by Technology 2019 & 2032
- Table 5: Global Encapsulated Food Market Revenue Million Forecast, by Material Type 2019 & 2032
- Table 6: Global Encapsulated Food Market Volume Tons Forecast, by Material Type 2019 & 2032
- Table 7: Global Encapsulated Food Market Revenue Million Forecast, by Core Phase 2019 & 2032
- Table 8: Global Encapsulated Food Market Volume Tons Forecast, by Core Phase 2019 & 2032
- Table 9: Global Encapsulated Food Market Revenue Million Forecast, by Region 2019 & 2032
- Table 10: Global Encapsulated Food Market Volume Tons Forecast, by Region 2019 & 2032
- Table 11: Global Encapsulated Food Market Revenue Million Forecast, by Country 2019 & 2032
- Table 12: Global Encapsulated Food Market Volume Tons Forecast, by Country 2019 & 2032
- Table 13: United States Encapsulated Food Market Revenue (Million) Forecast, by Application 2019 & 2032
- Table 14: United States Encapsulated Food Market Volume (Tons) Forecast, by Application 2019 & 2032
- Table 15: Canada Encapsulated Food Market Revenue (Million) Forecast, by Application 2019 & 2032
- Table 16: Canada Encapsulated Food Market Volume (Tons) Forecast, by Application 2019 & 2032
- Table 17: Mexico Encapsulated Food Market Revenue (Million) Forecast, by Application 2019 & 2032
- Table 18: Mexico Encapsulated Food Market Volume (Tons) Forecast, by Application 2019 & 2032
- Table 19: Rest of North America Encapsulated Food Market Revenue (Million) Forecast, by Application 2019 & 2032
- Table 20: Rest of North America Encapsulated Food Market Volume (Tons) Forecast, by Application 2019 & 2032
- Table 21: Global Encapsulated Food Market Revenue Million Forecast, by Country 2019 & 2032
- Table 22: Global Encapsulated Food Market Volume Tons Forecast, by Country 2019 & 2032
- Table 23: United Kingdom Encapsulated Food Market Revenue (Million) Forecast, by Application 2019 & 2032
- Table 24: United Kingdom Encapsulated Food Market Volume (Tons) Forecast, by Application 2019 & 2032
- Table 25: Germany Encapsulated Food Market Revenue (Million) Forecast, by Application 2019 & 2032
- Table 26: Germany Encapsulated Food Market Volume (Tons) Forecast, by Application 2019 & 2032
- Table 27: France Encapsulated Food Market Revenue (Million) Forecast, by Application 2019 & 2032
- Table 28: France Encapsulated Food Market Volume (Tons) Forecast, by Application 2019 & 2032
- Table 29: Russia Encapsulated Food Market Revenue (Million) Forecast, by Application 2019 & 2032
- Table 30: Russia Encapsulated Food Market Volume (Tons) Forecast, by Application 2019 & 2032
- Table 31: Italy Encapsulated Food Market Revenue (Million) Forecast, by Application 2019 & 2032
- Table 32: Italy Encapsulated Food Market Volume (Tons) Forecast, by Application 2019 & 2032
- Table 33: Spain Encapsulated Food Market Revenue (Million) Forecast, by Application 2019 & 2032
- Table 34: Spain Encapsulated Food Market Volume (Tons) Forecast, by Application 2019 & 2032
- Table 35: Rest of Europe Encapsulated Food Market Revenue (Million) Forecast, by Application 2019 & 2032
- Table 36: Rest of Europe Encapsulated Food Market Volume (Tons) Forecast, by Application 2019 & 2032
- Table 37: Global Encapsulated Food Market Revenue Million Forecast, by Country 2019 & 2032
- Table 38: Global Encapsulated Food Market Volume Tons Forecast, by Country 2019 & 2032
- Table 39: India Encapsulated Food Market Revenue (Million) Forecast, by Application 2019 & 2032
- Table 40: India Encapsulated Food Market Volume (Tons) Forecast, by Application 2019 & 2032
- Table 41: China Encapsulated Food Market Revenue (Million) Forecast, by Application 2019 & 2032
- Table 42: China Encapsulated Food Market Volume (Tons) Forecast, by Application 2019 & 2032
- Table 43: Japan Encapsulated Food Market Revenue (Million) Forecast, by Application 2019 & 2032
- Table 44: Japan Encapsulated Food Market Volume (Tons) Forecast, by Application 2019 & 2032
- Table 45: Australia Encapsulated Food Market Revenue (Million) Forecast, by Application 2019 & 2032
- Table 46: Australia Encapsulated Food Market Volume (Tons) Forecast, by Application 2019 & 2032
- Table 47: Rest of Asia Pacific Encapsulated Food Market Revenue (Million) Forecast, by Application 2019 & 2032
- Table 48: Rest of Asia Pacific Encapsulated Food Market Volume (Tons) Forecast, by Application 2019 & 2032
- Table 49: Global Encapsulated Food Market Revenue Million Forecast, by Country 2019 & 2032
- Table 50: Global Encapsulated Food Market Volume Tons Forecast, by Country 2019 & 2032
- Table 51: Brazil Encapsulated Food Market Revenue (Million) Forecast, by Application 2019 & 2032
- Table 52: Brazil Encapsulated Food Market Volume (Tons) Forecast, by Application 2019 & 2032
- Table 53: Argentina Encapsulated Food Market Revenue (Million) Forecast, by Application 2019 & 2032
- Table 54: Argentina Encapsulated Food Market Volume (Tons) Forecast, by Application 2019 & 2032
- Table 55: Rest of South America Encapsulated Food Market Revenue (Million) Forecast, by Application 2019 & 2032
- Table 56: Rest of South America Encapsulated Food Market Volume (Tons) Forecast, by Application 2019 & 2032
- Table 57: Global Encapsulated Food Market Revenue Million Forecast, by Country 2019 & 2032
- Table 58: Global Encapsulated Food Market Volume Tons Forecast, by Country 2019 & 2032
- Table 59: UAE Encapsulated Food Market Revenue (Million) Forecast, by Application 2019 & 2032
- Table 60: UAE Encapsulated Food Market Volume (Tons) Forecast, by Application 2019 & 2032
- Table 61: South Africa Encapsulated Food Market Revenue (Million) Forecast, by Application 2019 & 2032
- Table 62: South Africa Encapsulated Food Market Volume (Tons) Forecast, by Application 2019 & 2032
- Table 63: Saudi Arabia Encapsulated Food Market Revenue (Million) Forecast, by Application 2019 & 2032
- Table 64: Saudi Arabia Encapsulated Food Market Volume (Tons) Forecast, by Application 2019 & 2032
- Table 65: Rest of MEA Encapsulated Food Market Revenue (Million) Forecast, by Application 2019 & 2032
- Table 66: Rest of MEA Encapsulated Food Market Volume (Tons) Forecast, by Application 2019 & 2032
- Table 67: Global Encapsulated Food Market Revenue Million Forecast, by Technology 2019 & 2032
- Table 68: Global Encapsulated Food Market Volume Tons Forecast, by Technology 2019 & 2032
- Table 69: Global Encapsulated Food Market Revenue Million Forecast, by Material Type 2019 & 2032
- Table 70: Global Encapsulated Food Market Volume Tons Forecast, by Material Type 2019 & 2032
- Table 71: Global Encapsulated Food Market Revenue Million Forecast, by Core Phase 2019 & 2032
- Table 72: Global Encapsulated Food Market Volume Tons Forecast, by Core Phase 2019 & 2032
- Table 73: Global Encapsulated Food Market Revenue Million Forecast, by Country 2019 & 2032
- Table 74: Global Encapsulated Food Market Volume Tons Forecast, by Country 2019 & 2032
- Table 75: United States Encapsulated Food Market Revenue (Million) Forecast, by Application 2019 & 2032
- Table 76: United States Encapsulated Food Market Volume (Tons) Forecast, by Application 2019 & 2032
- Table 77: Canada Encapsulated Food Market Revenue (Million) Forecast, by Application 2019 & 2032
- Table 78: Canada Encapsulated Food Market Volume (Tons) Forecast, by Application 2019 & 2032
- Table 79: Mexico Encapsulated Food Market Revenue (Million) Forecast, by Application 2019 & 2032
- Table 80: Mexico Encapsulated Food Market Volume (Tons) Forecast, by Application 2019 & 2032
- Table 81: Rest of North America Encapsulated Food Market Revenue (Million) Forecast, by Application 2019 & 2032
- Table 82: Rest of North America Encapsulated Food Market Volume (Tons) Forecast, by Application 2019 & 2032
- Table 83: Global Encapsulated Food Market Revenue Million Forecast, by Technology 2019 & 2032
- Table 84: Global Encapsulated Food Market Volume Tons Forecast, by Technology 2019 & 2032
- Table 85: Global Encapsulated Food Market Revenue Million Forecast, by Material Type 2019 & 2032
- Table 86: Global Encapsulated Food Market Volume Tons Forecast, by Material Type 2019 & 2032
- Table 87: Global Encapsulated Food Market Revenue Million Forecast, by Core Phase 2019 & 2032
- Table 88: Global Encapsulated Food Market Volume Tons Forecast, by Core Phase 2019 & 2032
- Table 89: Global Encapsulated Food Market Revenue Million Forecast, by Country 2019 & 2032
- Table 90: Global Encapsulated Food Market Volume Tons Forecast, by Country 2019 & 2032
- Table 91: United Kingdom Encapsulated Food Market Revenue (Million) Forecast, by Application 2019 & 2032
- Table 92: United Kingdom Encapsulated Food Market Volume (Tons) Forecast, by Application 2019 & 2032
- Table 93: Germany Encapsulated Food Market Revenue (Million) Forecast, by Application 2019 & 2032
- Table 94: Germany Encapsulated Food Market Volume (Tons) Forecast, by Application 2019 & 2032
- Table 95: France Encapsulated Food Market Revenue (Million) Forecast, by Application 2019 & 2032
- Table 96: France Encapsulated Food Market Volume (Tons) Forecast, by Application 2019 & 2032
- Table 97: Russia Encapsulated Food Market Revenue (Million) Forecast, by Application 2019 & 2032
- Table 98: Russia Encapsulated Food Market Volume (Tons) Forecast, by Application 2019 & 2032
- Table 99: Italy Encapsulated Food Market Revenue (Million) Forecast, by Application 2019 & 2032
- Table 100: Italy Encapsulated Food Market Volume (Tons) Forecast, by Application 2019 & 2032
- Table 101: Spain Encapsulated Food Market Revenue (Million) Forecast, by Application 2019 & 2032
- Table 102: Spain Encapsulated Food Market Volume (Tons) Forecast, by Application 2019 & 2032
- Table 103: Rest of Europe Encapsulated Food Market Revenue (Million) Forecast, by Application 2019 & 2032
- Table 104: Rest of Europe Encapsulated Food Market Volume (Tons) Forecast, by Application 2019 & 2032
- Table 105: Global Encapsulated Food Market Revenue Million Forecast, by Technology 2019 & 2032
- Table 106: Global Encapsulated Food Market Volume Tons Forecast, by Technology 2019 & 2032
- Table 107: Global Encapsulated Food Market Revenue Million Forecast, by Material Type 2019 & 2032
- Table 108: Global Encapsulated Food Market Volume Tons Forecast, by Material Type 2019 & 2032
- Table 109: Global Encapsulated Food Market Revenue Million Forecast, by Core Phase 2019 & 2032
- Table 110: Global Encapsulated Food Market Volume Tons Forecast, by Core Phase 2019 & 2032
- Table 111: Global Encapsulated Food Market Revenue Million Forecast, by Country 2019 & 2032
- Table 112: Global Encapsulated Food Market Volume Tons Forecast, by Country 2019 & 2032
- Table 113: India Encapsulated Food Market Revenue (Million) Forecast, by Application 2019 & 2032
- Table 114: India Encapsulated Food Market Volume (Tons) Forecast, by Application 2019 & 2032
- Table 115: China Encapsulated Food Market Revenue (Million) Forecast, by Application 2019 & 2032
- Table 116: China Encapsulated Food Market Volume (Tons) Forecast, by Application 2019 & 2032
- Table 117: Japan Encapsulated Food Market Revenue (Million) Forecast, by Application 2019 & 2032
- Table 118: Japan Encapsulated Food Market Volume (Tons) Forecast, by Application 2019 & 2032
- Table 119: Australia Encapsulated Food Market Revenue (Million) Forecast, by Application 2019 & 2032
- Table 120: Australia Encapsulated Food Market Volume (Tons) Forecast, by Application 2019 & 2032
- Table 121: Rest of Asia Pacific Encapsulated Food Market Revenue (Million) Forecast, by Application 2019 & 2032
- Table 122: Rest of Asia Pacific Encapsulated Food Market Volume (Tons) Forecast, by Application 2019 & 2032
- Table 123: Global Encapsulated Food Market Revenue Million Forecast, by Technology 2019 & 2032
- Table 124: Global Encapsulated Food Market Volume Tons Forecast, by Technology 2019 & 2032
- Table 125: Global Encapsulated Food Market Revenue Million Forecast, by Material Type 2019 & 2032
- Table 126: Global Encapsulated Food Market Volume Tons Forecast, by Material Type 2019 & 2032
- Table 127: Global Encapsulated Food Market Revenue Million Forecast, by Core Phase 2019 & 2032
- Table 128: Global Encapsulated Food Market Volume Tons Forecast, by Core Phase 2019 & 2032
- Table 129: Global Encapsulated Food Market Revenue Million Forecast, by Country 2019 & 2032
- Table 130: Global Encapsulated Food Market Volume Tons Forecast, by Country 2019 & 2032
- Table 131: Brazil Encapsulated Food Market Revenue (Million) Forecast, by Application 2019 & 2032
- Table 132: Brazil Encapsulated Food Market Volume (Tons) Forecast, by Application 2019 & 2032
- Table 133: Argentina Encapsulated Food Market Revenue (Million) Forecast, by Application 2019 & 2032
- Table 134: Argentina Encapsulated Food Market Volume (Tons) Forecast, by Application 2019 & 2032
- Table 135: Rest of South America Encapsulated Food Market Revenue (Million) Forecast, by Application 2019 & 2032
- Table 136: Rest of South America Encapsulated Food Market Volume (Tons) Forecast, by Application 2019 & 2032
- Table 137: Global Encapsulated Food Market Revenue Million Forecast, by Technology 2019 & 2032
- Table 138: Global Encapsulated Food Market Volume Tons Forecast, by Technology 2019 & 2032
- Table 139: Global Encapsulated Food Market Revenue Million Forecast, by Material Type 2019 & 2032
- Table 140: Global Encapsulated Food Market Volume Tons Forecast, by Material Type 2019 & 2032
- Table 141: Global Encapsulated Food Market Revenue Million Forecast, by Core Phase 2019 & 2032
- Table 142: Global Encapsulated Food Market Volume Tons Forecast, by Core Phase 2019 & 2032
- Table 143: Global Encapsulated Food Market Revenue Million Forecast, by Country 2019 & 2032
- Table 144: Global Encapsulated Food Market Volume Tons Forecast, by Country 2019 & 2032
- Table 145: Global Encapsulated Food Market Revenue Million Forecast, by Technology 2019 & 2032
- Table 146: Global Encapsulated Food Market Volume Tons Forecast, by Technology 2019 & 2032
- Table 147: Global Encapsulated Food Market Revenue Million Forecast, by Material Type 2019 & 2032
- Table 148: Global Encapsulated Food Market Volume Tons Forecast, by Material Type 2019 & 2032
- Table 149: Global Encapsulated Food Market Revenue Million Forecast, by Core Phase 2019 & 2032
- Table 150: Global Encapsulated Food Market Volume Tons Forecast, by Core Phase 2019 & 2032
- Table 151: Global Encapsulated Food Market Revenue Million Forecast, by Country 2019 & 2032
- Table 152: Global Encapsulated Food Market Volume Tons Forecast, by Country 2019 & 2032
- Table 153: Saudi Arabia Encapsulated Food Market Revenue (Million) Forecast, by Application 2019 & 2032
- Table 154: Saudi Arabia Encapsulated Food Market Volume (Tons) Forecast, by Application 2019 & 2032
- Table 155: Rest of Middle East Encapsulated Food Market Revenue (Million) Forecast, by Application 2019 & 2032
- Table 156: Rest of Middle East Encapsulated Food Market Volume (Tons) Forecast, by Application 2019 & 2032
Frequently Asked Questions
1. What is the projected Compound Annual Growth Rate (CAGR) of the Encapsulated Food Market?
The projected CAGR is approximately 6.12%.
2. Which companies are prominent players in the Encapsulated Food Market?
Key companies in the market include Cargill Incorporated, Encapsys LLC, Frieslandcampina Kievit*List Not Exhaustive, BASF SE, DuPont, ADVANCED BIONUTRITION CORP, Ingredion Incorporated, GAT Food Essentials GmbH.
3. What are the main segments of the Encapsulated Food Market?
The market segments include Technology, Material Type, Core Phase.
4. Can you provide details about the market size?
The market size is estimated to be USD 5,952.8 Million as of 2022.
5. What are some drivers contributing to market growth?
Awareness of Health Benefits Associated with Tocotrienol; Escalating Demand for Anti-Aging Products Containing Tocotrienol.
6. What are the notable trends driving market growth?
Growing Demand of Dietary Supplement.
7. Are there any restraints impacting market growth?
Availability of Substitutes.
8. Can you provide examples of recent developments in the market?
N/A
9. What pricing options are available for accessing the report?
Pricing options include single-user, multi-user, and enterprise licenses priced at USD 4750, USD 5250, and USD 8750 respectively.
10. Is the market size provided in terms of value or volume?
The market size is provided in terms of value, measured in Million and volume, measured in Tons.
11. Are there any specific market keywords associated with the report?
Yes, the market keyword associated with the report is "Encapsulated Food Market," which aids in identifying and referencing the specific market segment covered.
12. How do I determine which pricing option suits my needs best?
The pricing options vary based on user requirements and access needs. Individual users may opt for single-user licenses, while businesses requiring broader access may choose multi-user or enterprise licenses for cost-effective access to the report.
13. Are there any additional resources or data provided in the Encapsulated Food Market report?
While the report offers comprehensive insights, it's advisable to review the specific contents or supplementary materials provided to ascertain if additional resources or data are available.
14. How can I stay updated on further developments or reports in the Encapsulated Food Market?
To stay informed about further developments, trends, and reports in the Encapsulated Food Market, consider subscribing to industry newsletters, following relevant companies and organizations, or regularly checking reputable industry news sources and publications.
Methodology
Step 1 - Identification of Relevant Samples Size from Population Database


Step 2 - Approaches for Defining Global Market Size (Value, Volume* & Price*)

Note*: In applicable scenarios
Step 3 - Data Sources
Primary Research
- Web Analytics
- Survey Reports
- Research Institute
- Latest Research Reports
- Opinion Leaders
Secondary Research
- Annual Reports
- White Paper
- Latest Press Release
- Industry Association
- Paid Database
- Investor Presentations

Step 4 - Data Triangulation
Involves using different sources of information in order to increase the validity of a study
These sources are likely to be stakeholders in a program - participants, other researchers, program staff, other community members, and so on.
Then we put all data in single framework & apply various statistical tools to find out the dynamic on the market.
During the analysis stage, feedback from the stakeholder groups would be compared to determine areas of agreement as well as areas of divergence


