
Key Insights
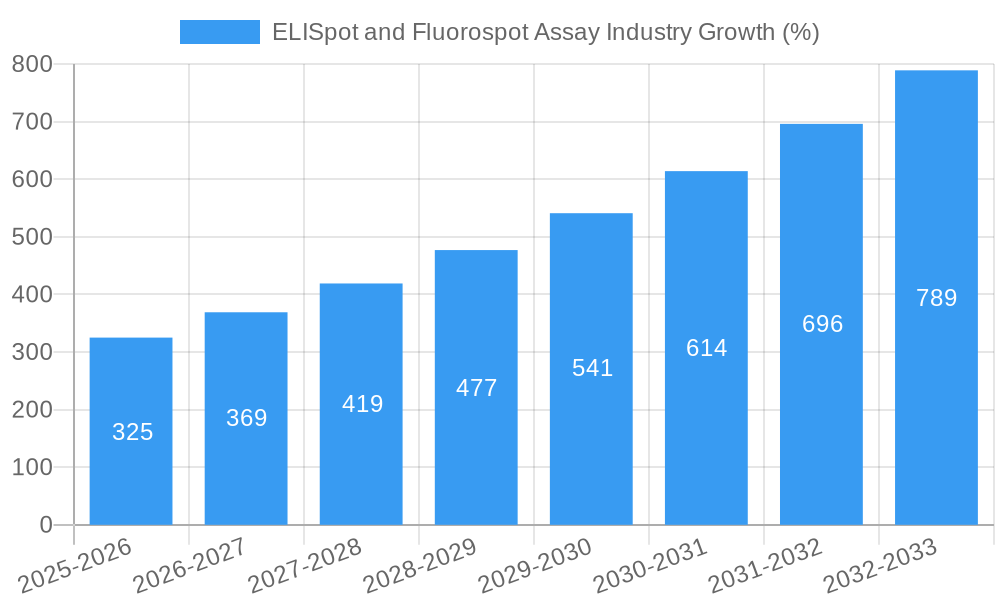
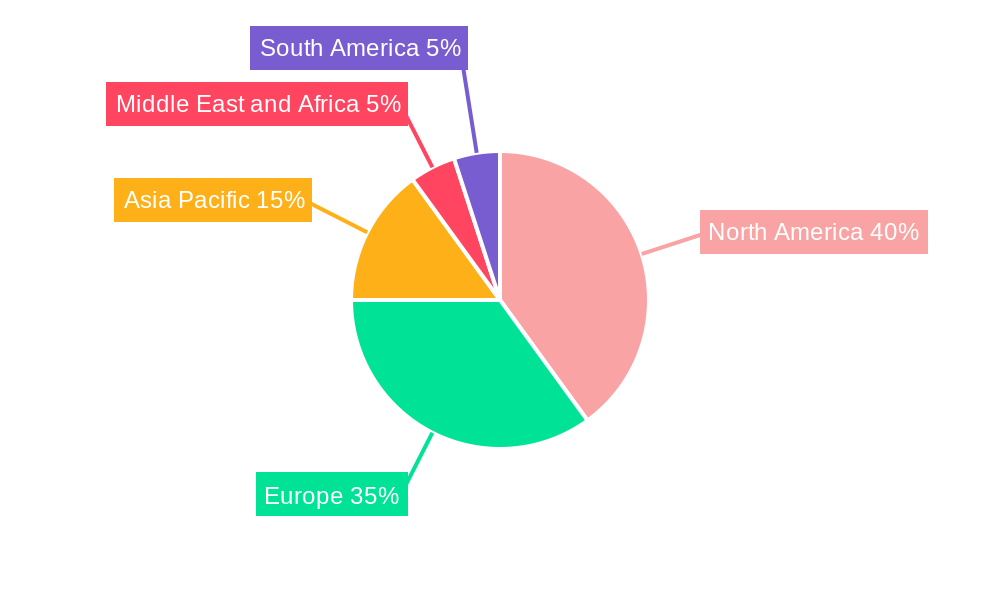
The ELISpot and Fluorospot assay market is experiencing robust growth, driven by the increasing prevalence of infectious diseases and cancer, the rising demand for sensitive and specific diagnostic tools, and advancements in research methodologies. The market's Compound Annual Growth Rate (CAGR) of 13.30% from 2019 to 2024 indicates a significant expansion, projected to continue through 2033. Key segments fueling this growth include cancer research diagnostics, where these assays play a crucial role in identifying and monitoring immune responses to cancer treatments. The biopharmaceutical industry heavily utilizes ELISpot and Fluorospot assays in drug discovery and development, particularly for immunogenicity studies. Hospitals and clinical laboratories are also significant end-users, relying on these assays for accurate diagnosis and disease monitoring. While the market faces certain restraints, such as the high cost of assays and the need for specialized expertise, the continuous advancements in technology, including automation and miniaturization, are mitigating these challenges. The market is geographically diversified, with North America and Europe currently holding significant market shares, although the Asia-Pacific region is poised for rapid growth due to increasing healthcare expenditure and rising awareness of infectious diseases. Competition is intense, with a mix of established players and emerging companies offering a range of products and services. Strategic collaborations, acquisitions, and the development of novel assay formats are shaping the competitive landscape.
The diverse applications of ELISpot and Fluorospot assays across various sectors, including research, diagnostics, and drug development, will continue to drive market expansion. Growth will be further supported by increasing investments in research and development, the growing prevalence of chronic diseases requiring immune-based diagnostics, and the development of more sophisticated and user-friendly assay platforms. The global market is expected to witness a significant influx of novel technologies and improved assay designs, enhancing sensitivity, throughput, and ease of use. These advancements will further broaden the applicability of ELISpot and Fluorospot assays, attracting new users and consolidating market dominance among key players. Furthermore, the growing need for personalized medicine and targeted therapies will further propel the demand for these assays in cancer research and immunology studies. This continuous evolution ensures the sustained growth and expansion of the ELISpot and Fluorospot assay market in the coming years.
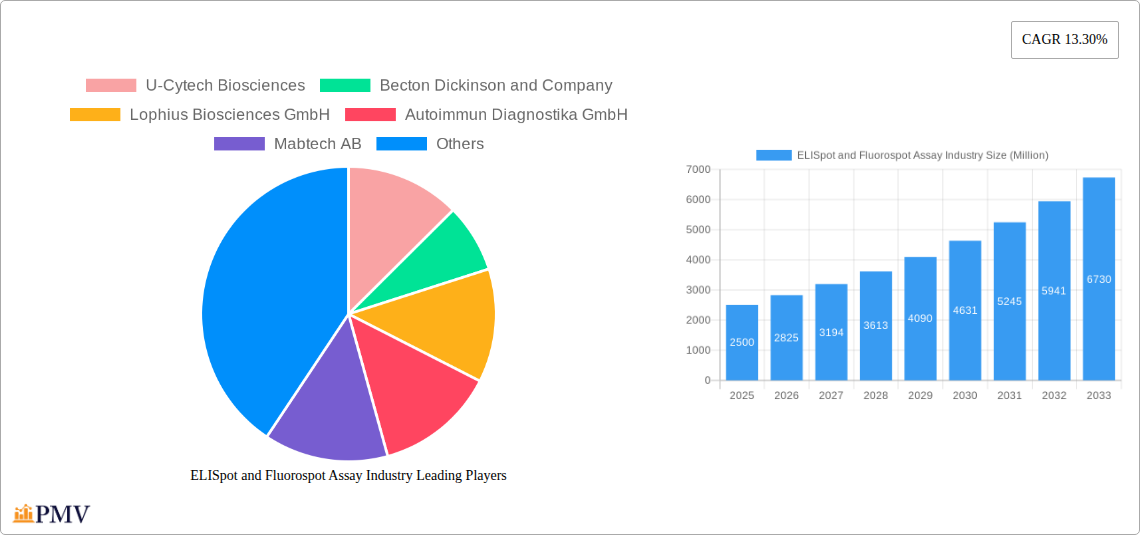
This comprehensive report provides a detailed analysis of the ELISpot and Fluorospot Assay industry, offering invaluable insights for stakeholders across the value chain. The study period spans from 2019 to 2033, with 2025 serving as the base and estimated year. The report forecasts market trends from 2025 to 2033, leveraging data from the historical period of 2019-2024. Key players like U-Cytech Biosciences, Becton Dickinson and Company, Lophius Biosciences GmbH, and others are profiled, providing a complete picture of this dynamic market expected to reach xx Million by 2033.
ELISpot and Fluorospot Assay Industry Market Structure & Competitive Dynamics
The ELISpot and Fluorospot assay market exhibits a moderately concentrated structure, with several key players holding significant market share. The market is characterized by ongoing innovation, driven by the need for more sensitive and efficient assays. Regulatory frameworks, particularly those related to in-vitro diagnostics (IVDs), significantly influence market dynamics. Product substitutes, such as flow cytometry, pose competitive challenges. End-user trends, especially the increasing adoption of ELISpot and Fluorospot assays in research and drug discovery, are fueling market growth.
Market share data suggests that Becton Dickinson and Company and Mabtech AB hold leading positions, with estimated combined market share at approximately 40% in 2025. The remaining share is distributed among other significant players. M&A activities in the sector have been relatively modest in recent years, with deal values averaging xx Million per transaction. However, strategic partnerships, like the collaboration between BD and CerTest Biotec (detailed further in the report), are increasingly common, indicating a trend towards collaborative innovation. This competitive landscape is dynamic, with continuous innovation and strategic partnerships shaping the future of the market.
ELISpot and Fluorospot Assay Industry Trends & Insights
The ELISpot and Fluorospot assay market is experiencing robust growth, driven by several key factors. The rising prevalence of infectious diseases and chronic conditions, coupled with the increasing demand for advanced diagnostic tools, is a major catalyst for market expansion. Technological advancements, such as the development of automated analyzers and high-throughput assays, are enhancing the efficiency and sensitivity of these tests, further driving market adoption. Consumer preference for minimally invasive diagnostic procedures is also supporting market growth. The CAGR for the ELISpot and Fluorospot assay market is projected to be xx% during the forecast period (2025-2033), reaching a market value of xx Million by 2033. Market penetration is expected to increase significantly, particularly in emerging markets with growing healthcare infrastructure. The increasing demand for personalized medicine and companion diagnostics is also expected to drive the growth of the ELISpot and Fluorospot assay market.
Dominant Markets & Segments in ELISpot and Fluorospot Assay Industry
By Product: Assay kits represent the largest segment, driven by high demand from research institutions and biopharmaceutical companies. Analyzers are gaining traction due to increasing automation needs. Ancillary products provide supplementary revenue streams for market players.
By End-User: Research institutes and biopharmaceutical companies are the leading end-users, fueled by high research activities in immunology and drug development. The hospitals and clinical labs segment is also growing.
By Application: Research is the most significant application area, owing to the extensive use of ELISpot and Fluorospot assays in basic and translational research. Cancer research, specifically diagnostics, is a rapidly expanding segment.
Geographic Dominance: North America currently holds the largest market share, driven by advanced healthcare infrastructure, high R&D spending, and strong regulatory support. However, Asia-Pacific is projected to exhibit the fastest growth rate during the forecast period due to increasing healthcare expenditure and rising prevalence of infectious diseases in this region. Key drivers in dominant regions include favorable government policies, investments in healthcare infrastructure, and growing awareness of advanced diagnostic techniques.
ELISpot and Fluorospot Assay Industry Product Innovations
Recent product innovations have focused on improving assay sensitivity, reducing assay time, and enhancing automation. The introduction of multiplex assays allows simultaneous detection of multiple analytes, improving the efficiency of immune monitoring. The development of automated analyzers reduces manual handling and increases throughput. These innovations are enhancing the market fit of ELISpot and Fluorospot assays by addressing user needs for faster, more accurate, and high-throughput testing solutions.
Report Segmentation & Scope
This report segments the ELISpot and Fluorospot assay market by product (analyzers, assay kits, ancillary products), end-user (hospitals & clinical labs, biopharmaceutical companies, research institutes), and application (research, cancer research: diagnostics). Growth projections vary across segments, with assay kits showing high growth due to widespread usage in research. Market sizes are provided for each segment, reflecting current and projected market values. Competitive dynamics are analyzed for each segment, highlighting key players and their strategic positioning.
Key Drivers of ELISpot and Fluorospot Assay Industry Growth
Technological advancements, such as the development of high-throughput screening platforms and automated analyzers, are driving market growth. Growing investments in healthcare infrastructure, particularly in emerging markets, are also contributing to expansion. Favorable regulatory policies, facilitating the approval and adoption of new diagnostic tools, are fostering market growth. Specifically, the increasing demand for personalized medicine and companion diagnostics is further accelerating adoption of these assays.
Challenges in the ELISpot and Fluorospot Assay Industry Sector
Regulatory hurdles, such as stringent approval processes for new diagnostic products, pose a significant challenge. Supply chain disruptions, potentially affecting the availability of reagents and consumables, can impact market growth. Intense competition among established players and emerging companies creates pricing pressures. These factors collectively impact market expansion, with estimates indicating potential constraints on growth by approximately xx% in certain sub-segments if supply chain issues are not adequately addressed.
Leading Players in the ELISpot and Fluorospot Assay Industry Market
- U-Cytech Biosciences
- Becton Dickinson and Company
- Lophius Biosciences GmbH
- Autoimmun Diagnostika GmbH
- Mabtech AB
- Bio-Connect B V
- Bio-Techne Corporation
- Cellular Technologies Limited
- Oxford Immunotec
- Abcam
Key Developments in ELISpot and Fluorospot Assay Industry Sector
June 2022: BD and CerTest Biotec collaborated to develop a Monkeypox virus molecular diagnostic test using the BD MAX™ System. This collaboration significantly impacts the market by providing a rapid and reliable diagnostic tool for a newly emerging infectious disease, driving demand for molecular diagnostics.
April 2022: ProImmune Ltd. launched a B-cell ELISpot assay service. This expands the applications of ELISpot assays, broadening market reach and increasing demand within the research and drug development sectors.
Strategic ELISpot and Fluorospot Assay Industry Market Outlook
The ELISpot and Fluorospot assay market presents significant growth potential, driven by continuous technological advancements, increasing demand for personalized medicine, and the expanding applications in various research areas. Strategic opportunities exist for companies focusing on innovative assay development, automation, and expansion into emerging markets. The market is poised for continued expansion, with opportunities for strategic partnerships and acquisitions, particularly in areas such as multiplex assays and automation technologies. The long-term outlook remains positive, with projected strong growth driven by the factors outlined throughout this report.
ELISpot and Fluorospot Assay Industry Segmentation
-
1. Product
- 1.1. Analyzers
- 1.2. Assay kits
- 1.3. Ancillary Products
-
2. End-User
- 2.1. Hospitals & Clinical labs
- 2.2. Biopharmaceutical Company
- 2.3. Research Institutes
-
3. Application
-
3.1. Research
- 3.1.1. Vaccine Development
- 3.1.2. Clinical Trials
- 3.1.3. Cancer Research
-
3.2. Diagnostics
- 3.2.1. Infectious Disease
- 3.2.2. Transplants
-
3.1. Research
ELISpot and Fluorospot Assay Industry Segmentation By Geography
-
1. North America
- 1.1. United States
- 1.2. Canada
- 1.3. Mexico
-
2. Europe
- 2.1. Germany
- 2.2. United Kingdom
- 2.3. France
- 2.4. Italy
- 2.5. Spain
- 2.6. Rest of Europe
-
3. Asia Pacific
- 3.1. China
- 3.2. Japan
- 3.3. India
- 3.4. Australia
- 3.5. South Korea
- 3.6. Rest of Asia Pacific
-
4. Middle East and Africa
- 4.1. GCC
- 4.2. South Africa
- 4.3. Rest of Middle East and Africa
-
5. South America
- 5.1. Brazil
- 5.2. Argentina
- 5.3. Rest of South America
ELISpot and Fluorospot Assay Industry REPORT HIGHLIGHTS
| Aspects | Details |
|---|---|
| Study Period | 2019-2033 |
| Base Year | 2024 |
| Estimated Year | 2025 |
| Forecast Period | 2025-2033 |
| Historical Period | 2019-2024 |
| Growth Rate | CAGR of 13.30% from 2019-2033 |
| Segmentation |
|
Table of Contents
- 1. Introduction
- 1.1. Research Scope
- 1.2. Market Segmentation
- 1.3. Research Methodology
- 1.4. Definitions and Assumptions
- 2. Executive Summary
- 2.1. Introduction
- 3. Market Dynamics
- 3.1. Introduction
- 3.2. Market Drivers
- 3.2.1. Increasing Incidence of Chronic Diseases; Technological Breakthroughs in Test Kits and analyzers for ELISpot and FluoroSpot
- 3.3. Market Restrains
- 3.3.1. Availability of alternative detection technologies
- 3.4. Market Trends
- 3.4.1. Assay Kits is Expected to Hold the Largest Market Share in the ELISpot and FluoroSpot Assay Market
- 4. Market Factor Analysis
- 4.1. Porters Five Forces
- 4.2. Supply/Value Chain
- 4.3. PESTEL analysis
- 4.4. Market Entropy
- 4.5. Patent/Trademark Analysis
- 5. Global ELISpot and Fluorospot Assay Industry Analysis, Insights and Forecast, 2019-2031
- 5.1. Market Analysis, Insights and Forecast - by Product
- 5.1.1. Analyzers
- 5.1.2. Assay kits
- 5.1.3. Ancillary Products
- 5.2. Market Analysis, Insights and Forecast - by End-User
- 5.2.1. Hospitals & Clinical labs
- 5.2.2. Biopharmaceutical Company
- 5.2.3. Research Institutes
- 5.3. Market Analysis, Insights and Forecast - by Application
- 5.3.1. Research
- 5.3.1.1. Vaccine Development
- 5.3.1.2. Clinical Trials
- 5.3.1.3. Cancer Research
- 5.3.2. Diagnostics
- 5.3.2.1. Infectious Disease
- 5.3.2.2. Transplants
- 5.3.1. Research
- 5.4. Market Analysis, Insights and Forecast - by Region
- 5.4.1. North America
- 5.4.2. Europe
- 5.4.3. Asia Pacific
- 5.4.4. Middle East and Africa
- 5.4.5. South America
- 5.1. Market Analysis, Insights and Forecast - by Product
- 6. North America ELISpot and Fluorospot Assay Industry Analysis, Insights and Forecast, 2019-2031
- 6.1. Market Analysis, Insights and Forecast - by Product
- 6.1.1. Analyzers
- 6.1.2. Assay kits
- 6.1.3. Ancillary Products
- 6.2. Market Analysis, Insights and Forecast - by End-User
- 6.2.1. Hospitals & Clinical labs
- 6.2.2. Biopharmaceutical Company
- 6.2.3. Research Institutes
- 6.3. Market Analysis, Insights and Forecast - by Application
- 6.3.1. Research
- 6.3.1.1. Vaccine Development
- 6.3.1.2. Clinical Trials
- 6.3.1.3. Cancer Research
- 6.3.2. Diagnostics
- 6.3.2.1. Infectious Disease
- 6.3.2.2. Transplants
- 6.3.1. Research
- 6.1. Market Analysis, Insights and Forecast - by Product
- 7. Europe ELISpot and Fluorospot Assay Industry Analysis, Insights and Forecast, 2019-2031
- 7.1. Market Analysis, Insights and Forecast - by Product
- 7.1.1. Analyzers
- 7.1.2. Assay kits
- 7.1.3. Ancillary Products
- 7.2. Market Analysis, Insights and Forecast - by End-User
- 7.2.1. Hospitals & Clinical labs
- 7.2.2. Biopharmaceutical Company
- 7.2.3. Research Institutes
- 7.3. Market Analysis, Insights and Forecast - by Application
- 7.3.1. Research
- 7.3.1.1. Vaccine Development
- 7.3.1.2. Clinical Trials
- 7.3.1.3. Cancer Research
- 7.3.2. Diagnostics
- 7.3.2.1. Infectious Disease
- 7.3.2.2. Transplants
- 7.3.1. Research
- 7.1. Market Analysis, Insights and Forecast - by Product
- 8. Asia Pacific ELISpot and Fluorospot Assay Industry Analysis, Insights and Forecast, 2019-2031
- 8.1. Market Analysis, Insights and Forecast - by Product
- 8.1.1. Analyzers
- 8.1.2. Assay kits
- 8.1.3. Ancillary Products
- 8.2. Market Analysis, Insights and Forecast - by End-User
- 8.2.1. Hospitals & Clinical labs
- 8.2.2. Biopharmaceutical Company
- 8.2.3. Research Institutes
- 8.3. Market Analysis, Insights and Forecast - by Application
- 8.3.1. Research
- 8.3.1.1. Vaccine Development
- 8.3.1.2. Clinical Trials
- 8.3.1.3. Cancer Research
- 8.3.2. Diagnostics
- 8.3.2.1. Infectious Disease
- 8.3.2.2. Transplants
- 8.3.1. Research
- 8.1. Market Analysis, Insights and Forecast - by Product
- 9. Middle East and Africa ELISpot and Fluorospot Assay Industry Analysis, Insights and Forecast, 2019-2031
- 9.1. Market Analysis, Insights and Forecast - by Product
- 9.1.1. Analyzers
- 9.1.2. Assay kits
- 9.1.3. Ancillary Products
- 9.2. Market Analysis, Insights and Forecast - by End-User
- 9.2.1. Hospitals & Clinical labs
- 9.2.2. Biopharmaceutical Company
- 9.2.3. Research Institutes
- 9.3. Market Analysis, Insights and Forecast - by Application
- 9.3.1. Research
- 9.3.1.1. Vaccine Development
- 9.3.1.2. Clinical Trials
- 9.3.1.3. Cancer Research
- 9.3.2. Diagnostics
- 9.3.2.1. Infectious Disease
- 9.3.2.2. Transplants
- 9.3.1. Research
- 9.1. Market Analysis, Insights and Forecast - by Product
- 10. South America ELISpot and Fluorospot Assay Industry Analysis, Insights and Forecast, 2019-2031
- 10.1. Market Analysis, Insights and Forecast - by Product
- 10.1.1. Analyzers
- 10.1.2. Assay kits
- 10.1.3. Ancillary Products
- 10.2. Market Analysis, Insights and Forecast - by End-User
- 10.2.1. Hospitals & Clinical labs
- 10.2.2. Biopharmaceutical Company
- 10.2.3. Research Institutes
- 10.3. Market Analysis, Insights and Forecast - by Application
- 10.3.1. Research
- 10.3.1.1. Vaccine Development
- 10.3.1.2. Clinical Trials
- 10.3.1.3. Cancer Research
- 10.3.2. Diagnostics
- 10.3.2.1. Infectious Disease
- 10.3.2.2. Transplants
- 10.3.1. Research
- 10.1. Market Analysis, Insights and Forecast - by Product
- 11. North America ELISpot and Fluorospot Assay Industry Analysis, Insights and Forecast, 2019-2031
- 11.1. Market Analysis, Insights and Forecast - By Country/Sub-region
- 11.1.1 United States
- 11.1.2 Canada
- 11.1.3 Mexico
- 12. Europe ELISpot and Fluorospot Assay Industry Analysis, Insights and Forecast, 2019-2031
- 12.1. Market Analysis, Insights and Forecast - By Country/Sub-region
- 12.1.1 Germany
- 12.1.2 United Kingdom
- 12.1.3 France
- 12.1.4 Italy
- 12.1.5 Spain
- 12.1.6 Rest of Europe
- 13. Asia Pacific ELISpot and Fluorospot Assay Industry Analysis, Insights and Forecast, 2019-2031
- 13.1. Market Analysis, Insights and Forecast - By Country/Sub-region
- 13.1.1 China
- 13.1.2 Japan
- 13.1.3 India
- 13.1.4 Australia
- 13.1.5 South Korea
- 13.1.6 Rest of Asia Pacific
- 14. Middle East and Africa ELISpot and Fluorospot Assay Industry Analysis, Insights and Forecast, 2019-2031
- 14.1. Market Analysis, Insights and Forecast - By Country/Sub-region
- 14.1.1 GCC
- 14.1.2 South Africa
- 14.1.3 Rest of Middle East and Africa
- 15. South America ELISpot and Fluorospot Assay Industry Analysis, Insights and Forecast, 2019-2031
- 15.1. Market Analysis, Insights and Forecast - By Country/Sub-region
- 15.1.1 Brazil
- 15.1.2 Argentina
- 15.1.3 Rest of South America
- 16. Competitive Analysis
- 16.1. Global Market Share Analysis 2024
- 16.2. Company Profiles
- 16.2.1 U-Cytech Biosciences
- 16.2.1.1. Overview
- 16.2.1.2. Products
- 16.2.1.3. SWOT Analysis
- 16.2.1.4. Recent Developments
- 16.2.1.5. Financials (Based on Availability)
- 16.2.2 Becton Dickinson and Company
- 16.2.2.1. Overview
- 16.2.2.2. Products
- 16.2.2.3. SWOT Analysis
- 16.2.2.4. Recent Developments
- 16.2.2.5. Financials (Based on Availability)
- 16.2.3 Lophius Biosciences GmbH
- 16.2.3.1. Overview
- 16.2.3.2. Products
- 16.2.3.3. SWOT Analysis
- 16.2.3.4. Recent Developments
- 16.2.3.5. Financials (Based on Availability)
- 16.2.4 Autoimmun Diagnostika GmbH
- 16.2.4.1. Overview
- 16.2.4.2. Products
- 16.2.4.3. SWOT Analysis
- 16.2.4.4. Recent Developments
- 16.2.4.5. Financials (Based on Availability)
- 16.2.5 Mabtech AB
- 16.2.5.1. Overview
- 16.2.5.2. Products
- 16.2.5.3. SWOT Analysis
- 16.2.5.4. Recent Developments
- 16.2.5.5. Financials (Based on Availability)
- 16.2.6 Bio-Connect B V
- 16.2.6.1. Overview
- 16.2.6.2. Products
- 16.2.6.3. SWOT Analysis
- 16.2.6.4. Recent Developments
- 16.2.6.5. Financials (Based on Availability)
- 16.2.7 Bio-Techne Corporation*List Not Exhaustive
- 16.2.7.1. Overview
- 16.2.7.2. Products
- 16.2.7.3. SWOT Analysis
- 16.2.7.4. Recent Developments
- 16.2.7.5. Financials (Based on Availability)
- 16.2.8 Cellular Technologies Limited
- 16.2.8.1. Overview
- 16.2.8.2. Products
- 16.2.8.3. SWOT Analysis
- 16.2.8.4. Recent Developments
- 16.2.8.5. Financials (Based on Availability)
- 16.2.9 Oxford Immunotec
- 16.2.9.1. Overview
- 16.2.9.2. Products
- 16.2.9.3. SWOT Analysis
- 16.2.9.4. Recent Developments
- 16.2.9.5. Financials (Based on Availability)
- 16.2.10 Abcam
- 16.2.10.1. Overview
- 16.2.10.2. Products
- 16.2.10.3. SWOT Analysis
- 16.2.10.4. Recent Developments
- 16.2.10.5. Financials (Based on Availability)
- 16.2.1 U-Cytech Biosciences
List of Figures
- Figure 1: Global ELISpot and Fluorospot Assay Industry Revenue Breakdown (Million, %) by Region 2024 & 2032
- Figure 2: North America ELISpot and Fluorospot Assay Industry Revenue (Million), by Country 2024 & 2032
- Figure 3: North America ELISpot and Fluorospot Assay Industry Revenue Share (%), by Country 2024 & 2032
- Figure 4: Europe ELISpot and Fluorospot Assay Industry Revenue (Million), by Country 2024 & 2032
- Figure 5: Europe ELISpot and Fluorospot Assay Industry Revenue Share (%), by Country 2024 & 2032
- Figure 6: Asia Pacific ELISpot and Fluorospot Assay Industry Revenue (Million), by Country 2024 & 2032
- Figure 7: Asia Pacific ELISpot and Fluorospot Assay Industry Revenue Share (%), by Country 2024 & 2032
- Figure 8: Middle East and Africa ELISpot and Fluorospot Assay Industry Revenue (Million), by Country 2024 & 2032
- Figure 9: Middle East and Africa ELISpot and Fluorospot Assay Industry Revenue Share (%), by Country 2024 & 2032
- Figure 10: South America ELISpot and Fluorospot Assay Industry Revenue (Million), by Country 2024 & 2032
- Figure 11: South America ELISpot and Fluorospot Assay Industry Revenue Share (%), by Country 2024 & 2032
- Figure 12: North America ELISpot and Fluorospot Assay Industry Revenue (Million), by Product 2024 & 2032
- Figure 13: North America ELISpot and Fluorospot Assay Industry Revenue Share (%), by Product 2024 & 2032
- Figure 14: North America ELISpot and Fluorospot Assay Industry Revenue (Million), by End-User 2024 & 2032
- Figure 15: North America ELISpot and Fluorospot Assay Industry Revenue Share (%), by End-User 2024 & 2032
- Figure 16: North America ELISpot and Fluorospot Assay Industry Revenue (Million), by Application 2024 & 2032
- Figure 17: North America ELISpot and Fluorospot Assay Industry Revenue Share (%), by Application 2024 & 2032
- Figure 18: North America ELISpot and Fluorospot Assay Industry Revenue (Million), by Country 2024 & 2032
- Figure 19: North America ELISpot and Fluorospot Assay Industry Revenue Share (%), by Country 2024 & 2032
- Figure 20: Europe ELISpot and Fluorospot Assay Industry Revenue (Million), by Product 2024 & 2032
- Figure 21: Europe ELISpot and Fluorospot Assay Industry Revenue Share (%), by Product 2024 & 2032
- Figure 22: Europe ELISpot and Fluorospot Assay Industry Revenue (Million), by End-User 2024 & 2032
- Figure 23: Europe ELISpot and Fluorospot Assay Industry Revenue Share (%), by End-User 2024 & 2032
- Figure 24: Europe ELISpot and Fluorospot Assay Industry Revenue (Million), by Application 2024 & 2032
- Figure 25: Europe ELISpot and Fluorospot Assay Industry Revenue Share (%), by Application 2024 & 2032
- Figure 26: Europe ELISpot and Fluorospot Assay Industry Revenue (Million), by Country 2024 & 2032
- Figure 27: Europe ELISpot and Fluorospot Assay Industry Revenue Share (%), by Country 2024 & 2032
- Figure 28: Asia Pacific ELISpot and Fluorospot Assay Industry Revenue (Million), by Product 2024 & 2032
- Figure 29: Asia Pacific ELISpot and Fluorospot Assay Industry Revenue Share (%), by Product 2024 & 2032
- Figure 30: Asia Pacific ELISpot and Fluorospot Assay Industry Revenue (Million), by End-User 2024 & 2032
- Figure 31: Asia Pacific ELISpot and Fluorospot Assay Industry Revenue Share (%), by End-User 2024 & 2032
- Figure 32: Asia Pacific ELISpot and Fluorospot Assay Industry Revenue (Million), by Application 2024 & 2032
- Figure 33: Asia Pacific ELISpot and Fluorospot Assay Industry Revenue Share (%), by Application 2024 & 2032
- Figure 34: Asia Pacific ELISpot and Fluorospot Assay Industry Revenue (Million), by Country 2024 & 2032
- Figure 35: Asia Pacific ELISpot and Fluorospot Assay Industry Revenue Share (%), by Country 2024 & 2032
- Figure 36: Middle East and Africa ELISpot and Fluorospot Assay Industry Revenue (Million), by Product 2024 & 2032
- Figure 37: Middle East and Africa ELISpot and Fluorospot Assay Industry Revenue Share (%), by Product 2024 & 2032
- Figure 38: Middle East and Africa ELISpot and Fluorospot Assay Industry Revenue (Million), by End-User 2024 & 2032
- Figure 39: Middle East and Africa ELISpot and Fluorospot Assay Industry Revenue Share (%), by End-User 2024 & 2032
- Figure 40: Middle East and Africa ELISpot and Fluorospot Assay Industry Revenue (Million), by Application 2024 & 2032
- Figure 41: Middle East and Africa ELISpot and Fluorospot Assay Industry Revenue Share (%), by Application 2024 & 2032
- Figure 42: Middle East and Africa ELISpot and Fluorospot Assay Industry Revenue (Million), by Country 2024 & 2032
- Figure 43: Middle East and Africa ELISpot and Fluorospot Assay Industry Revenue Share (%), by Country 2024 & 2032
- Figure 44: South America ELISpot and Fluorospot Assay Industry Revenue (Million), by Product 2024 & 2032
- Figure 45: South America ELISpot and Fluorospot Assay Industry Revenue Share (%), by Product 2024 & 2032
- Figure 46: South America ELISpot and Fluorospot Assay Industry Revenue (Million), by End-User 2024 & 2032
- Figure 47: South America ELISpot and Fluorospot Assay Industry Revenue Share (%), by End-User 2024 & 2032
- Figure 48: South America ELISpot and Fluorospot Assay Industry Revenue (Million), by Application 2024 & 2032
- Figure 49: South America ELISpot and Fluorospot Assay Industry Revenue Share (%), by Application 2024 & 2032
- Figure 50: South America ELISpot and Fluorospot Assay Industry Revenue (Million), by Country 2024 & 2032
- Figure 51: South America ELISpot and Fluorospot Assay Industry Revenue Share (%), by Country 2024 & 2032
List of Tables
- Table 1: Global ELISpot and Fluorospot Assay Industry Revenue Million Forecast, by Region 2019 & 2032
- Table 2: Global ELISpot and Fluorospot Assay Industry Revenue Million Forecast, by Product 2019 & 2032
- Table 3: Global ELISpot and Fluorospot Assay Industry Revenue Million Forecast, by End-User 2019 & 2032
- Table 4: Global ELISpot and Fluorospot Assay Industry Revenue Million Forecast, by Application 2019 & 2032
- Table 5: Global ELISpot and Fluorospot Assay Industry Revenue Million Forecast, by Region 2019 & 2032
- Table 6: Global ELISpot and Fluorospot Assay Industry Revenue Million Forecast, by Country 2019 & 2032
- Table 7: United States ELISpot and Fluorospot Assay Industry Revenue (Million) Forecast, by Application 2019 & 2032
- Table 8: Canada ELISpot and Fluorospot Assay Industry Revenue (Million) Forecast, by Application 2019 & 2032
- Table 9: Mexico ELISpot and Fluorospot Assay Industry Revenue (Million) Forecast, by Application 2019 & 2032
- Table 10: Global ELISpot and Fluorospot Assay Industry Revenue Million Forecast, by Country 2019 & 2032
- Table 11: Germany ELISpot and Fluorospot Assay Industry Revenue (Million) Forecast, by Application 2019 & 2032
- Table 12: United Kingdom ELISpot and Fluorospot Assay Industry Revenue (Million) Forecast, by Application 2019 & 2032
- Table 13: France ELISpot and Fluorospot Assay Industry Revenue (Million) Forecast, by Application 2019 & 2032
- Table 14: Italy ELISpot and Fluorospot Assay Industry Revenue (Million) Forecast, by Application 2019 & 2032
- Table 15: Spain ELISpot and Fluorospot Assay Industry Revenue (Million) Forecast, by Application 2019 & 2032
- Table 16: Rest of Europe ELISpot and Fluorospot Assay Industry Revenue (Million) Forecast, by Application 2019 & 2032
- Table 17: Global ELISpot and Fluorospot Assay Industry Revenue Million Forecast, by Country 2019 & 2032
- Table 18: China ELISpot and Fluorospot Assay Industry Revenue (Million) Forecast, by Application 2019 & 2032
- Table 19: Japan ELISpot and Fluorospot Assay Industry Revenue (Million) Forecast, by Application 2019 & 2032
- Table 20: India ELISpot and Fluorospot Assay Industry Revenue (Million) Forecast, by Application 2019 & 2032
- Table 21: Australia ELISpot and Fluorospot Assay Industry Revenue (Million) Forecast, by Application 2019 & 2032
- Table 22: South Korea ELISpot and Fluorospot Assay Industry Revenue (Million) Forecast, by Application 2019 & 2032
- Table 23: Rest of Asia Pacific ELISpot and Fluorospot Assay Industry Revenue (Million) Forecast, by Application 2019 & 2032
- Table 24: Global ELISpot and Fluorospot Assay Industry Revenue Million Forecast, by Country 2019 & 2032
- Table 25: GCC ELISpot and Fluorospot Assay Industry Revenue (Million) Forecast, by Application 2019 & 2032
- Table 26: South Africa ELISpot and Fluorospot Assay Industry Revenue (Million) Forecast, by Application 2019 & 2032
- Table 27: Rest of Middle East and Africa ELISpot and Fluorospot Assay Industry Revenue (Million) Forecast, by Application 2019 & 2032
- Table 28: Global ELISpot and Fluorospot Assay Industry Revenue Million Forecast, by Country 2019 & 2032
- Table 29: Brazil ELISpot and Fluorospot Assay Industry Revenue (Million) Forecast, by Application 2019 & 2032
- Table 30: Argentina ELISpot and Fluorospot Assay Industry Revenue (Million) Forecast, by Application 2019 & 2032
- Table 31: Rest of South America ELISpot and Fluorospot Assay Industry Revenue (Million) Forecast, by Application 2019 & 2032
- Table 32: Global ELISpot and Fluorospot Assay Industry Revenue Million Forecast, by Product 2019 & 2032
- Table 33: Global ELISpot and Fluorospot Assay Industry Revenue Million Forecast, by End-User 2019 & 2032
- Table 34: Global ELISpot and Fluorospot Assay Industry Revenue Million Forecast, by Application 2019 & 2032
- Table 35: Global ELISpot and Fluorospot Assay Industry Revenue Million Forecast, by Country 2019 & 2032
- Table 36: United States ELISpot and Fluorospot Assay Industry Revenue (Million) Forecast, by Application 2019 & 2032
- Table 37: Canada ELISpot and Fluorospot Assay Industry Revenue (Million) Forecast, by Application 2019 & 2032
- Table 38: Mexico ELISpot and Fluorospot Assay Industry Revenue (Million) Forecast, by Application 2019 & 2032
- Table 39: Global ELISpot and Fluorospot Assay Industry Revenue Million Forecast, by Product 2019 & 2032
- Table 40: Global ELISpot and Fluorospot Assay Industry Revenue Million Forecast, by End-User 2019 & 2032
- Table 41: Global ELISpot and Fluorospot Assay Industry Revenue Million Forecast, by Application 2019 & 2032
- Table 42: Global ELISpot and Fluorospot Assay Industry Revenue Million Forecast, by Country 2019 & 2032
- Table 43: Germany ELISpot and Fluorospot Assay Industry Revenue (Million) Forecast, by Application 2019 & 2032
- Table 44: United Kingdom ELISpot and Fluorospot Assay Industry Revenue (Million) Forecast, by Application 2019 & 2032
- Table 45: France ELISpot and Fluorospot Assay Industry Revenue (Million) Forecast, by Application 2019 & 2032
- Table 46: Italy ELISpot and Fluorospot Assay Industry Revenue (Million) Forecast, by Application 2019 & 2032
- Table 47: Spain ELISpot and Fluorospot Assay Industry Revenue (Million) Forecast, by Application 2019 & 2032
- Table 48: Rest of Europe ELISpot and Fluorospot Assay Industry Revenue (Million) Forecast, by Application 2019 & 2032
- Table 49: Global ELISpot and Fluorospot Assay Industry Revenue Million Forecast, by Product 2019 & 2032
- Table 50: Global ELISpot and Fluorospot Assay Industry Revenue Million Forecast, by End-User 2019 & 2032
- Table 51: Global ELISpot and Fluorospot Assay Industry Revenue Million Forecast, by Application 2019 & 2032
- Table 52: Global ELISpot and Fluorospot Assay Industry Revenue Million Forecast, by Country 2019 & 2032
- Table 53: China ELISpot and Fluorospot Assay Industry Revenue (Million) Forecast, by Application 2019 & 2032
- Table 54: Japan ELISpot and Fluorospot Assay Industry Revenue (Million) Forecast, by Application 2019 & 2032
- Table 55: India ELISpot and Fluorospot Assay Industry Revenue (Million) Forecast, by Application 2019 & 2032
- Table 56: Australia ELISpot and Fluorospot Assay Industry Revenue (Million) Forecast, by Application 2019 & 2032
- Table 57: South Korea ELISpot and Fluorospot Assay Industry Revenue (Million) Forecast, by Application 2019 & 2032
- Table 58: Rest of Asia Pacific ELISpot and Fluorospot Assay Industry Revenue (Million) Forecast, by Application 2019 & 2032
- Table 59: Global ELISpot and Fluorospot Assay Industry Revenue Million Forecast, by Product 2019 & 2032
- Table 60: Global ELISpot and Fluorospot Assay Industry Revenue Million Forecast, by End-User 2019 & 2032
- Table 61: Global ELISpot and Fluorospot Assay Industry Revenue Million Forecast, by Application 2019 & 2032
- Table 62: Global ELISpot and Fluorospot Assay Industry Revenue Million Forecast, by Country 2019 & 2032
- Table 63: GCC ELISpot and Fluorospot Assay Industry Revenue (Million) Forecast, by Application 2019 & 2032
- Table 64: South Africa ELISpot and Fluorospot Assay Industry Revenue (Million) Forecast, by Application 2019 & 2032
- Table 65: Rest of Middle East and Africa ELISpot and Fluorospot Assay Industry Revenue (Million) Forecast, by Application 2019 & 2032
- Table 66: Global ELISpot and Fluorospot Assay Industry Revenue Million Forecast, by Product 2019 & 2032
- Table 67: Global ELISpot and Fluorospot Assay Industry Revenue Million Forecast, by End-User 2019 & 2032
- Table 68: Global ELISpot and Fluorospot Assay Industry Revenue Million Forecast, by Application 2019 & 2032
- Table 69: Global ELISpot and Fluorospot Assay Industry Revenue Million Forecast, by Country 2019 & 2032
- Table 70: Brazil ELISpot and Fluorospot Assay Industry Revenue (Million) Forecast, by Application 2019 & 2032
- Table 71: Argentina ELISpot and Fluorospot Assay Industry Revenue (Million) Forecast, by Application 2019 & 2032
- Table 72: Rest of South America ELISpot and Fluorospot Assay Industry Revenue (Million) Forecast, by Application 2019 & 2032
Frequently Asked Questions
1. What is the projected Compound Annual Growth Rate (CAGR) of the ELISpot and Fluorospot Assay Industry?
The projected CAGR is approximately 13.30%.
2. Which companies are prominent players in the ELISpot and Fluorospot Assay Industry?
Key companies in the market include U-Cytech Biosciences, Becton Dickinson and Company, Lophius Biosciences GmbH, Autoimmun Diagnostika GmbH, Mabtech AB, Bio-Connect B V, Bio-Techne Corporation*List Not Exhaustive, Cellular Technologies Limited, Oxford Immunotec, Abcam.
3. What are the main segments of the ELISpot and Fluorospot Assay Industry?
The market segments include Product, End-User, Application.
4. Can you provide details about the market size?
The market size is estimated to be USD XX Million as of 2022.
5. What are some drivers contributing to market growth?
Increasing Incidence of Chronic Diseases; Technological Breakthroughs in Test Kits and analyzers for ELISpot and FluoroSpot.
6. What are the notable trends driving market growth?
Assay Kits is Expected to Hold the Largest Market Share in the ELISpot and FluoroSpot Assay Market.
7. Are there any restraints impacting market growth?
Availability of alternative detection technologies.
8. Can you provide examples of recent developments in the market?
June 2022: BD and CerTest Biotec collaborated to create a molecular diagnostic test for the Monkeypox virus, a rare disease caused by a virus closely related to the smallpox virus. The collaboration aims to improve the diagnosis and management of Monkeypox infections. As part of the collaboration, the assay will leverage the BD MAX™ open system reagent suite to validate the CerTest VIASURE Monkeypox CE/IVD molecular test on the BD MAX™ System. The assay will be available for BD MAX™ users and may help advance understanding of the global spread of the disease.
9. What pricing options are available for accessing the report?
Pricing options include single-user, multi-user, and enterprise licenses priced at USD 4750, USD 5250, and USD 8750 respectively.
10. Is the market size provided in terms of value or volume?
The market size is provided in terms of value, measured in Million.
11. Are there any specific market keywords associated with the report?
Yes, the market keyword associated with the report is "ELISpot and Fluorospot Assay Industry," which aids in identifying and referencing the specific market segment covered.
12. How do I determine which pricing option suits my needs best?
The pricing options vary based on user requirements and access needs. Individual users may opt for single-user licenses, while businesses requiring broader access may choose multi-user or enterprise licenses for cost-effective access to the report.
13. Are there any additional resources or data provided in the ELISpot and Fluorospot Assay Industry report?
While the report offers comprehensive insights, it's advisable to review the specific contents or supplementary materials provided to ascertain if additional resources or data are available.
14. How can I stay updated on further developments or reports in the ELISpot and Fluorospot Assay Industry?
To stay informed about further developments, trends, and reports in the ELISpot and Fluorospot Assay Industry, consider subscribing to industry newsletters, following relevant companies and organizations, or regularly checking reputable industry news sources and publications.
Methodology
Step 1 - Identification of Relevant Samples Size from Population Database


Step 2 - Approaches for Defining Global Market Size (Value, Volume* & Price*)

Note*: In applicable scenarios
Step 3 - Data Sources
Primary Research
- Web Analytics
- Survey Reports
- Research Institute
- Latest Research Reports
- Opinion Leaders
Secondary Research
- Annual Reports
- White Paper
- Latest Press Release
- Industry Association
- Paid Database
- Investor Presentations

Step 4 - Data Triangulation
Involves using different sources of information in order to increase the validity of a study
These sources are likely to be stakeholders in a program - participants, other researchers, program staff, other community members, and so on.
Then we put all data in single framework & apply various statistical tools to find out the dynamic on the market.
During the analysis stage, feedback from the stakeholder groups would be compared to determine areas of agreement as well as areas of divergence


