

Key Insights
The global electronic watch market is poised for significant expansion, driven by increasing consumer demand for advanced wearable technology. The market is anticipated to grow at a compound annual growth rate (CAGR) of 5.06%, reaching an estimated market size of 77.48 billion by 2032. This robust growth is attributed to technological innovations such as enhanced health monitoring features, extended battery life, and seamless smartphone integration. The market is segmented across product types including smartwatches and sports watches, catering to diverse end-users like men, women, and unisex demographics. The category spans both mass-market and luxury segments, distributed through online and offline retail channels. The proliferation of e-commerce and targeted digital marketing strategies are accelerating market reach. The luxury segment, in particular, is experiencing substantial growth, supported by rising disposable incomes and a consumer preference for premium, technologically sophisticated timepieces.
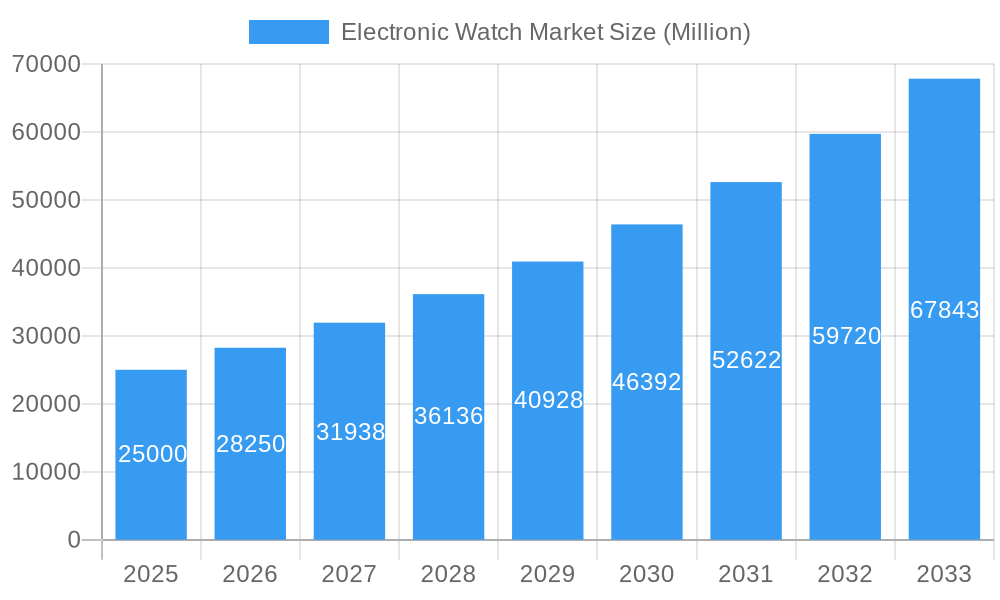
Electronic Watch Market Market Size (In Billion)
Despite market saturation risks and intense competition, the long-term outlook for the electronic watch market remains highly promising. Future growth will be further propelled by the integration of innovative features like contactless payments and augmented reality capabilities. Emerging economies present significant opportunities due to growing middle-class populations and increasing smartphone penetration. Strategic alliances between technology giants and traditional watchmakers are expected to foster innovation and broaden product offerings. Key industry players, including Apple, Samsung, Fitbit, and Garmin, alongside emerging brands, are actively competing through product differentiation, aggressive marketing, and continuous technological advancements. The escalating consumer focus on personalized health and wellness is a primary driver for feature-rich electronic watches. The forecast period, from the base year 2024 through 2033, indicates substantial growth potential, making this sector an attractive investment opportunity.
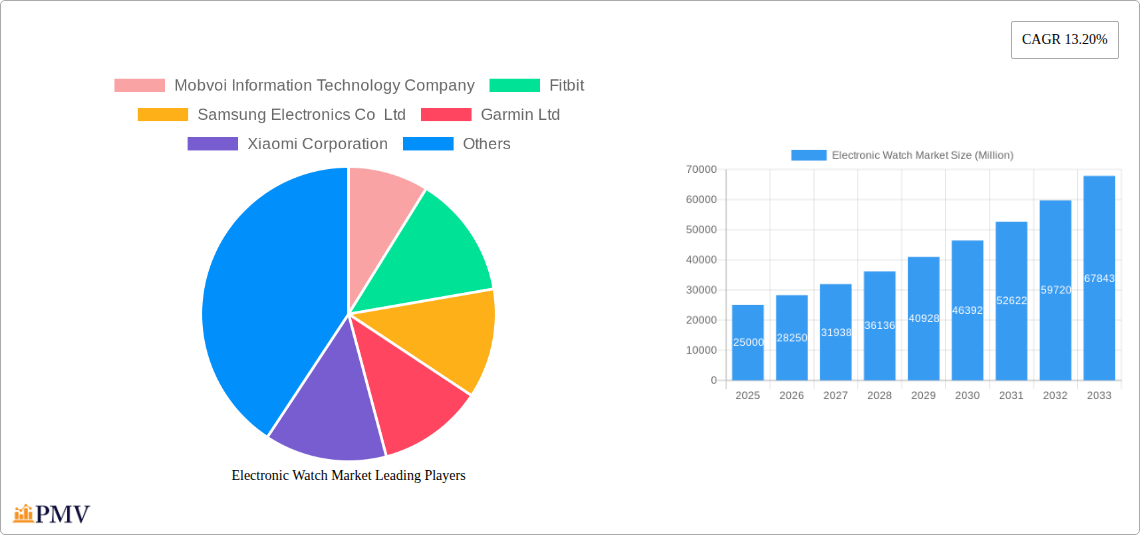
Electronic Watch Market Company Market Share
Electronic Watch Market: A Comprehensive Report (2019-2033)
This in-depth report provides a comprehensive analysis of the global Electronic Watch Market, offering valuable insights for industry stakeholders, investors, and researchers. The study period spans from 2019 to 2033, with 2025 serving as the base and estimated year. The report covers key market segments, competitive dynamics, and future growth projections, encompassing a detailed analysis of market size, value, and trends. The report projects a xx Million market value by 2033, exhibiting a CAGR of xx% during the forecast period (2025-2033).
Electronic Watch Market Market Structure & Competitive Dynamics
The global electronic watch market is characterized by a dynamic interplay of established players and emerging entrants. Market concentration is moderate, with several key players holding significant market share but not achieving dominance. The landscape is further shaped by a robust innovation ecosystem, driving the development of advanced features like health tracking, contactless payments, and improved connectivity. Regulatory frameworks, varying across regions, impact product compliance and market access. The market also faces competition from product substitutes, such as fitness trackers and smartphones, which offer overlapping functionalities. End-user preferences, particularly towards smartwatches and fitness-focused devices, are driving market growth.
Significant M&A activities have shaped the market, with deal values totaling xx Million in the last five years. These mergers and acquisitions often aimed at consolidating market share, enhancing technological capabilities, and expanding geographical reach.
- Market Share (2024 Estimates): Apple Inc. (xx%), Samsung Electronics Co Ltd (xx%), Garmin Ltd (xx%), Others (xx%).
- Recent M&A Activity: While specific deal values are not publicly available for all transactions, the average deal size is estimated at xx Million. These deals often involve smaller companies being acquired by larger players for technological advancements or geographic expansion.
Electronic Watch Market Industry Trends & Insights
The electronic watch market demonstrates robust growth driven by several converging trends. The increasing adoption of smartwatches, fueled by their diverse functionalities beyond timekeeping, is a key driver. The integration of health and fitness tracking features, coupled with advancements in wearable technology, enhances user engagement and expands the market. Consumer preferences shift towards stylish and functional devices, with a growing demand for personalized features. Technological disruptions, including improved battery life, advanced sensors, and enhanced connectivity, further propel market expansion. The market witnesses significant competition among key players, leading to product innovation and price optimization. This competitive landscape is likely to intensify with new entrants and expanding product portfolios. The market penetration of smartwatches is steadily increasing, particularly amongst younger demographics, contributing significantly to market growth.
Dominant Markets & Segments in Electronic Watch Market
The Asia-Pacific region currently dominates the global electronic watch market, primarily driven by the high demand in countries like China and India. This dominance is attributed to factors like a large consumer base, increasing disposable incomes, and a rising preference for technologically advanced products. Within the segment breakdown:
- By Product Type: Smartwatches dominate, due to their versatile functionality and increasing affordability.
- By End User: The Men’s segment currently leads due to higher disposable income and greater adoption of technology.
- By Category: Mass-market watches constitute the largest segment.
- By Distribution Channel: Online retail stores are experiencing rapid growth, owing to the convenience and reach of e-commerce platforms.
Key Drivers for Dominant Regions/Segments:
- Asia-Pacific: Rapid economic growth, expanding middle class, rising smartphone penetration.
- Smartwatches: Integration with fitness trackers and smartphones, increasing functionality.
- Men's Segment: Higher technology adoption and disposable income.
- Online Retail: Convenience, broader reach, competitive pricing.
Electronic Watch Market Product Innovations
Recent innovations in electronic watches focus on enhancing functionalities beyond basic timekeeping. This includes advanced health monitoring features (ECG, SpO2), improved GPS accuracy in sports watches, longer battery life, and seamless integration with smartphones and other smart devices. The trend toward minimalist designs alongside advanced features reflects consumer preferences. Key competitive advantages lie in offering unique features, superior user experience, and strong brand recognition. The adoption of new materials and manufacturing techniques is improving durability and aesthetics.
Report Segmentation & Scope
This report segments the electronic watch market across several key parameters:
- By Product Type: Smart Watches and Sports Watches, with detailed analysis of their respective market sizes, growth rates, and competitive landscapes. Smartwatches are projected to show faster growth, while sports watches will maintain a significant market share.
- By End User: Men, Women, and Unisex categories are analyzed, considering the different preferences and buying behaviors across genders. Men's segment will continue its dominance.
- By Category: Mass and Luxury categories highlight the diverse price points and target audience segments. The Mass segment will witness higher growth due to affordability.
- By Distribution Channel: Offline Retail Stores and Online Retail Stores reveal the evolving distribution landscape, with online channels showcasing rapid growth.
Key Drivers of Electronic Watch Market Growth
The Electronic Watch Market's growth is fueled by several key factors:
- Technological Advancements: Continuous innovation in sensors, battery technology, and connectivity enhances product functionality and appeal.
- Rising Disposable Incomes: Increased purchasing power, particularly in developing economies, fuels demand for electronic watches.
- Health and Fitness Focus: Integration of health tracking capabilities caters to the growing health-conscious population.
- Fashion and Style: Electronic watches are becoming fashion accessories, driving demand across various styles and designs.
Challenges in the Electronic Watch Market Sector
The Electronic Watch Market faces several challenges:
- Intense Competition: The market is crowded with established and emerging players, creating intense price competition.
- Supply Chain Disruptions: Global supply chain vulnerabilities can impact production and availability.
- Battery Life Limitations: Improving battery life remains a key challenge, particularly for feature-rich smartwatches.
- Data Privacy Concerns: Concerns over data security and privacy associated with wearable devices can impact consumer adoption.
Leading Players in the Electronic Watch Market Market
Key Developments in Electronic Watch Market Sector
- October 2021: Apple launched Apple Watch Series 7, featuring a larger display and improved features. This launch significantly impacted market dynamics, boosting sales and driving innovation among competitors.
- June 2021: Huawei Consumer Business Group launched the Huawei Watch 3 Series, powered by HarmonyOS 2, strengthening its position in the market.
- April 2022: Gizmore launched its first 'Made in India' smartwatch, demonstrating a shift towards local manufacturing and affordability.
Strategic Electronic Watch Market Market Outlook
The future of the electronic watch market looks promising, driven by continued technological advancements, growing consumer demand, and increased market penetration in developing economies. Strategic opportunities exist in developing niche products, improving battery technology, enhancing health and fitness functionalities, and expanding into new markets. The market will likely witness further consolidation through M&A activities and increased competition. Focus on sustainable manufacturing practices and ethical sourcing will also become increasingly important.
Electronic Watch Market Segmentation
-
1. Product type
- 1.1. Smart Watch
- 1.2. Sports Watch
-
2. End user
- 2.1. Men
- 2.2. Women
- 2.3. Unisex
-
3. Category
- 3.1. Mass
- 3.2. Luxury
-
4. Distribution Channel
- 4.1. Offline Retail Stores
- 4.2. Online Retail Stores
Electronic Watch Market Segmentation By Geography
-
1. North America
- 1.1. United States
- 1.2. Canada
- 1.3. Mexico
- 1.4. Rest of North America
-
2. Europe
- 2.1. United Kingdom
- 2.2. Germany
- 2.3. Spain
- 2.4. France
- 2.5. Italy
- 2.6. Russia
- 2.7. Rest of Europe
-
3. Asia Pacific
- 3.1. China
- 3.2. Japan
- 3.3. India
- 3.4. Australia
- 3.5. Rest of Asia Pacific
-
4. South America
- 4.1. Brazil
- 4.2. Argentina
- 4.3. Rest of South America
- 5. Middle East
-
6. United Arab Emirates
- 6.1. South Africa
- 6.2. Rest of Middle East
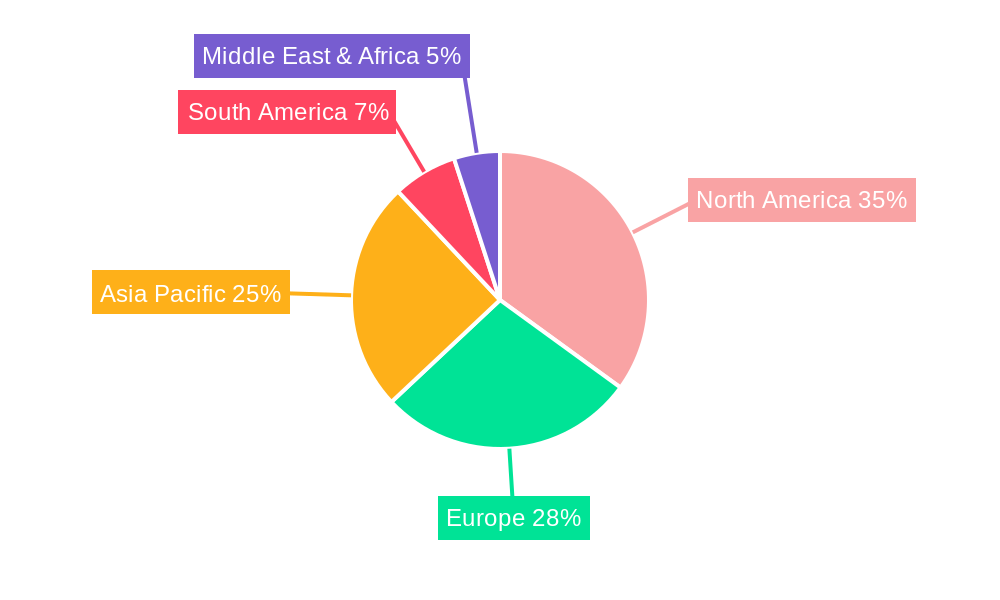
Electronic Watch Market Regional Market Share
Geographic Coverage of Electronic Watch Market
Electronic Watch Market REPORT HIGHLIGHTS
| Aspects | Details |
|---|---|
| Study Period | 2020-2034 |
| Base Year | 2025 |
| Estimated Year | 2026 |
| Forecast Period | 2026-2034 |
| Historical Period | 2020-2025 |
| Growth Rate | CAGR of 5.06% from 2020-2034 |
| Segmentation |
|
Table of Contents
- 1. Introduction
- 1.1. Research Scope
- 1.2. Market Segmentation
- 1.3. Research Objective
- 1.4. Definitions and Assumptions
- 2. Executive Summary
- 2.1. Market Snapshot
- 3. Market Dynamics
- 3.1. Market Drivers
- 3.2. Market Restrains
- 3.3. Market Trends
- 3.4. Market Opportunities
- 4. Market Factor Analysis
- 4.1. Porters Five Forces
- 4.1.1. Bargaining Power of Suppliers
- 4.1.2. Bargaining Power of Buyers
- 4.1.3. Threat of New Entrants
- 4.1.4. Threat of Substitutes
- 4.1.5. Competitive Rivalry
- 4.2. PESTEL analysis
- 4.3. BCG Analysis
- 4.3.1. Stars (High Growth, High Market Share)
- 4.3.2. Cash Cows (Low Growth, High Market Share)
- 4.3.3. Question Mark (High Growth, Low Market Share)
- 4.3.4. Dogs (Low Growth, Low Market Share)
- 4.4. Ansoff Matrix Analysis
- 4.5. Supply Chain Analysis
- 4.6. Regulatory Landscape
- 4.7. Current Market Potential and Opportunity Assessment (TAM–SAM–SOM Framework)
- 4.8. PMV Analyst Note
- 4.1. Porters Five Forces
- 5. Market Analysis, Insights and Forecast 2021-2033
- 5.1. Market Analysis, Insights and Forecast - by Product type
- 5.1.1. Smart Watch
- 5.1.2. Sports Watch
- 5.2. Market Analysis, Insights and Forecast - by End user
- 5.2.1. Men
- 5.2.2. Women
- 5.2.3. Unisex
- 5.3. Market Analysis, Insights and Forecast - by Category
- 5.3.1. Mass
- 5.3.2. Luxury
- 5.4. Market Analysis, Insights and Forecast - by Distribution Channel
- 5.4.1. Offline Retail Stores
- 5.4.2. Online Retail Stores
- 5.5. Market Analysis, Insights and Forecast - by Region
- 5.5.1. North America
- 5.5.2. Europe
- 5.5.3. Asia Pacific
- 5.5.4. South America
- 5.5.5. Middle East
- 5.5.6. United Arab Emirates
- 5.1. Market Analysis, Insights and Forecast - by Product type
- 6. Global Electronic Watch Market Analysis, Insights and Forecast, 2021-2033
- 6.1. Market Analysis, Insights and Forecast - by Product type
- 6.1.1. Smart Watch
- 6.1.2. Sports Watch
- 6.2. Market Analysis, Insights and Forecast - by End user
- 6.2.1. Men
- 6.2.2. Women
- 6.2.3. Unisex
- 6.3. Market Analysis, Insights and Forecast - by Category
- 6.3.1. Mass
- 6.3.2. Luxury
- 6.4. Market Analysis, Insights and Forecast - by Distribution Channel
- 6.4.1. Offline Retail Stores
- 6.4.2. Online Retail Stores
- 6.1. Market Analysis, Insights and Forecast - by Product type
- 7. North America Electronic Watch Market Analysis, Insights and Forecast, 2020-2032
- 7.1. Market Analysis, Insights and Forecast - by Product type
- 7.1.1. Smart Watch
- 7.1.2. Sports Watch
- 7.2. Market Analysis, Insights and Forecast - by End user
- 7.2.1. Men
- 7.2.2. Women
- 7.2.3. Unisex
- 7.3. Market Analysis, Insights and Forecast - by Category
- 7.3.1. Mass
- 7.3.2. Luxury
- 7.4. Market Analysis, Insights and Forecast - by Distribution Channel
- 7.4.1. Offline Retail Stores
- 7.4.2. Online Retail Stores
- 7.1. Market Analysis, Insights and Forecast - by Product type
- 8. Europe Electronic Watch Market Analysis, Insights and Forecast, 2020-2032
- 8.1. Market Analysis, Insights and Forecast - by Product type
- 8.1.1. Smart Watch
- 8.1.2. Sports Watch
- 8.2. Market Analysis, Insights and Forecast - by End user
- 8.2.1. Men
- 8.2.2. Women
- 8.2.3. Unisex
- 8.3. Market Analysis, Insights and Forecast - by Category
- 8.3.1. Mass
- 8.3.2. Luxury
- 8.4. Market Analysis, Insights and Forecast - by Distribution Channel
- 8.4.1. Offline Retail Stores
- 8.4.2. Online Retail Stores
- 8.1. Market Analysis, Insights and Forecast - by Product type
- 9. Asia Pacific Electronic Watch Market Analysis, Insights and Forecast, 2020-2032
- 9.1. Market Analysis, Insights and Forecast - by Product type
- 9.1.1. Smart Watch
- 9.1.2. Sports Watch
- 9.2. Market Analysis, Insights and Forecast - by End user
- 9.2.1. Men
- 9.2.2. Women
- 9.2.3. Unisex
- 9.3. Market Analysis, Insights and Forecast - by Category
- 9.3.1. Mass
- 9.3.2. Luxury
- 9.4. Market Analysis, Insights and Forecast - by Distribution Channel
- 9.4.1. Offline Retail Stores
- 9.4.2. Online Retail Stores
- 9.1. Market Analysis, Insights and Forecast - by Product type
- 10. South America Electronic Watch Market Analysis, Insights and Forecast, 2020-2032
- 10.1. Market Analysis, Insights and Forecast - by Product type
- 10.1.1. Smart Watch
- 10.1.2. Sports Watch
- 10.2. Market Analysis, Insights and Forecast - by End user
- 10.2.1. Men
- 10.2.2. Women
- 10.2.3. Unisex
- 10.3. Market Analysis, Insights and Forecast - by Category
- 10.3.1. Mass
- 10.3.2. Luxury
- 10.4. Market Analysis, Insights and Forecast - by Distribution Channel
- 10.4.1. Offline Retail Stores
- 10.4.2. Online Retail Stores
- 10.1. Market Analysis, Insights and Forecast - by Product type
- 11. Middle East Electronic Watch Market Analysis, Insights and Forecast, 2020-2032
- 11.1. Market Analysis, Insights and Forecast - by Product type
- 11.1.1. Smart Watch
- 11.1.2. Sports Watch
- 11.2. Market Analysis, Insights and Forecast - by End user
- 11.2.1. Men
- 11.2.2. Women
- 11.2.3. Unisex
- 11.3. Market Analysis, Insights and Forecast - by Category
- 11.3.1. Mass
- 11.3.2. Luxury
- 11.4. Market Analysis, Insights and Forecast - by Distribution Channel
- 11.4.1. Offline Retail Stores
- 11.4.2. Online Retail Stores
- 11.1. Market Analysis, Insights and Forecast - by Product type
- 12. United Arab Emirates Electronic Watch Market Analysis, Insights and Forecast, 2020-2032
- 12.1. Market Analysis, Insights and Forecast - by Product type
- 12.1.1. Smart Watch
- 12.1.2. Sports Watch
- 12.2. Market Analysis, Insights and Forecast - by End user
- 12.2.1. Men
- 12.2.2. Women
- 12.2.3. Unisex
- 12.3. Market Analysis, Insights and Forecast - by Category
- 12.3.1. Mass
- 12.3.2. Luxury
- 12.4. Market Analysis, Insights and Forecast - by Distribution Channel
- 12.4.1. Offline Retail Stores
- 12.4.2. Online Retail Stores
- 12.1. Market Analysis, Insights and Forecast - by Product type
- 13. Competitive Analysis
- 13.1. Company Profiles
- 13.1.1 Mobvoi Information Technology Company
- 13.1.1.1. Company Overview
- 13.1.1.2. Products
- 13.1.1.3. Company Financials
- 13.1.1.4. SWOT Analysis
- 13.1.2 Fitbit
- 13.1.2.1. Company Overview
- 13.1.2.2. Products
- 13.1.2.3. Company Financials
- 13.1.2.4. SWOT Analysis
- 13.1.3 Samsung Electronics Co Ltd
- 13.1.3.1. Company Overview
- 13.1.3.2. Products
- 13.1.3.3. Company Financials
- 13.1.3.4. SWOT Analysis
- 13.1.4 Garmin Ltd
- 13.1.4.1. Company Overview
- 13.1.4.2. Products
- 13.1.4.3. Company Financials
- 13.1.4.4. SWOT Analysis
- 13.1.5 Xiaomi Corporation
- 13.1.5.1. Company Overview
- 13.1.5.2. Products
- 13.1.5.3. Company Financials
- 13.1.5.4. SWOT Analysis
- 13.1.6 TAG Heuer S A*List Not Exhaustive
- 13.1.6.1. Company Overview
- 13.1.6.2. Products
- 13.1.6.3. Company Financials
- 13.1.6.4. SWOT Analysis
- 13.1.7 Zepp Health
- 13.1.7.1. Company Overview
- 13.1.7.2. Products
- 13.1.7.3. Company Financials
- 13.1.7.4. SWOT Analysis
- 13.1.8 Fossil Group Inc
- 13.1.8.1. Company Overview
- 13.1.8.2. Products
- 13.1.8.3. Company Financials
- 13.1.8.4. SWOT Analysis
- 13.1.9 Apple Inc
- 13.1.9.1. Company Overview
- 13.1.9.2. Products
- 13.1.9.3. Company Financials
- 13.1.9.4. SWOT Analysis
- 13.1.10 Huawei Device Co Ltd
- 13.1.10.1. Company Overview
- 13.1.10.2. Products
- 13.1.10.3. Company Financials
- 13.1.10.4. SWOT Analysis
- 13.1.1 Mobvoi Information Technology Company
- 13.2. Market Entropy
- 13.2.1 Company's Key Areas Served
- 13.2.2 Recent Developments
- 13.3. Company Market Share Analysis 2025
- 13.3.1 Top 5 Companies Market Share Analysis
- 13.3.2 Top 3 Companies Market Share Analysis
- 13.4. List of Potential Customers
- 14. Research Methodology
List of Figures
- Figure 1: Global Electronic Watch Market Revenue Breakdown (billion, %) by Region 2025 & 2033
- Figure 2: Global Electronic Watch Market Volume Breakdown (K Units , %) by Region 2025 & 2033
- Figure 3: North America Electronic Watch Market Revenue (billion), by Product type 2025 & 2033
- Figure 4: North America Electronic Watch Market Volume (K Units ), by Product type 2025 & 2033
- Figure 5: North America Electronic Watch Market Revenue Share (%), by Product type 2025 & 2033
- Figure 6: North America Electronic Watch Market Volume Share (%), by Product type 2025 & 2033
- Figure 7: North America Electronic Watch Market Revenue (billion), by End user 2025 & 2033
- Figure 8: North America Electronic Watch Market Volume (K Units ), by End user 2025 & 2033
- Figure 9: North America Electronic Watch Market Revenue Share (%), by End user 2025 & 2033
- Figure 10: North America Electronic Watch Market Volume Share (%), by End user 2025 & 2033
- Figure 11: North America Electronic Watch Market Revenue (billion), by Category 2025 & 2033
- Figure 12: North America Electronic Watch Market Volume (K Units ), by Category 2025 & 2033
- Figure 13: North America Electronic Watch Market Revenue Share (%), by Category 2025 & 2033
- Figure 14: North America Electronic Watch Market Volume Share (%), by Category 2025 & 2033
- Figure 15: North America Electronic Watch Market Revenue (billion), by Distribution Channel 2025 & 2033
- Figure 16: North America Electronic Watch Market Volume (K Units ), by Distribution Channel 2025 & 2033
- Figure 17: North America Electronic Watch Market Revenue Share (%), by Distribution Channel 2025 & 2033
- Figure 18: North America Electronic Watch Market Volume Share (%), by Distribution Channel 2025 & 2033
- Figure 19: North America Electronic Watch Market Revenue (billion), by Country 2025 & 2033
- Figure 20: North America Electronic Watch Market Volume (K Units ), by Country 2025 & 2033
- Figure 21: North America Electronic Watch Market Revenue Share (%), by Country 2025 & 2033
- Figure 22: North America Electronic Watch Market Volume Share (%), by Country 2025 & 2033
- Figure 23: Europe Electronic Watch Market Revenue (billion), by Product type 2025 & 2033
- Figure 24: Europe Electronic Watch Market Volume (K Units ), by Product type 2025 & 2033
- Figure 25: Europe Electronic Watch Market Revenue Share (%), by Product type 2025 & 2033
- Figure 26: Europe Electronic Watch Market Volume Share (%), by Product type 2025 & 2033
- Figure 27: Europe Electronic Watch Market Revenue (billion), by End user 2025 & 2033
- Figure 28: Europe Electronic Watch Market Volume (K Units ), by End user 2025 & 2033
- Figure 29: Europe Electronic Watch Market Revenue Share (%), by End user 2025 & 2033
- Figure 30: Europe Electronic Watch Market Volume Share (%), by End user 2025 & 2033
- Figure 31: Europe Electronic Watch Market Revenue (billion), by Category 2025 & 2033
- Figure 32: Europe Electronic Watch Market Volume (K Units ), by Category 2025 & 2033
- Figure 33: Europe Electronic Watch Market Revenue Share (%), by Category 2025 & 2033
- Figure 34: Europe Electronic Watch Market Volume Share (%), by Category 2025 & 2033
- Figure 35: Europe Electronic Watch Market Revenue (billion), by Distribution Channel 2025 & 2033
- Figure 36: Europe Electronic Watch Market Volume (K Units ), by Distribution Channel 2025 & 2033
- Figure 37: Europe Electronic Watch Market Revenue Share (%), by Distribution Channel 2025 & 2033
- Figure 38: Europe Electronic Watch Market Volume Share (%), by Distribution Channel 2025 & 2033
- Figure 39: Europe Electronic Watch Market Revenue (billion), by Country 2025 & 2033
- Figure 40: Europe Electronic Watch Market Volume (K Units ), by Country 2025 & 2033
- Figure 41: Europe Electronic Watch Market Revenue Share (%), by Country 2025 & 2033
- Figure 42: Europe Electronic Watch Market Volume Share (%), by Country 2025 & 2033
- Figure 43: Asia Pacific Electronic Watch Market Revenue (billion), by Product type 2025 & 2033
- Figure 44: Asia Pacific Electronic Watch Market Volume (K Units ), by Product type 2025 & 2033
- Figure 45: Asia Pacific Electronic Watch Market Revenue Share (%), by Product type 2025 & 2033
- Figure 46: Asia Pacific Electronic Watch Market Volume Share (%), by Product type 2025 & 2033
- Figure 47: Asia Pacific Electronic Watch Market Revenue (billion), by End user 2025 & 2033
- Figure 48: Asia Pacific Electronic Watch Market Volume (K Units ), by End user 2025 & 2033
- Figure 49: Asia Pacific Electronic Watch Market Revenue Share (%), by End user 2025 & 2033
- Figure 50: Asia Pacific Electronic Watch Market Volume Share (%), by End user 2025 & 2033
- Figure 51: Asia Pacific Electronic Watch Market Revenue (billion), by Category 2025 & 2033
- Figure 52: Asia Pacific Electronic Watch Market Volume (K Units ), by Category 2025 & 2033
- Figure 53: Asia Pacific Electronic Watch Market Revenue Share (%), by Category 2025 & 2033
- Figure 54: Asia Pacific Electronic Watch Market Volume Share (%), by Category 2025 & 2033
- Figure 55: Asia Pacific Electronic Watch Market Revenue (billion), by Distribution Channel 2025 & 2033
- Figure 56: Asia Pacific Electronic Watch Market Volume (K Units ), by Distribution Channel 2025 & 2033
- Figure 57: Asia Pacific Electronic Watch Market Revenue Share (%), by Distribution Channel 2025 & 2033
- Figure 58: Asia Pacific Electronic Watch Market Volume Share (%), by Distribution Channel 2025 & 2033
- Figure 59: Asia Pacific Electronic Watch Market Revenue (billion), by Country 2025 & 2033
- Figure 60: Asia Pacific Electronic Watch Market Volume (K Units ), by Country 2025 & 2033
- Figure 61: Asia Pacific Electronic Watch Market Revenue Share (%), by Country 2025 & 2033
- Figure 62: Asia Pacific Electronic Watch Market Volume Share (%), by Country 2025 & 2033
- Figure 63: South America Electronic Watch Market Revenue (billion), by Product type 2025 & 2033
- Figure 64: South America Electronic Watch Market Volume (K Units ), by Product type 2025 & 2033
- Figure 65: South America Electronic Watch Market Revenue Share (%), by Product type 2025 & 2033
- Figure 66: South America Electronic Watch Market Volume Share (%), by Product type 2025 & 2033
- Figure 67: South America Electronic Watch Market Revenue (billion), by End user 2025 & 2033
- Figure 68: South America Electronic Watch Market Volume (K Units ), by End user 2025 & 2033
- Figure 69: South America Electronic Watch Market Revenue Share (%), by End user 2025 & 2033
- Figure 70: South America Electronic Watch Market Volume Share (%), by End user 2025 & 2033
- Figure 71: South America Electronic Watch Market Revenue (billion), by Category 2025 & 2033
- Figure 72: South America Electronic Watch Market Volume (K Units ), by Category 2025 & 2033
- Figure 73: South America Electronic Watch Market Revenue Share (%), by Category 2025 & 2033
- Figure 74: South America Electronic Watch Market Volume Share (%), by Category 2025 & 2033
- Figure 75: South America Electronic Watch Market Revenue (billion), by Distribution Channel 2025 & 2033
- Figure 76: South America Electronic Watch Market Volume (K Units ), by Distribution Channel 2025 & 2033
- Figure 77: South America Electronic Watch Market Revenue Share (%), by Distribution Channel 2025 & 2033
- Figure 78: South America Electronic Watch Market Volume Share (%), by Distribution Channel 2025 & 2033
- Figure 79: South America Electronic Watch Market Revenue (billion), by Country 2025 & 2033
- Figure 80: South America Electronic Watch Market Volume (K Units ), by Country 2025 & 2033
- Figure 81: South America Electronic Watch Market Revenue Share (%), by Country 2025 & 2033
- Figure 82: South America Electronic Watch Market Volume Share (%), by Country 2025 & 2033
- Figure 83: Middle East Electronic Watch Market Revenue (billion), by Product type 2025 & 2033
- Figure 84: Middle East Electronic Watch Market Volume (K Units ), by Product type 2025 & 2033
- Figure 85: Middle East Electronic Watch Market Revenue Share (%), by Product type 2025 & 2033
- Figure 86: Middle East Electronic Watch Market Volume Share (%), by Product type 2025 & 2033
- Figure 87: Middle East Electronic Watch Market Revenue (billion), by End user 2025 & 2033
- Figure 88: Middle East Electronic Watch Market Volume (K Units ), by End user 2025 & 2033
- Figure 89: Middle East Electronic Watch Market Revenue Share (%), by End user 2025 & 2033
- Figure 90: Middle East Electronic Watch Market Volume Share (%), by End user 2025 & 2033
- Figure 91: Middle East Electronic Watch Market Revenue (billion), by Category 2025 & 2033
- Figure 92: Middle East Electronic Watch Market Volume (K Units ), by Category 2025 & 2033
- Figure 93: Middle East Electronic Watch Market Revenue Share (%), by Category 2025 & 2033
- Figure 94: Middle East Electronic Watch Market Volume Share (%), by Category 2025 & 2033
- Figure 95: Middle East Electronic Watch Market Revenue (billion), by Distribution Channel 2025 & 2033
- Figure 96: Middle East Electronic Watch Market Volume (K Units ), by Distribution Channel 2025 & 2033
- Figure 97: Middle East Electronic Watch Market Revenue Share (%), by Distribution Channel 2025 & 2033
- Figure 98: Middle East Electronic Watch Market Volume Share (%), by Distribution Channel 2025 & 2033
- Figure 99: Middle East Electronic Watch Market Revenue (billion), by Country 2025 & 2033
- Figure 100: Middle East Electronic Watch Market Volume (K Units ), by Country 2025 & 2033
- Figure 101: Middle East Electronic Watch Market Revenue Share (%), by Country 2025 & 2033
- Figure 102: Middle East Electronic Watch Market Volume Share (%), by Country 2025 & 2033
- Figure 103: United Arab Emirates Electronic Watch Market Revenue (billion), by Product type 2025 & 2033
- Figure 104: United Arab Emirates Electronic Watch Market Volume (K Units ), by Product type 2025 & 2033
- Figure 105: United Arab Emirates Electronic Watch Market Revenue Share (%), by Product type 2025 & 2033
- Figure 106: United Arab Emirates Electronic Watch Market Volume Share (%), by Product type 2025 & 2033
- Figure 107: United Arab Emirates Electronic Watch Market Revenue (billion), by End user 2025 & 2033
- Figure 108: United Arab Emirates Electronic Watch Market Volume (K Units ), by End user 2025 & 2033
- Figure 109: United Arab Emirates Electronic Watch Market Revenue Share (%), by End user 2025 & 2033
- Figure 110: United Arab Emirates Electronic Watch Market Volume Share (%), by End user 2025 & 2033
- Figure 111: United Arab Emirates Electronic Watch Market Revenue (billion), by Category 2025 & 2033
- Figure 112: United Arab Emirates Electronic Watch Market Volume (K Units ), by Category 2025 & 2033
- Figure 113: United Arab Emirates Electronic Watch Market Revenue Share (%), by Category 2025 & 2033
- Figure 114: United Arab Emirates Electronic Watch Market Volume Share (%), by Category 2025 & 2033
- Figure 115: United Arab Emirates Electronic Watch Market Revenue (billion), by Distribution Channel 2025 & 2033
- Figure 116: United Arab Emirates Electronic Watch Market Volume (K Units ), by Distribution Channel 2025 & 2033
- Figure 117: United Arab Emirates Electronic Watch Market Revenue Share (%), by Distribution Channel 2025 & 2033
- Figure 118: United Arab Emirates Electronic Watch Market Volume Share (%), by Distribution Channel 2025 & 2033
- Figure 119: United Arab Emirates Electronic Watch Market Revenue (billion), by Country 2025 & 2033
- Figure 120: United Arab Emirates Electronic Watch Market Volume (K Units ), by Country 2025 & 2033
- Figure 121: United Arab Emirates Electronic Watch Market Revenue Share (%), by Country 2025 & 2033
- Figure 122: United Arab Emirates Electronic Watch Market Volume Share (%), by Country 2025 & 2033
List of Tables
- Table 1: Global Electronic Watch Market Revenue billion Forecast, by Product type 2020 & 2033
- Table 2: Global Electronic Watch Market Volume K Units Forecast, by Product type 2020 & 2033
- Table 3: Global Electronic Watch Market Revenue billion Forecast, by End user 2020 & 2033
- Table 4: Global Electronic Watch Market Volume K Units Forecast, by End user 2020 & 2033
- Table 5: Global Electronic Watch Market Revenue billion Forecast, by Category 2020 & 2033
- Table 6: Global Electronic Watch Market Volume K Units Forecast, by Category 2020 & 2033
- Table 7: Global Electronic Watch Market Revenue billion Forecast, by Distribution Channel 2020 & 2033
- Table 8: Global Electronic Watch Market Volume K Units Forecast, by Distribution Channel 2020 & 2033
- Table 9: Global Electronic Watch Market Revenue billion Forecast, by Region 2020 & 2033
- Table 10: Global Electronic Watch Market Volume K Units Forecast, by Region 2020 & 2033
- Table 11: Global Electronic Watch Market Revenue billion Forecast, by Product type 2020 & 2033
- Table 12: Global Electronic Watch Market Volume K Units Forecast, by Product type 2020 & 2033
- Table 13: Global Electronic Watch Market Revenue billion Forecast, by End user 2020 & 2033
- Table 14: Global Electronic Watch Market Volume K Units Forecast, by End user 2020 & 2033
- Table 15: Global Electronic Watch Market Revenue billion Forecast, by Category 2020 & 2033
- Table 16: Global Electronic Watch Market Volume K Units Forecast, by Category 2020 & 2033
- Table 17: Global Electronic Watch Market Revenue billion Forecast, by Distribution Channel 2020 & 2033
- Table 18: Global Electronic Watch Market Volume K Units Forecast, by Distribution Channel 2020 & 2033
- Table 19: Global Electronic Watch Market Revenue billion Forecast, by Country 2020 & 2033
- Table 20: Global Electronic Watch Market Volume K Units Forecast, by Country 2020 & 2033
- Table 21: United States Electronic Watch Market Revenue (billion) Forecast, by Application 2020 & 2033
- Table 22: United States Electronic Watch Market Volume (K Units ) Forecast, by Application 2020 & 2033
- Table 23: Canada Electronic Watch Market Revenue (billion) Forecast, by Application 2020 & 2033
- Table 24: Canada Electronic Watch Market Volume (K Units ) Forecast, by Application 2020 & 2033
- Table 25: Mexico Electronic Watch Market Revenue (billion) Forecast, by Application 2020 & 2033
- Table 26: Mexico Electronic Watch Market Volume (K Units ) Forecast, by Application 2020 & 2033
- Table 27: Rest of North America Electronic Watch Market Revenue (billion) Forecast, by Application 2020 & 2033
- Table 28: Rest of North America Electronic Watch Market Volume (K Units ) Forecast, by Application 2020 & 2033
- Table 29: Global Electronic Watch Market Revenue billion Forecast, by Product type 2020 & 2033
- Table 30: Global Electronic Watch Market Volume K Units Forecast, by Product type 2020 & 2033
- Table 31: Global Electronic Watch Market Revenue billion Forecast, by End user 2020 & 2033
- Table 32: Global Electronic Watch Market Volume K Units Forecast, by End user 2020 & 2033
- Table 33: Global Electronic Watch Market Revenue billion Forecast, by Category 2020 & 2033
- Table 34: Global Electronic Watch Market Volume K Units Forecast, by Category 2020 & 2033
- Table 35: Global Electronic Watch Market Revenue billion Forecast, by Distribution Channel 2020 & 2033
- Table 36: Global Electronic Watch Market Volume K Units Forecast, by Distribution Channel 2020 & 2033
- Table 37: Global Electronic Watch Market Revenue billion Forecast, by Country 2020 & 2033
- Table 38: Global Electronic Watch Market Volume K Units Forecast, by Country 2020 & 2033
- Table 39: United Kingdom Electronic Watch Market Revenue (billion) Forecast, by Application 2020 & 2033
- Table 40: United Kingdom Electronic Watch Market Volume (K Units ) Forecast, by Application 2020 & 2033
- Table 41: Germany Electronic Watch Market Revenue (billion) Forecast, by Application 2020 & 2033
- Table 42: Germany Electronic Watch Market Volume (K Units ) Forecast, by Application 2020 & 2033
- Table 43: Spain Electronic Watch Market Revenue (billion) Forecast, by Application 2020 & 2033
- Table 44: Spain Electronic Watch Market Volume (K Units ) Forecast, by Application 2020 & 2033
- Table 45: France Electronic Watch Market Revenue (billion) Forecast, by Application 2020 & 2033
- Table 46: France Electronic Watch Market Volume (K Units ) Forecast, by Application 2020 & 2033
- Table 47: Italy Electronic Watch Market Revenue (billion) Forecast, by Application 2020 & 2033
- Table 48: Italy Electronic Watch Market Volume (K Units ) Forecast, by Application 2020 & 2033
- Table 49: Russia Electronic Watch Market Revenue (billion) Forecast, by Application 2020 & 2033
- Table 50: Russia Electronic Watch Market Volume (K Units ) Forecast, by Application 2020 & 2033
- Table 51: Rest of Europe Electronic Watch Market Revenue (billion) Forecast, by Application 2020 & 2033
- Table 52: Rest of Europe Electronic Watch Market Volume (K Units ) Forecast, by Application 2020 & 2033
- Table 53: Global Electronic Watch Market Revenue billion Forecast, by Product type 2020 & 2033
- Table 54: Global Electronic Watch Market Volume K Units Forecast, by Product type 2020 & 2033
- Table 55: Global Electronic Watch Market Revenue billion Forecast, by End user 2020 & 2033
- Table 56: Global Electronic Watch Market Volume K Units Forecast, by End user 2020 & 2033
- Table 57: Global Electronic Watch Market Revenue billion Forecast, by Category 2020 & 2033
- Table 58: Global Electronic Watch Market Volume K Units Forecast, by Category 2020 & 2033
- Table 59: Global Electronic Watch Market Revenue billion Forecast, by Distribution Channel 2020 & 2033
- Table 60: Global Electronic Watch Market Volume K Units Forecast, by Distribution Channel 2020 & 2033
- Table 61: Global Electronic Watch Market Revenue billion Forecast, by Country 2020 & 2033
- Table 62: Global Electronic Watch Market Volume K Units Forecast, by Country 2020 & 2033
- Table 63: China Electronic Watch Market Revenue (billion) Forecast, by Application 2020 & 2033
- Table 64: China Electronic Watch Market Volume (K Units ) Forecast, by Application 2020 & 2033
- Table 65: Japan Electronic Watch Market Revenue (billion) Forecast, by Application 2020 & 2033
- Table 66: Japan Electronic Watch Market Volume (K Units ) Forecast, by Application 2020 & 2033
- Table 67: India Electronic Watch Market Revenue (billion) Forecast, by Application 2020 & 2033
- Table 68: India Electronic Watch Market Volume (K Units ) Forecast, by Application 2020 & 2033
- Table 69: Australia Electronic Watch Market Revenue (billion) Forecast, by Application 2020 & 2033
- Table 70: Australia Electronic Watch Market Volume (K Units ) Forecast, by Application 2020 & 2033
- Table 71: Rest of Asia Pacific Electronic Watch Market Revenue (billion) Forecast, by Application 2020 & 2033
- Table 72: Rest of Asia Pacific Electronic Watch Market Volume (K Units ) Forecast, by Application 2020 & 2033
- Table 73: Global Electronic Watch Market Revenue billion Forecast, by Product type 2020 & 2033
- Table 74: Global Electronic Watch Market Volume K Units Forecast, by Product type 2020 & 2033
- Table 75: Global Electronic Watch Market Revenue billion Forecast, by End user 2020 & 2033
- Table 76: Global Electronic Watch Market Volume K Units Forecast, by End user 2020 & 2033
- Table 77: Global Electronic Watch Market Revenue billion Forecast, by Category 2020 & 2033
- Table 78: Global Electronic Watch Market Volume K Units Forecast, by Category 2020 & 2033
- Table 79: Global Electronic Watch Market Revenue billion Forecast, by Distribution Channel 2020 & 2033
- Table 80: Global Electronic Watch Market Volume K Units Forecast, by Distribution Channel 2020 & 2033
- Table 81: Global Electronic Watch Market Revenue billion Forecast, by Country 2020 & 2033
- Table 82: Global Electronic Watch Market Volume K Units Forecast, by Country 2020 & 2033
- Table 83: Brazil Electronic Watch Market Revenue (billion) Forecast, by Application 2020 & 2033
- Table 84: Brazil Electronic Watch Market Volume (K Units ) Forecast, by Application 2020 & 2033
- Table 85: Argentina Electronic Watch Market Revenue (billion) Forecast, by Application 2020 & 2033
- Table 86: Argentina Electronic Watch Market Volume (K Units ) Forecast, by Application 2020 & 2033
- Table 87: Rest of South America Electronic Watch Market Revenue (billion) Forecast, by Application 2020 & 2033
- Table 88: Rest of South America Electronic Watch Market Volume (K Units ) Forecast, by Application 2020 & 2033
- Table 89: Global Electronic Watch Market Revenue billion Forecast, by Product type 2020 & 2033
- Table 90: Global Electronic Watch Market Volume K Units Forecast, by Product type 2020 & 2033
- Table 91: Global Electronic Watch Market Revenue billion Forecast, by End user 2020 & 2033
- Table 92: Global Electronic Watch Market Volume K Units Forecast, by End user 2020 & 2033
- Table 93: Global Electronic Watch Market Revenue billion Forecast, by Category 2020 & 2033
- Table 94: Global Electronic Watch Market Volume K Units Forecast, by Category 2020 & 2033
- Table 95: Global Electronic Watch Market Revenue billion Forecast, by Distribution Channel 2020 & 2033
- Table 96: Global Electronic Watch Market Volume K Units Forecast, by Distribution Channel 2020 & 2033
- Table 97: Global Electronic Watch Market Revenue billion Forecast, by Country 2020 & 2033
- Table 98: Global Electronic Watch Market Volume K Units Forecast, by Country 2020 & 2033
- Table 99: Global Electronic Watch Market Revenue billion Forecast, by Product type 2020 & 2033
- Table 100: Global Electronic Watch Market Volume K Units Forecast, by Product type 2020 & 2033
- Table 101: Global Electronic Watch Market Revenue billion Forecast, by End user 2020 & 2033
- Table 102: Global Electronic Watch Market Volume K Units Forecast, by End user 2020 & 2033
- Table 103: Global Electronic Watch Market Revenue billion Forecast, by Category 2020 & 2033
- Table 104: Global Electronic Watch Market Volume K Units Forecast, by Category 2020 & 2033
- Table 105: Global Electronic Watch Market Revenue billion Forecast, by Distribution Channel 2020 & 2033
- Table 106: Global Electronic Watch Market Volume K Units Forecast, by Distribution Channel 2020 & 2033
- Table 107: Global Electronic Watch Market Revenue billion Forecast, by Country 2020 & 2033
- Table 108: Global Electronic Watch Market Volume K Units Forecast, by Country 2020 & 2033
- Table 109: South Africa Electronic Watch Market Revenue (billion) Forecast, by Application 2020 & 2033
- Table 110: South Africa Electronic Watch Market Volume (K Units ) Forecast, by Application 2020 & 2033
- Table 111: Rest of Middle East Electronic Watch Market Revenue (billion) Forecast, by Application 2020 & 2033
- Table 112: Rest of Middle East Electronic Watch Market Volume (K Units ) Forecast, by Application 2020 & 2033
Frequently Asked Questions
1. What is the projected Compound Annual Growth Rate (CAGR) of the Electronic Watch Market?
The projected CAGR is approximately 5.06%.
2. Which companies are prominent players in the Electronic Watch Market?
Key companies in the market include Mobvoi Information Technology Company, Fitbit, Samsung Electronics Co Ltd, Garmin Ltd, Xiaomi Corporation, TAG Heuer S A*List Not Exhaustive, Zepp Health, Fossil Group Inc, Apple Inc, Huawei Device Co Ltd.
3. What are the main segments of the Electronic Watch Market?
The market segments include Product type, End user, Category, Distribution Channel.
4. Can you provide details about the market size?
The market size is estimated to be USD 77.48 billion as of 2022.
5. What are some drivers contributing to market growth?
Aggressive Marketing and Strategic Investments by Key Players; Growing Prevalence of Smokeless Tobacco Supported By Growth in Production of Tobacco.
6. What are the notable trends driving market growth?
Strong Demand from Fitness Conscious Consumer.
7. Are there any restraints impacting market growth?
Stringent Government Regulations Leading to Ban on Smokeless Tobacco.
8. Can you provide examples of recent developments in the market?
In April 2022, India-based smart accessories and audio brand Gizmore has launched its first 'Made in India' smartwatch with premium features at an affordable price.
9. What pricing options are available for accessing the report?
Pricing options include single-user, multi-user, and enterprise licenses priced at USD 4750, USD 5250, and USD 8750 respectively.
10. Is the market size provided in terms of value or volume?
The market size is provided in terms of value, measured in billion and volume, measured in K Units .
11. Are there any specific market keywords associated with the report?
Yes, the market keyword associated with the report is "Electronic Watch Market," which aids in identifying and referencing the specific market segment covered.
12. How do I determine which pricing option suits my needs best?
The pricing options vary based on user requirements and access needs. Individual users may opt for single-user licenses, while businesses requiring broader access may choose multi-user or enterprise licenses for cost-effective access to the report.
13. Are there any additional resources or data provided in the Electronic Watch Market report?
While the report offers comprehensive insights, it's advisable to review the specific contents or supplementary materials provided to ascertain if additional resources or data are available.
14. How can I stay updated on further developments or reports in the Electronic Watch Market?
To stay informed about further developments, trends, and reports in the Electronic Watch Market, consider subscribing to industry newsletters, following relevant companies and organizations, or regularly checking reputable industry news sources and publications.
Methodology
Step 1 - Identification of Relevant Samples Size from Population Database


Step 2 - Approaches for Defining Global Market Size (Value, Volume* & Price*)

Note*: In applicable scenarios
Step 3 - Data Sources
Primary Research
- Web Analytics
- Survey Reports
- Research Institute
- Latest Research Reports
- Opinion Leaders
Secondary Research
- Annual Reports
- White Paper
- Latest Press Release
- Industry Association
- Paid Database
- Investor Presentations

Step 4 - Data Triangulation
Involves using different sources of information in order to increase the validity of a study
These sources are likely to be stakeholders in a program - participants, other researchers, program staff, other community members, and so on.
Then we put all data in single framework & apply various statistical tools to find out the dynamic on the market.
During the analysis stage, feedback from the stakeholder groups would be compared to determine areas of agreement as well as areas of divergence