
Key Insights
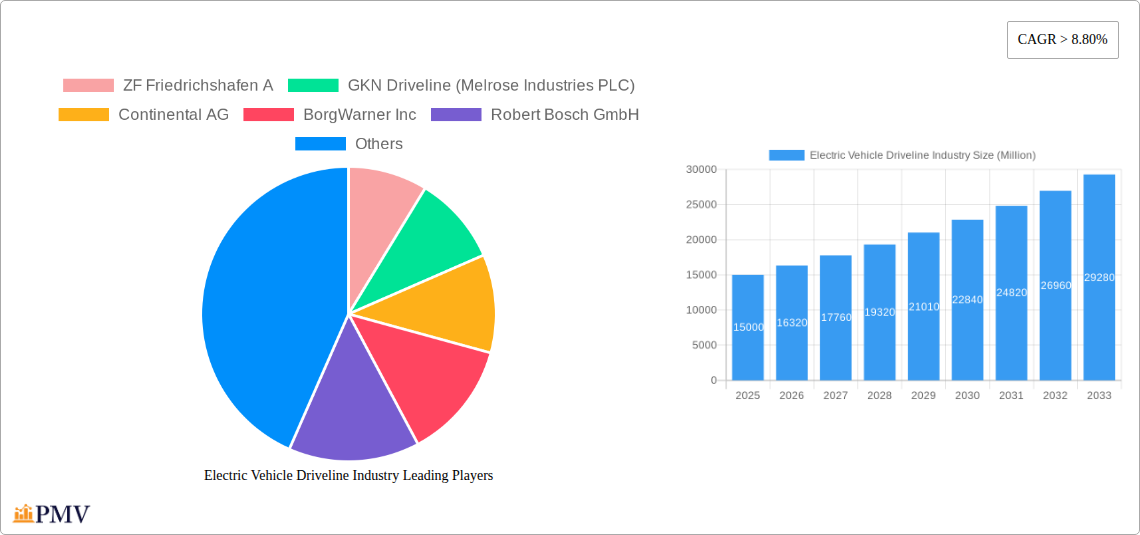
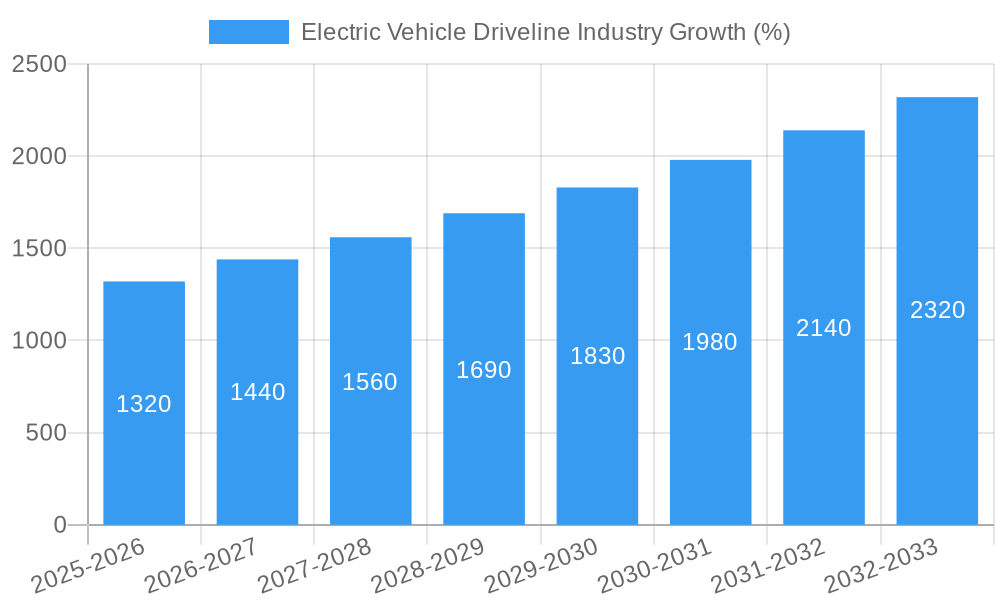
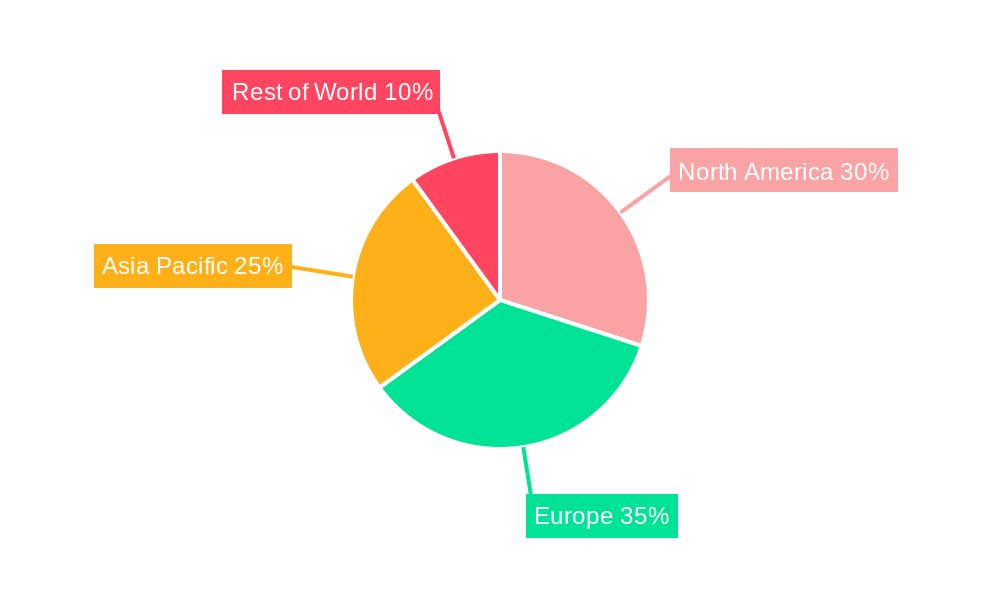
The electric vehicle (EV) driveline market is experiencing robust growth, projected to maintain a Compound Annual Growth Rate (CAGR) exceeding 8.80% from 2025 to 2033. This surge is driven by the escalating demand for electric vehicles globally, fueled by increasing environmental concerns, government incentives promoting EV adoption, and advancements in battery technology leading to longer ranges and improved performance. Key market segments include hybrid vehicles (HEV), plug-in hybrid vehicles (PHEV), and battery electric vehicles (BEV), with diverse drivetrain configurations such as series, parallel, and power-split systems. The market is further segmented by transmission type (automatic, dual-clutch, and electric-continuously variable), motor power (45-100 kW, 100-250 kW, and >250 kW), and drive type (FWD, RWD, AWD). Major players like ZF Friedrichshafen, GKN Driveline, Continental AG, and others are actively investing in research and development to enhance drivetrain efficiency, reduce costs, and cater to the evolving needs of the EV industry. The geographic distribution shows significant market potential across North America, Europe, and Asia Pacific, with China and other emerging economies expected to contribute substantially to growth.
The continued expansion of the EV driveline market hinges on several factors. Technological advancements, especially in battery technology and power electronics, will continue to drive down costs and improve efficiency. Government regulations aimed at reducing carbon emissions are creating a favorable regulatory environment for EVs, further stimulating market demand. However, challenges remain, such as the need for robust charging infrastructure, the high initial cost of EVs compared to internal combustion engine vehicles, and concerns about battery lifespan and sustainability. Despite these challenges, the long-term outlook for the EV driveline market remains positive, with continuous innovation and increasing consumer adoption expected to propel significant growth over the forecast period. The competitive landscape will likely witness further consolidation as companies strive to secure market share and develop cutting-edge drivetrain technologies.
Electric Vehicle Driveline Industry: A Comprehensive Market Report (2019-2033)
This comprehensive report provides an in-depth analysis of the Electric Vehicle (EV) Driveline industry, offering valuable insights for stakeholders across the value chain. The study covers the period from 2019 to 2033, with 2025 serving as the base and estimated year. The report meticulously analyzes market dynamics, competitive landscapes, technological advancements, and future growth potential, providing actionable intelligence for informed decision-making. The global EV Driveline market is projected to reach xx Million by 2033, exhibiting a Compound Annual Growth Rate (CAGR) of xx% during the forecast period (2025-2033).
Electric Vehicle Driveline Industry Market Structure & Competitive Dynamics
The EV driveline market exhibits a moderately consolidated structure, with several major players holding significant market share. Key competitors include ZF Friedrichshafen AG, GKN Driveline (Melrose Industries PLC), Continental AG, BorgWarner Inc, Robert Bosch GmbH, Delphi Technologies, Valeo Inc, DENSO Corporation, and Schaeffler Technologies AG & Co KG. These companies compete based on technological innovation, manufacturing capabilities, and strategic partnerships.
Market concentration is assessed through metrics such as the Herfindahl-Hirschman Index (HHI) and market share analysis for each segment. The report analyzes the impact of mergers and acquisitions (M&A) activities, with a focus on deal values and their influence on market dynamics. For example, the xx Million acquisition of X company by Y company in 2022 significantly altered the competitive landscape in the [specific segment] segment. Innovation ecosystems are thriving, driven by collaborations between OEMs, Tier-1 suppliers, and technology startups, fostering rapid advancements in electric motor technology, power electronics, and transmission systems. Stringent regulatory frameworks, focused on emission reduction targets and fuel efficiency standards, are accelerating the adoption of EV drivelines. The report considers the impact of substitutes such as alternative propulsion systems and analyzes end-user trends concerning vehicle preferences, driving range requirements, and charging infrastructure accessibility.
Electric Vehicle Driveline Industry Industry Trends & Insights
The global EV driveline market is experiencing robust growth, fueled by the increasing demand for electric and hybrid vehicles. Several factors contribute to this expansion: the rising awareness of environmental concerns and stricter emission regulations, government incentives and subsidies promoting EV adoption, technological advancements leading to improved battery performance and reduced costs, and evolving consumer preferences towards sustainable transportation options. The market's CAGR of xx% reflects the rapid adoption of electric vehicles across various segments. This growth is not uniform across all regions and vehicle types, with specific segments exhibiting higher penetration rates due to favorable market conditions, infrastructure development, and government support. The report details the market penetration of different driveline architectures (Series, Parallel, Power Split) across different vehicle types (Hybrid Vehicles, Plug-in Hybrid Vehicles, Battery Electric Vehicles). The growing adoption of battery electric vehicles (BEVs) is a major driver, pushing the demand for high-performance and efficient drivelines. Technological disruptions, such as the advancement of silicon carbide (SiC) power electronics and the development of high-efficiency electric motors, are further accelerating market growth. Competitive dynamics are intense, with established players and new entrants vying for market share through product innovation, strategic partnerships, and aggressive pricing strategies.
Dominant Markets & Segments in Electric Vehicle Driveline Industry
The report identifies [Specific Region/Country] as the dominant market for EV drivelines, driven by strong government support, robust EV adoption rates, and a well-established charging infrastructure.
Key Drivers:
- Favorable government policies and incentives.
- Rapid expansion of charging infrastructure.
- Growing consumer demand for electric vehicles.
- Increasing investments in R&D and manufacturing capabilities.
Dominant Segments:
- Architecture Type: Power split architectures are gaining traction due to their efficiency in hybrid and plug-in hybrid electric vehicles (PHEVs).
- Transmission Type: Dual-clutch transmissions (DCTs) are prevalent in performance-oriented EVs, while automatic transmissions are common in mass-market vehicles. Electric-continuously variable transmissions (eCVTs) offer advantages in efficiency but currently hold a smaller market share.
- Motor Type: The 100-250 kW motor segment is currently the largest, catering to the majority of EV applications. The >250 kW segment shows significant growth potential with the adoption of high-performance EVs.
- Vehicle Type: Battery Electric Vehicles (BEVs) are experiencing the fastest growth, followed by Plug-in Hybrid Electric Vehicles (PHEVs).
- Drive Type: Front-wheel drive (FWD) currently dominates the market due to cost-effectiveness, but all-wheel-drive (AWD) systems are gaining popularity in higher-performance EVs.
The report provides a detailed analysis of the market size and growth projections for each segment, along with a discussion of the competitive dynamics within each segment.
Electric Vehicle Driveline Industry Product Innovations
Recent innovations in EV drivelines include the development of highly integrated drivetrain modules, incorporating electric motors, power electronics, and gearboxes into a single compact unit. This approach improves efficiency, reduces weight, and simplifies manufacturing. Advances in motor technology, such as the use of permanent magnet synchronous motors (PMSMs) and switched reluctance motors (SRMs), offer improvements in power density and efficiency. Furthermore, the integration of advanced control algorithms and software improves the overall performance and fuel economy of the EV drivetrain. These innovations directly address market needs for improved range, performance, and affordability, driving market adoption.
Report Segmentation & Scope
This report segments the EV driveline market based on architecture type (series, parallel, power split), transmission type (automatic, dual-clutch, eCVT), motor type (45-100 kW, 100-250 kW, >250 kW), vehicle type (hybrid, plug-in hybrid, battery electric), and drive type (FWD, RWD, AWD). Each segment's market size, growth projections, and competitive landscape are analyzed in detail. The report provides forecasts for each segment from 2025 to 2033, offering a granular view of future market trends.
Key Drivers of Electric Vehicle Driveline Industry Growth
The growth of the EV driveline industry is driven by several factors, including stringent government regulations aimed at reducing carbon emissions, the increasing availability of cost-effective battery technologies, and advancements in electric motor technology resulting in improved efficiency and performance. Furthermore, consumer preference for eco-friendly vehicles and the expansion of charging infrastructure are contributing to the market's rapid expansion. Government incentives and subsidies for EV adoption further stimulate industry growth.
Challenges in the Electric Vehicle Driveline Industry Sector
The EV driveline industry faces challenges including the high upfront cost of EV drivelines compared to internal combustion engine (ICE) counterparts, the potential for supply chain disruptions affecting the availability of raw materials and components, and the complexity of managing the thermal management systems of high-power electric motors. Furthermore, the need to constantly innovate and upgrade technology to meet evolving consumer demands presents an ongoing challenge.
Leading Players in the Electric Vehicle Driveline Industry Market
- ZF Friedrichshafen AG
- GKN Driveline (Melrose Industries PLC)
- Continental AG
- BorgWarner Inc
- Robert Bosch GmbH
- Delphi Technologies
- Valeo Inc
- DENSO Corporation
- Schaeffler Technologies AG & Co KG
Key Developments in Electric Vehicle Driveline Industry Sector
- 2022 Q4: ZF Friedrichshafen AG launched a new generation of electric axle drives with improved power density and efficiency.
- 2023 Q1: Continental AG announced a strategic partnership with a battery manufacturer to secure the supply of crucial components.
- 2023 Q2: BorgWarner Inc. acquired a startup specializing in high-power electric motor technology. (Further developments can be added here as they occur)
Strategic Electric Vehicle Driveline Industry Market Outlook
The future of the EV driveline industry is bright, with significant growth potential driven by the continued expansion of the EV market, ongoing technological advancements, and increasing government support for sustainable transportation. Strategic opportunities exist for companies focused on developing innovative driveline technologies, improving supply chain resilience, and expanding into new geographic markets. The industry will see a further increase in the integration of advanced features such as intelligent power management systems and advanced driver-assistance systems (ADAS) into EV drivelines.
Electric Vehicle Driveline Industry Segmentation
-
1. Architecture Type
- 1.1. Series
- 1.2. Parallel
- 1.3. Power Split
-
2. Transmission Type
- 2.1. Automatic Transmission
- 2.2. Dual-clutch Transmission
- 2.3. Electric-continuously Variable Transmission
-
3. Motor Type
- 3.1. 45-100 kW
- 3.2. 100-250 kW
- 3.3. >250 kW
-
4. Vehicle Type
- 4.1. Hybrid Vehicles
- 4.2. Plug-in Hybrid Vehicles
- 4.3. Battery Electric Vehicles
-
5. Drive Type
- 5.1. Front Wheel Drive (FWD)
- 5.2. Rear Wheel Drive (RWD)
- 5.3. All Wheel Drive (AWD)
Electric Vehicle Driveline Industry Segmentation By Geography
-
1. North America
- 1.1. United States
- 1.2. Canada
- 1.3. Mexico
- 1.4. Rest of North America
-
2. Europe
- 2.1. United Kingdom
- 2.2. France
- 2.3. Germany
- 2.4. Rest of Europe
-
3. Asia Pacific
- 3.1. China
- 3.2. India
- 3.3. Japan
- 3.4. Rest of Asia Pacific
-
4. Rest of the World
- 4.1. Brazil
- 4.2. South Africa
- 4.3. Other Countries
Electric Vehicle Driveline Industry REPORT HIGHLIGHTS
| Aspects | Details |
|---|---|
| Study Period | 2019-2033 |
| Base Year | 2024 |
| Estimated Year | 2025 |
| Forecast Period | 2025-2033 |
| Historical Period | 2019-2024 |
| Growth Rate | CAGR of > 8.80% from 2019-2033 |
| Segmentation |
|
Table of Contents
- 1. Introduction
- 1.1. Research Scope
- 1.2. Market Segmentation
- 1.3. Research Methodology
- 1.4. Definitions and Assumptions
- 2. Executive Summary
- 2.1. Introduction
- 3. Market Dynamics
- 3.1. Introduction
- 3.2. Market Drivers
- 3.2.1. Increasing Electrification of Vehicles
- 3.3. Market Restrains
- 3.3.1. Precise Testing and Validation
- 3.4. Market Trends
- 3.4.1. Driving Demand from Automatic Vehicle Driveline Systems
- 4. Market Factor Analysis
- 4.1. Porters Five Forces
- 4.2. Supply/Value Chain
- 4.3. PESTEL analysis
- 4.4. Market Entropy
- 4.5. Patent/Trademark Analysis
- 5. Global Electric Vehicle Driveline Industry Analysis, Insights and Forecast, 2019-2031
- 5.1. Market Analysis, Insights and Forecast - by Architecture Type
- 5.1.1. Series
- 5.1.2. Parallel
- 5.1.3. Power Split
- 5.2. Market Analysis, Insights and Forecast - by Transmission Type
- 5.2.1. Automatic Transmission
- 5.2.2. Dual-clutch Transmission
- 5.2.3. Electric-continuously Variable Transmission
- 5.3. Market Analysis, Insights and Forecast - by Motor Type
- 5.3.1. 45-100 kW
- 5.3.2. 100-250 kW
- 5.3.3. >250 kW
- 5.4. Market Analysis, Insights and Forecast - by Vehicle Type
- 5.4.1. Hybrid Vehicles
- 5.4.2. Plug-in Hybrid Vehicles
- 5.4.3. Battery Electric Vehicles
- 5.5. Market Analysis, Insights and Forecast - by Drive Type
- 5.5.1. Front Wheel Drive (FWD)
- 5.5.2. Rear Wheel Drive (RWD)
- 5.5.3. All Wheel Drive (AWD)
- 5.6. Market Analysis, Insights and Forecast - by Region
- 5.6.1. North America
- 5.6.2. Europe
- 5.6.3. Asia Pacific
- 5.6.4. Rest of the World
- 5.1. Market Analysis, Insights and Forecast - by Architecture Type
- 6. North America Electric Vehicle Driveline Industry Analysis, Insights and Forecast, 2019-2031
- 6.1. Market Analysis, Insights and Forecast - by Architecture Type
- 6.1.1. Series
- 6.1.2. Parallel
- 6.1.3. Power Split
- 6.2. Market Analysis, Insights and Forecast - by Transmission Type
- 6.2.1. Automatic Transmission
- 6.2.2. Dual-clutch Transmission
- 6.2.3. Electric-continuously Variable Transmission
- 6.3. Market Analysis, Insights and Forecast - by Motor Type
- 6.3.1. 45-100 kW
- 6.3.2. 100-250 kW
- 6.3.3. >250 kW
- 6.4. Market Analysis, Insights and Forecast - by Vehicle Type
- 6.4.1. Hybrid Vehicles
- 6.4.2. Plug-in Hybrid Vehicles
- 6.4.3. Battery Electric Vehicles
- 6.5. Market Analysis, Insights and Forecast - by Drive Type
- 6.5.1. Front Wheel Drive (FWD)
- 6.5.2. Rear Wheel Drive (RWD)
- 6.5.3. All Wheel Drive (AWD)
- 6.1. Market Analysis, Insights and Forecast - by Architecture Type
- 7. Europe Electric Vehicle Driveline Industry Analysis, Insights and Forecast, 2019-2031
- 7.1. Market Analysis, Insights and Forecast - by Architecture Type
- 7.1.1. Series
- 7.1.2. Parallel
- 7.1.3. Power Split
- 7.2. Market Analysis, Insights and Forecast - by Transmission Type
- 7.2.1. Automatic Transmission
- 7.2.2. Dual-clutch Transmission
- 7.2.3. Electric-continuously Variable Transmission
- 7.3. Market Analysis, Insights and Forecast - by Motor Type
- 7.3.1. 45-100 kW
- 7.3.2. 100-250 kW
- 7.3.3. >250 kW
- 7.4. Market Analysis, Insights and Forecast - by Vehicle Type
- 7.4.1. Hybrid Vehicles
- 7.4.2. Plug-in Hybrid Vehicles
- 7.4.3. Battery Electric Vehicles
- 7.5. Market Analysis, Insights and Forecast - by Drive Type
- 7.5.1. Front Wheel Drive (FWD)
- 7.5.2. Rear Wheel Drive (RWD)
- 7.5.3. All Wheel Drive (AWD)
- 7.1. Market Analysis, Insights and Forecast - by Architecture Type
- 8. Asia Pacific Electric Vehicle Driveline Industry Analysis, Insights and Forecast, 2019-2031
- 8.1. Market Analysis, Insights and Forecast - by Architecture Type
- 8.1.1. Series
- 8.1.2. Parallel
- 8.1.3. Power Split
- 8.2. Market Analysis, Insights and Forecast - by Transmission Type
- 8.2.1. Automatic Transmission
- 8.2.2. Dual-clutch Transmission
- 8.2.3. Electric-continuously Variable Transmission
- 8.3. Market Analysis, Insights and Forecast - by Motor Type
- 8.3.1. 45-100 kW
- 8.3.2. 100-250 kW
- 8.3.3. >250 kW
- 8.4. Market Analysis, Insights and Forecast - by Vehicle Type
- 8.4.1. Hybrid Vehicles
- 8.4.2. Plug-in Hybrid Vehicles
- 8.4.3. Battery Electric Vehicles
- 8.5. Market Analysis, Insights and Forecast - by Drive Type
- 8.5.1. Front Wheel Drive (FWD)
- 8.5.2. Rear Wheel Drive (RWD)
- 8.5.3. All Wheel Drive (AWD)
- 8.1. Market Analysis, Insights and Forecast - by Architecture Type
- 9. Rest of the World Electric Vehicle Driveline Industry Analysis, Insights and Forecast, 2019-2031
- 9.1. Market Analysis, Insights and Forecast - by Architecture Type
- 9.1.1. Series
- 9.1.2. Parallel
- 9.1.3. Power Split
- 9.2. Market Analysis, Insights and Forecast - by Transmission Type
- 9.2.1. Automatic Transmission
- 9.2.2. Dual-clutch Transmission
- 9.2.3. Electric-continuously Variable Transmission
- 9.3. Market Analysis, Insights and Forecast - by Motor Type
- 9.3.1. 45-100 kW
- 9.3.2. 100-250 kW
- 9.3.3. >250 kW
- 9.4. Market Analysis, Insights and Forecast - by Vehicle Type
- 9.4.1. Hybrid Vehicles
- 9.4.2. Plug-in Hybrid Vehicles
- 9.4.3. Battery Electric Vehicles
- 9.5. Market Analysis, Insights and Forecast - by Drive Type
- 9.5.1. Front Wheel Drive (FWD)
- 9.5.2. Rear Wheel Drive (RWD)
- 9.5.3. All Wheel Drive (AWD)
- 9.1. Market Analysis, Insights and Forecast - by Architecture Type
- 10. North America Electric Vehicle Driveline Industry Analysis, Insights and Forecast, 2019-2031
- 10.1. Market Analysis, Insights and Forecast - By Country/Sub-region
- 10.1.1 United States
- 10.1.2 Canada
- 10.1.3 Mexico
- 10.1.4 Rest of North America
- 11. Europe Electric Vehicle Driveline Industry Analysis, Insights and Forecast, 2019-2031
- 11.1. Market Analysis, Insights and Forecast - By Country/Sub-region
- 11.1.1 United Kingdom
- 11.1.2 France
- 11.1.3 Germany
- 11.1.4 Rest of Europe
- 12. Asia Pacific Electric Vehicle Driveline Industry Analysis, Insights and Forecast, 2019-2031
- 12.1. Market Analysis, Insights and Forecast - By Country/Sub-region
- 12.1.1 China
- 12.1.2 India
- 12.1.3 Japan
- 12.1.4 Rest of Asia Pacific
- 13. Rest of the World Electric Vehicle Driveline Industry Analysis, Insights and Forecast, 2019-2031
- 13.1. Market Analysis, Insights and Forecast - By Country/Sub-region
- 13.1.1 Brazil
- 13.1.2 South Africa
- 13.1.3 Other Countries
- 14. Competitive Analysis
- 14.1. Global Market Share Analysis 2024
- 14.2. Company Profiles
- 14.2.1 ZF Friedrichshafen A
- 14.2.1.1. Overview
- 14.2.1.2. Products
- 14.2.1.3. SWOT Analysis
- 14.2.1.4. Recent Developments
- 14.2.1.5. Financials (Based on Availability)
- 14.2.2 GKN Driveline (Melrose Industries PLC)
- 14.2.2.1. Overview
- 14.2.2.2. Products
- 14.2.2.3. SWOT Analysis
- 14.2.2.4. Recent Developments
- 14.2.2.5. Financials (Based on Availability)
- 14.2.3 Continental AG
- 14.2.3.1. Overview
- 14.2.3.2. Products
- 14.2.3.3. SWOT Analysis
- 14.2.3.4. Recent Developments
- 14.2.3.5. Financials (Based on Availability)
- 14.2.4 BorgWarner Inc
- 14.2.4.1. Overview
- 14.2.4.2. Products
- 14.2.4.3. SWOT Analysis
- 14.2.4.4. Recent Developments
- 14.2.4.5. Financials (Based on Availability)
- 14.2.5 Robert Bosch GmbH
- 14.2.5.1. Overview
- 14.2.5.2. Products
- 14.2.5.3. SWOT Analysis
- 14.2.5.4. Recent Developments
- 14.2.5.5. Financials (Based on Availability)
- 14.2.6 Delphi Technologies
- 14.2.6.1. Overview
- 14.2.6.2. Products
- 14.2.6.3. SWOT Analysis
- 14.2.6.4. Recent Developments
- 14.2.6.5. Financials (Based on Availability)
- 14.2.7 Valeo Inc
- 14.2.7.1. Overview
- 14.2.7.2. Products
- 14.2.7.3. SWOT Analysis
- 14.2.7.4. Recent Developments
- 14.2.7.5. Financials (Based on Availability)
- 14.2.8 DENSO Corporation
- 14.2.8.1. Overview
- 14.2.8.2. Products
- 14.2.8.3. SWOT Analysis
- 14.2.8.4. Recent Developments
- 14.2.8.5. Financials (Based on Availability)
- 14.2.9 Schaeffler Technologies AG & Co KG
- 14.2.9.1. Overview
- 14.2.9.2. Products
- 14.2.9.3. SWOT Analysis
- 14.2.9.4. Recent Developments
- 14.2.9.5. Financials (Based on Availability)
- 14.2.1 ZF Friedrichshafen A
List of Figures
- Figure 1: Global Electric Vehicle Driveline Industry Revenue Breakdown (Million, %) by Region 2024 & 2032
- Figure 2: North America Electric Vehicle Driveline Industry Revenue (Million), by Country 2024 & 2032
- Figure 3: North America Electric Vehicle Driveline Industry Revenue Share (%), by Country 2024 & 2032
- Figure 4: Europe Electric Vehicle Driveline Industry Revenue (Million), by Country 2024 & 2032
- Figure 5: Europe Electric Vehicle Driveline Industry Revenue Share (%), by Country 2024 & 2032
- Figure 6: Asia Pacific Electric Vehicle Driveline Industry Revenue (Million), by Country 2024 & 2032
- Figure 7: Asia Pacific Electric Vehicle Driveline Industry Revenue Share (%), by Country 2024 & 2032
- Figure 8: Rest of the World Electric Vehicle Driveline Industry Revenue (Million), by Country 2024 & 2032
- Figure 9: Rest of the World Electric Vehicle Driveline Industry Revenue Share (%), by Country 2024 & 2032
- Figure 10: North America Electric Vehicle Driveline Industry Revenue (Million), by Architecture Type 2024 & 2032
- Figure 11: North America Electric Vehicle Driveline Industry Revenue Share (%), by Architecture Type 2024 & 2032
- Figure 12: North America Electric Vehicle Driveline Industry Revenue (Million), by Transmission Type 2024 & 2032
- Figure 13: North America Electric Vehicle Driveline Industry Revenue Share (%), by Transmission Type 2024 & 2032
- Figure 14: North America Electric Vehicle Driveline Industry Revenue (Million), by Motor Type 2024 & 2032
- Figure 15: North America Electric Vehicle Driveline Industry Revenue Share (%), by Motor Type 2024 & 2032
- Figure 16: North America Electric Vehicle Driveline Industry Revenue (Million), by Vehicle Type 2024 & 2032
- Figure 17: North America Electric Vehicle Driveline Industry Revenue Share (%), by Vehicle Type 2024 & 2032
- Figure 18: North America Electric Vehicle Driveline Industry Revenue (Million), by Drive Type 2024 & 2032
- Figure 19: North America Electric Vehicle Driveline Industry Revenue Share (%), by Drive Type 2024 & 2032
- Figure 20: North America Electric Vehicle Driveline Industry Revenue (Million), by Country 2024 & 2032
- Figure 21: North America Electric Vehicle Driveline Industry Revenue Share (%), by Country 2024 & 2032
- Figure 22: Europe Electric Vehicle Driveline Industry Revenue (Million), by Architecture Type 2024 & 2032
- Figure 23: Europe Electric Vehicle Driveline Industry Revenue Share (%), by Architecture Type 2024 & 2032
- Figure 24: Europe Electric Vehicle Driveline Industry Revenue (Million), by Transmission Type 2024 & 2032
- Figure 25: Europe Electric Vehicle Driveline Industry Revenue Share (%), by Transmission Type 2024 & 2032
- Figure 26: Europe Electric Vehicle Driveline Industry Revenue (Million), by Motor Type 2024 & 2032
- Figure 27: Europe Electric Vehicle Driveline Industry Revenue Share (%), by Motor Type 2024 & 2032
- Figure 28: Europe Electric Vehicle Driveline Industry Revenue (Million), by Vehicle Type 2024 & 2032
- Figure 29: Europe Electric Vehicle Driveline Industry Revenue Share (%), by Vehicle Type 2024 & 2032
- Figure 30: Europe Electric Vehicle Driveline Industry Revenue (Million), by Drive Type 2024 & 2032
- Figure 31: Europe Electric Vehicle Driveline Industry Revenue Share (%), by Drive Type 2024 & 2032
- Figure 32: Europe Electric Vehicle Driveline Industry Revenue (Million), by Country 2024 & 2032
- Figure 33: Europe Electric Vehicle Driveline Industry Revenue Share (%), by Country 2024 & 2032
- Figure 34: Asia Pacific Electric Vehicle Driveline Industry Revenue (Million), by Architecture Type 2024 & 2032
- Figure 35: Asia Pacific Electric Vehicle Driveline Industry Revenue Share (%), by Architecture Type 2024 & 2032
- Figure 36: Asia Pacific Electric Vehicle Driveline Industry Revenue (Million), by Transmission Type 2024 & 2032
- Figure 37: Asia Pacific Electric Vehicle Driveline Industry Revenue Share (%), by Transmission Type 2024 & 2032
- Figure 38: Asia Pacific Electric Vehicle Driveline Industry Revenue (Million), by Motor Type 2024 & 2032
- Figure 39: Asia Pacific Electric Vehicle Driveline Industry Revenue Share (%), by Motor Type 2024 & 2032
- Figure 40: Asia Pacific Electric Vehicle Driveline Industry Revenue (Million), by Vehicle Type 2024 & 2032
- Figure 41: Asia Pacific Electric Vehicle Driveline Industry Revenue Share (%), by Vehicle Type 2024 & 2032
- Figure 42: Asia Pacific Electric Vehicle Driveline Industry Revenue (Million), by Drive Type 2024 & 2032
- Figure 43: Asia Pacific Electric Vehicle Driveline Industry Revenue Share (%), by Drive Type 2024 & 2032
- Figure 44: Asia Pacific Electric Vehicle Driveline Industry Revenue (Million), by Country 2024 & 2032
- Figure 45: Asia Pacific Electric Vehicle Driveline Industry Revenue Share (%), by Country 2024 & 2032
- Figure 46: Rest of the World Electric Vehicle Driveline Industry Revenue (Million), by Architecture Type 2024 & 2032
- Figure 47: Rest of the World Electric Vehicle Driveline Industry Revenue Share (%), by Architecture Type 2024 & 2032
- Figure 48: Rest of the World Electric Vehicle Driveline Industry Revenue (Million), by Transmission Type 2024 & 2032
- Figure 49: Rest of the World Electric Vehicle Driveline Industry Revenue Share (%), by Transmission Type 2024 & 2032
- Figure 50: Rest of the World Electric Vehicle Driveline Industry Revenue (Million), by Motor Type 2024 & 2032
- Figure 51: Rest of the World Electric Vehicle Driveline Industry Revenue Share (%), by Motor Type 2024 & 2032
- Figure 52: Rest of the World Electric Vehicle Driveline Industry Revenue (Million), by Vehicle Type 2024 & 2032
- Figure 53: Rest of the World Electric Vehicle Driveline Industry Revenue Share (%), by Vehicle Type 2024 & 2032
- Figure 54: Rest of the World Electric Vehicle Driveline Industry Revenue (Million), by Drive Type 2024 & 2032
- Figure 55: Rest of the World Electric Vehicle Driveline Industry Revenue Share (%), by Drive Type 2024 & 2032
- Figure 56: Rest of the World Electric Vehicle Driveline Industry Revenue (Million), by Country 2024 & 2032
- Figure 57: Rest of the World Electric Vehicle Driveline Industry Revenue Share (%), by Country 2024 & 2032
List of Tables
- Table 1: Global Electric Vehicle Driveline Industry Revenue Million Forecast, by Region 2019 & 2032
- Table 2: Global Electric Vehicle Driveline Industry Revenue Million Forecast, by Architecture Type 2019 & 2032
- Table 3: Global Electric Vehicle Driveline Industry Revenue Million Forecast, by Transmission Type 2019 & 2032
- Table 4: Global Electric Vehicle Driveline Industry Revenue Million Forecast, by Motor Type 2019 & 2032
- Table 5: Global Electric Vehicle Driveline Industry Revenue Million Forecast, by Vehicle Type 2019 & 2032
- Table 6: Global Electric Vehicle Driveline Industry Revenue Million Forecast, by Drive Type 2019 & 2032
- Table 7: Global Electric Vehicle Driveline Industry Revenue Million Forecast, by Region 2019 & 2032
- Table 8: Global Electric Vehicle Driveline Industry Revenue Million Forecast, by Country 2019 & 2032
- Table 9: United States Electric Vehicle Driveline Industry Revenue (Million) Forecast, by Application 2019 & 2032
- Table 10: Canada Electric Vehicle Driveline Industry Revenue (Million) Forecast, by Application 2019 & 2032
- Table 11: Mexico Electric Vehicle Driveline Industry Revenue (Million) Forecast, by Application 2019 & 2032
- Table 12: Rest of North America Electric Vehicle Driveline Industry Revenue (Million) Forecast, by Application 2019 & 2032
- Table 13: Global Electric Vehicle Driveline Industry Revenue Million Forecast, by Country 2019 & 2032
- Table 14: United Kingdom Electric Vehicle Driveline Industry Revenue (Million) Forecast, by Application 2019 & 2032
- Table 15: France Electric Vehicle Driveline Industry Revenue (Million) Forecast, by Application 2019 & 2032
- Table 16: Germany Electric Vehicle Driveline Industry Revenue (Million) Forecast, by Application 2019 & 2032
- Table 17: Rest of Europe Electric Vehicle Driveline Industry Revenue (Million) Forecast, by Application 2019 & 2032
- Table 18: Global Electric Vehicle Driveline Industry Revenue Million Forecast, by Country 2019 & 2032
- Table 19: China Electric Vehicle Driveline Industry Revenue (Million) Forecast, by Application 2019 & 2032
- Table 20: India Electric Vehicle Driveline Industry Revenue (Million) Forecast, by Application 2019 & 2032
- Table 21: Japan Electric Vehicle Driveline Industry Revenue (Million) Forecast, by Application 2019 & 2032
- Table 22: Rest of Asia Pacific Electric Vehicle Driveline Industry Revenue (Million) Forecast, by Application 2019 & 2032
- Table 23: Global Electric Vehicle Driveline Industry Revenue Million Forecast, by Country 2019 & 2032
- Table 24: Brazil Electric Vehicle Driveline Industry Revenue (Million) Forecast, by Application 2019 & 2032
- Table 25: South Africa Electric Vehicle Driveline Industry Revenue (Million) Forecast, by Application 2019 & 2032
- Table 26: Other Countries Electric Vehicle Driveline Industry Revenue (Million) Forecast, by Application 2019 & 2032
- Table 27: Global Electric Vehicle Driveline Industry Revenue Million Forecast, by Architecture Type 2019 & 2032
- Table 28: Global Electric Vehicle Driveline Industry Revenue Million Forecast, by Transmission Type 2019 & 2032
- Table 29: Global Electric Vehicle Driveline Industry Revenue Million Forecast, by Motor Type 2019 & 2032
- Table 30: Global Electric Vehicle Driveline Industry Revenue Million Forecast, by Vehicle Type 2019 & 2032
- Table 31: Global Electric Vehicle Driveline Industry Revenue Million Forecast, by Drive Type 2019 & 2032
- Table 32: Global Electric Vehicle Driveline Industry Revenue Million Forecast, by Country 2019 & 2032
- Table 33: United States Electric Vehicle Driveline Industry Revenue (Million) Forecast, by Application 2019 & 2032
- Table 34: Canada Electric Vehicle Driveline Industry Revenue (Million) Forecast, by Application 2019 & 2032
- Table 35: Mexico Electric Vehicle Driveline Industry Revenue (Million) Forecast, by Application 2019 & 2032
- Table 36: Rest of North America Electric Vehicle Driveline Industry Revenue (Million) Forecast, by Application 2019 & 2032
- Table 37: Global Electric Vehicle Driveline Industry Revenue Million Forecast, by Architecture Type 2019 & 2032
- Table 38: Global Electric Vehicle Driveline Industry Revenue Million Forecast, by Transmission Type 2019 & 2032
- Table 39: Global Electric Vehicle Driveline Industry Revenue Million Forecast, by Motor Type 2019 & 2032
- Table 40: Global Electric Vehicle Driveline Industry Revenue Million Forecast, by Vehicle Type 2019 & 2032
- Table 41: Global Electric Vehicle Driveline Industry Revenue Million Forecast, by Drive Type 2019 & 2032
- Table 42: Global Electric Vehicle Driveline Industry Revenue Million Forecast, by Country 2019 & 2032
- Table 43: United Kingdom Electric Vehicle Driveline Industry Revenue (Million) Forecast, by Application 2019 & 2032
- Table 44: France Electric Vehicle Driveline Industry Revenue (Million) Forecast, by Application 2019 & 2032
- Table 45: Germany Electric Vehicle Driveline Industry Revenue (Million) Forecast, by Application 2019 & 2032
- Table 46: Rest of Europe Electric Vehicle Driveline Industry Revenue (Million) Forecast, by Application 2019 & 2032
- Table 47: Global Electric Vehicle Driveline Industry Revenue Million Forecast, by Architecture Type 2019 & 2032
- Table 48: Global Electric Vehicle Driveline Industry Revenue Million Forecast, by Transmission Type 2019 & 2032
- Table 49: Global Electric Vehicle Driveline Industry Revenue Million Forecast, by Motor Type 2019 & 2032
- Table 50: Global Electric Vehicle Driveline Industry Revenue Million Forecast, by Vehicle Type 2019 & 2032
- Table 51: Global Electric Vehicle Driveline Industry Revenue Million Forecast, by Drive Type 2019 & 2032
- Table 52: Global Electric Vehicle Driveline Industry Revenue Million Forecast, by Country 2019 & 2032
- Table 53: China Electric Vehicle Driveline Industry Revenue (Million) Forecast, by Application 2019 & 2032
- Table 54: India Electric Vehicle Driveline Industry Revenue (Million) Forecast, by Application 2019 & 2032
- Table 55: Japan Electric Vehicle Driveline Industry Revenue (Million) Forecast, by Application 2019 & 2032
- Table 56: Rest of Asia Pacific Electric Vehicle Driveline Industry Revenue (Million) Forecast, by Application 2019 & 2032
- Table 57: Global Electric Vehicle Driveline Industry Revenue Million Forecast, by Architecture Type 2019 & 2032
- Table 58: Global Electric Vehicle Driveline Industry Revenue Million Forecast, by Transmission Type 2019 & 2032
- Table 59: Global Electric Vehicle Driveline Industry Revenue Million Forecast, by Motor Type 2019 & 2032
- Table 60: Global Electric Vehicle Driveline Industry Revenue Million Forecast, by Vehicle Type 2019 & 2032
- Table 61: Global Electric Vehicle Driveline Industry Revenue Million Forecast, by Drive Type 2019 & 2032
- Table 62: Global Electric Vehicle Driveline Industry Revenue Million Forecast, by Country 2019 & 2032
- Table 63: Brazil Electric Vehicle Driveline Industry Revenue (Million) Forecast, by Application 2019 & 2032
- Table 64: South Africa Electric Vehicle Driveline Industry Revenue (Million) Forecast, by Application 2019 & 2032
- Table 65: Other Countries Electric Vehicle Driveline Industry Revenue (Million) Forecast, by Application 2019 & 2032
Frequently Asked Questions
1. What is the projected Compound Annual Growth Rate (CAGR) of the Electric Vehicle Driveline Industry?
The projected CAGR is approximately > 8.80%.
2. Which companies are prominent players in the Electric Vehicle Driveline Industry?
Key companies in the market include ZF Friedrichshafen A, GKN Driveline (Melrose Industries PLC), Continental AG, BorgWarner Inc, Robert Bosch GmbH, Delphi Technologies, Valeo Inc, DENSO Corporation, Schaeffler Technologies AG & Co KG.
3. What are the main segments of the Electric Vehicle Driveline Industry?
The market segments include Architecture Type, Transmission Type, Motor Type, Vehicle Type, Drive Type.
4. Can you provide details about the market size?
The market size is estimated to be USD XX Million as of 2022.
5. What are some drivers contributing to market growth?
Increasing Electrification of Vehicles.
6. What are the notable trends driving market growth?
Driving Demand from Automatic Vehicle Driveline Systems.
7. Are there any restraints impacting market growth?
Precise Testing and Validation.
8. Can you provide examples of recent developments in the market?
N/A
9. What pricing options are available for accessing the report?
Pricing options include single-user, multi-user, and enterprise licenses priced at USD 4750, USD 5250, and USD 8750 respectively.
10. Is the market size provided in terms of value or volume?
The market size is provided in terms of value, measured in Million.
11. Are there any specific market keywords associated with the report?
Yes, the market keyword associated with the report is "Electric Vehicle Driveline Industry," which aids in identifying and referencing the specific market segment covered.
12. How do I determine which pricing option suits my needs best?
The pricing options vary based on user requirements and access needs. Individual users may opt for single-user licenses, while businesses requiring broader access may choose multi-user or enterprise licenses for cost-effective access to the report.
13. Are there any additional resources or data provided in the Electric Vehicle Driveline Industry report?
While the report offers comprehensive insights, it's advisable to review the specific contents or supplementary materials provided to ascertain if additional resources or data are available.
14. How can I stay updated on further developments or reports in the Electric Vehicle Driveline Industry?
To stay informed about further developments, trends, and reports in the Electric Vehicle Driveline Industry, consider subscribing to industry newsletters, following relevant companies and organizations, or regularly checking reputable industry news sources and publications.
Methodology
Step 1 - Identification of Relevant Samples Size from Population Database


Step 2 - Approaches for Defining Global Market Size (Value, Volume* & Price*)

Note*: In applicable scenarios
Step 3 - Data Sources
Primary Research
- Web Analytics
- Survey Reports
- Research Institute
- Latest Research Reports
- Opinion Leaders
Secondary Research
- Annual Reports
- White Paper
- Latest Press Release
- Industry Association
- Paid Database
- Investor Presentations

Step 4 - Data Triangulation
Involves using different sources of information in order to increase the validity of a study
These sources are likely to be stakeholders in a program - participants, other researchers, program staff, other community members, and so on.
Then we put all data in single framework & apply various statistical tools to find out the dynamic on the market.
During the analysis stage, feedback from the stakeholder groups would be compared to determine areas of agreement as well as areas of divergence


