
Key Insights
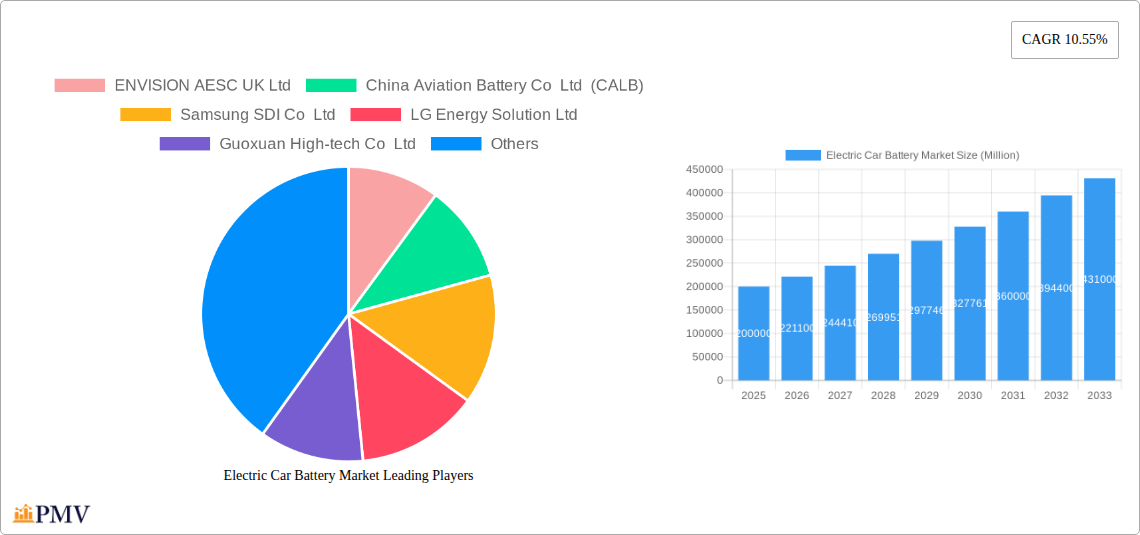
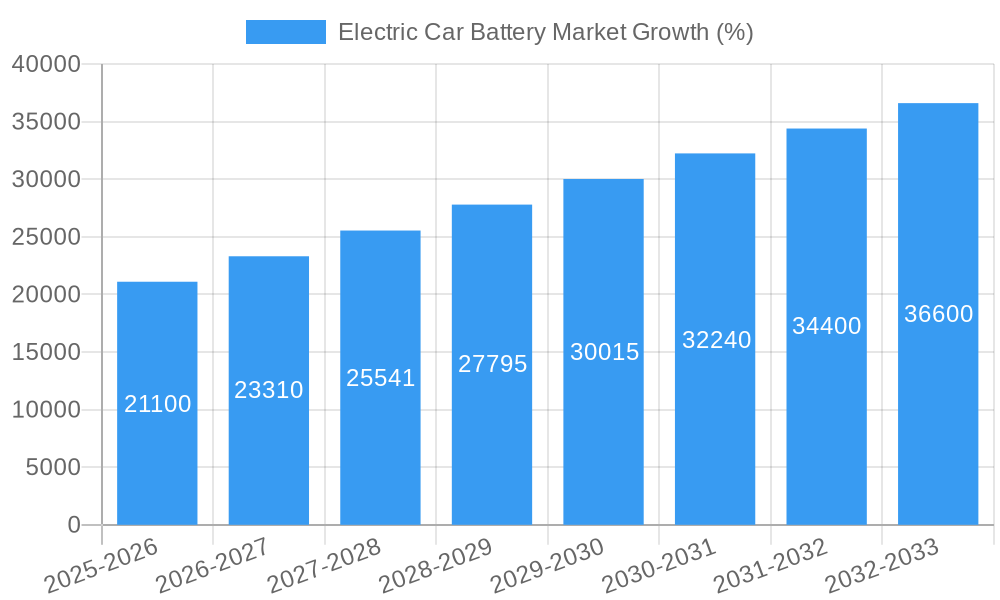
The electric car battery market is experiencing robust growth, driven by the global shift towards electric vehicles (EVs) to combat climate change and improve air quality. A compound annual growth rate (CAGR) of 10.55% from 2019 to 2033 indicates a significant expansion, transforming the automotive landscape. This growth is fueled by several factors: increasing government incentives and regulations promoting EV adoption, advancements in battery technology leading to higher energy density, longer lifespans, and reduced costs, and rising consumer demand for eco-friendly transportation options. The market segmentation reveals a diverse landscape with various battery chemistries (LFP, NCA, NCM, NMC), capacities (ranging from less than 15 kWh to over 80 kWh), form factors (cylindrical, pouch, prismatic), and manufacturing methods (laser, wire welding) catering to different EV types (passenger cars, buses, light commercial vehicles). Key players like CATL, LG Energy Solution, Panasonic, and BYD are leading the innovation and production, constantly striving for improved performance and cost efficiency.
The market's growth trajectory is further influenced by ongoing research and development in solid-state batteries, which promise even higher energy density and safety features. However, challenges remain, including the availability and cost of raw materials like lithium, cobalt, and nickel, as well as the need for enhanced battery recycling infrastructure to address environmental concerns. Geographical distribution shows strong demand from regions with established EV infrastructure and supportive policies, while emerging markets present significant future growth potential. The forecast period of 2025-2033 projects a continued expansion, driven by the aforementioned factors, with specific segments like high-capacity batteries for long-range EVs and advanced battery chemistries experiencing faster growth rates. The competitive landscape is characterized by intense innovation and consolidation, with established players and new entrants vying for market share.
Electric Car Battery Market: A Comprehensive Report (2019-2033)
This in-depth report provides a comprehensive analysis of the Electric Car Battery Market, encompassing market structure, competitive dynamics, industry trends, dominant segments, product innovations, and future outlooks. The study period covers 2019-2033, with 2025 as the base year and a forecast period of 2025-2033. This report is essential for industry stakeholders, investors, and researchers seeking actionable insights into this rapidly evolving market.
Electric Car Battery Market Market Structure & Competitive Dynamics
The global electric car battery market is characterized by a dynamic interplay of established players and emerging innovators. Market concentration is moderate, with a few dominant players holding significant market share, while numerous smaller companies compete in niche segments. The market's innovation ecosystem is vibrant, with ongoing R&D efforts focused on improving battery energy density, lifespan, safety, and cost-effectiveness. Stringent regulatory frameworks, particularly concerning environmental impact and safety standards, are shaping market dynamics. Product substitutes, such as fuel cells and alternative energy storage solutions, pose a moderate threat, while end-user preferences increasingly favor longer-range and faster-charging batteries. M&A activities have been significant, with deal values exceeding xx Million in the past five years, driven by strategic acquisitions aimed at securing supply chains and expanding technological capabilities. Key metrics include:
- Market Share: CATL holds approximately xx% market share, followed by BYD with xx%, LG Energy Solution with xx%, and Panasonic with xx%. Other significant players include Samsung SDI, SK Innovation, and SVOLT.
- M&A Deal Values: Significant deals in the past five years totaled over xx Million, demonstrating considerable consolidation within the sector. These deals primarily focused on securing raw materials, technology, and market access.
Electric Car Battery Market Industry Trends & Insights
The electric car battery market is experiencing robust growth, driven by the increasing adoption of electric vehicles (EVs) globally. The Compound Annual Growth Rate (CAGR) from 2025 to 2033 is projected to be xx%, fueled by supportive government policies, rising consumer awareness of environmental concerns, and advancements in battery technology. Technological disruptions, such as the development of solid-state batteries and improved battery management systems (BMS), are poised to further accelerate market growth. Consumer preferences are shifting towards higher energy density batteries with extended range and faster charging capabilities. Competitive dynamics are marked by intense competition among leading manufacturers, focusing on innovation, cost reduction, and supply chain optimization. Market penetration of EVs continues to rise, with a projected xx% penetration rate by 2033 in major markets.
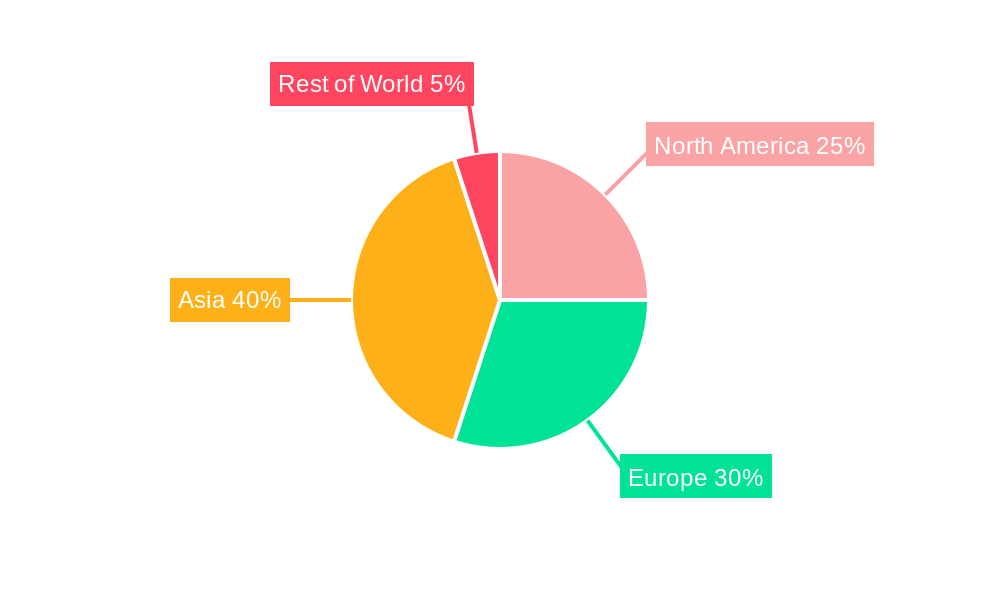
Dominant Markets & Segments in Electric Car Battery Market
The Asia-Pacific region, particularly China, currently dominates the electric car battery market, driven by robust EV adoption and a supportive government policy landscape. Key factors contributing to regional dominance include:
- Economic Policies: Generous subsidies and tax incentives for EV purchases.
- Infrastructure Development: Extensive charging infrastructure development.
- Technological Advancements: Significant investments in battery manufacturing and R&D.
Within specific segments, the following are prominent:
- Propulsion Type: BEVs (Battery Electric Vehicles) comprise the largest segment, accounting for over xx% of the market, driven by longer driving ranges compared to PHEVs (Plug-in Hybrid Electric Vehicles).
- Battery Chemistry: LFP (Lithium Iron Phosphate) batteries are gaining significant traction due to their cost-effectiveness and safety profile, surpassing NCM and NCA in market share.
- Capacity: The 40 kWh to 80 kWh capacity segment holds the largest market share, owing to its balance between range and cost.
- Battery Form: Prismatic batteries dominate the market due to their high energy density and suitability for various vehicle applications.
- Material Type: Lithium and Nickel are crucial components, reflecting the demand for high-energy density batteries.
- Body Type: Passenger cars remain the largest consumer segment, driving the majority of battery demand.
Electric Car Battery Market Product Innovations
Recent product innovations have focused on increasing energy density, improving safety features like Non Propagation (NP) technology and Cell-to-Pack (CTP) technology, and enhancing fast-charging capabilities. Solid-state batteries are also emerging as a promising technology with potential to disrupt the market. These advancements are aimed at extending the driving range of EVs and reducing charging times, aligning with growing consumer demands.
Report Segmentation & Scope
This report segments the electric car battery market based on propulsion type (BEV, PHEV), battery chemistry (LFP, NCA, NCM, NMC, Others), capacity (Less than 15 kWh, 15 kWh to 40 kWh, 40 kWh to 80 kWh, Above 80 kWh), battery form (Cylindrical, Pouch, Prismatic), manufacturing method (Laser, Wire), components (Anode, Cathode, Electrolyte, Separator), material type (Cobalt, Lithium, Manganese, Natural Graphite, Nickel, Other Materials), and body type (Bus, LCV, M&HDT, Passenger Car). Each segment's growth projections, market size, and competitive landscape are thoroughly analyzed. Market size estimations for 2025 are provided for each segment, with forecasts extending to 2033.
Key Drivers of Electric Car Battery Market Growth
The electric car battery market's growth is fueled by several factors, including:
- Government Regulations: Stringent emission standards and incentives for EV adoption.
- Technological Advancements: Continued improvements in battery technology, leading to higher energy density, longer lifespan, and faster charging.
- Rising Consumer Demand: Increasing consumer awareness of environmental concerns and preference for sustainable transportation.
Challenges in the Electric Car Battery Market Sector
The electric car battery market faces certain challenges, such as:
- Raw Material Supply Chain: Dependence on limited geographical sources for key raw materials like lithium and cobalt creates supply chain vulnerability and price volatility.
- High Production Costs: The manufacturing of high-performance batteries remains expensive, impacting the affordability of EVs.
- Battery Safety Concerns: Ensuring battery safety and preventing thermal runaway incidents is crucial for market stability and consumer confidence.
Leading Players in the Electric Car Battery Market Market
- ENVISION AESC UK Ltd
- China Aviation Battery Co Ltd (CALB)
- Samsung SDI Co Ltd
- LG Energy Solution Ltd
- Guoxuan High-tech Co Ltd
- Farasis Energy (Ganzhou) Co Ltd
- TOSHIBA Corp
- Primearth EV Energy Co Ltd
- Contemporary Amperex Technology Co Ltd (CATL)
- BYD Company Ltd
- SK Innovation Co Ltd
- EVE Energy Co Ltd
- Panasonic Holdings Corporation
- SVOLT Energy Technology Co Ltd (SVOLT)
Key Developments in Electric Car Battery Market Sector
- June 2023: CATL launched Qiji Energy, a battery swap solution for heavy-duty trucks, leveraging its 3rd-generation LFP battery chemistry and NP/CTP technologies.
- January 2023: CALB partnered with Forsee Power to integrate high energy density cells into battery systems.
- January 2023: Shinhan Securities and SK On signed an MOU for a secondary battery ecosystem investment alliance.
Strategic Electric Car Battery Market Market Outlook
The electric car battery market presents significant growth potential, driven by the continued expansion of the EV sector and ongoing technological advancements. Strategic opportunities lie in developing innovative battery technologies, optimizing supply chains, and expanding into new markets. Companies that can successfully navigate these challenges and capitalize on emerging trends are poised for significant growth in the coming years.
Electric Car Battery Market Segmentation
-
1. Body Type
- 1.1. Bus
- 1.2. LCV
- 1.3. M&HDT
- 1.4. Passenger Car
-
2. Propulsion Type
- 2.1. BEV
- 2.2. PHEV
-
3. Battery Chemistry
- 3.1. LFP
- 3.2. NCA
- 3.3. NCM
- 3.4. NMC
- 3.5. Others
-
4. Capacity
- 4.1. 15 kWh to 40 kWh
- 4.2. 40 kWh to 80 kWh
- 4.3. Above 80 kWh
- 4.4. Less than 15 kWh
-
5. Battery Form
- 5.1. Cylindrical
- 5.2. Pouch
- 5.3. Prismatic
-
6. Method
- 6.1. Laser
- 6.2. Wire
-
7. Component
- 7.1. Anode
- 7.2. Cathode
- 7.3. Electrolyte
- 7.4. Separator
-
8. Material Type
- 8.1. Cobalt
- 8.2. Lithium
- 8.3. Manganese
- 8.4. Natural Graphite
- 8.5. Nickel
- 8.6. Other Materials
Electric Car Battery Market Segmentation By Geography
-
1. North America
- 1.1. United States
- 1.2. Canada
- 1.3. Mexico
-
2. South America
- 2.1. Brazil
- 2.2. Argentina
- 2.3. Rest of South America
-
3. Europe
- 3.1. United Kingdom
- 3.2. Germany
- 3.3. France
- 3.4. Italy
- 3.5. Spain
- 3.6. Russia
- 3.7. Benelux
- 3.8. Nordics
- 3.9. Rest of Europe
-
4. Middle East & Africa
- 4.1. Turkey
- 4.2. Israel
- 4.3. GCC
- 4.4. North Africa
- 4.5. South Africa
- 4.6. Rest of Middle East & Africa
-
5. Asia Pacific
- 5.1. China
- 5.2. India
- 5.3. Japan
- 5.4. South Korea
- 5.5. ASEAN
- 5.6. Oceania
- 5.7. Rest of Asia Pacific
Electric Car Battery Market REPORT HIGHLIGHTS
| Aspects | Details |
|---|---|
| Study Period | 2019-2033 |
| Base Year | 2024 |
| Estimated Year | 2025 |
| Forecast Period | 2025-2033 |
| Historical Period | 2019-2024 |
| Growth Rate | CAGR of 10.55% from 2019-2033 |
| Segmentation |
|
Table of Contents
- 1. Introduction
- 1.1. Research Scope
- 1.2. Market Segmentation
- 1.3. Research Methodology
- 1.4. Definitions and Assumptions
- 2. Executive Summary
- 2.1. Introduction
- 3. Market Dynamics
- 3.1. Introduction
- 3.2. Market Drivers
- 3.2.1. Growing Travel and Tourism Industry is Driving the Car Rental Market
- 3.3. Market Restrains
- 3.3.1. Increasing Popularity of Ride-Sharing Services Pose Challenges for the Conventional Car Rental Market
- 3.4. Market Trends
- 3.4.1. OTHER KEY INDUSTRY TRENDS COVERED IN THE REPORT
- 4. Market Factor Analysis
- 4.1. Porters Five Forces
- 4.2. Supply/Value Chain
- 4.3. PESTEL analysis
- 4.4. Market Entropy
- 4.5. Patent/Trademark Analysis
- 5. Global Electric Car Battery Market Analysis, Insights and Forecast, 2019-2031
- 5.1. Market Analysis, Insights and Forecast - by Body Type
- 5.1.1. Bus
- 5.1.2. LCV
- 5.1.3. M&HDT
- 5.1.4. Passenger Car
- 5.2. Market Analysis, Insights and Forecast - by Propulsion Type
- 5.2.1. BEV
- 5.2.2. PHEV
- 5.3. Market Analysis, Insights and Forecast - by Battery Chemistry
- 5.3.1. LFP
- 5.3.2. NCA
- 5.3.3. NCM
- 5.3.4. NMC
- 5.3.5. Others
- 5.4. Market Analysis, Insights and Forecast - by Capacity
- 5.4.1. 15 kWh to 40 kWh
- 5.4.2. 40 kWh to 80 kWh
- 5.4.3. Above 80 kWh
- 5.4.4. Less than 15 kWh
- 5.5. Market Analysis, Insights and Forecast - by Battery Form
- 5.5.1. Cylindrical
- 5.5.2. Pouch
- 5.5.3. Prismatic
- 5.6. Market Analysis, Insights and Forecast - by Method
- 5.6.1. Laser
- 5.6.2. Wire
- 5.7. Market Analysis, Insights and Forecast - by Component
- 5.7.1. Anode
- 5.7.2. Cathode
- 5.7.3. Electrolyte
- 5.7.4. Separator
- 5.8. Market Analysis, Insights and Forecast - by Material Type
- 5.8.1. Cobalt
- 5.8.2. Lithium
- 5.8.3. Manganese
- 5.8.4. Natural Graphite
- 5.8.5. Nickel
- 5.8.6. Other Materials
- 5.9. Market Analysis, Insights and Forecast - by Region
- 5.9.1. North America
- 5.9.2. South America
- 5.9.3. Europe
- 5.9.4. Middle East & Africa
- 5.9.5. Asia Pacific
- 5.1. Market Analysis, Insights and Forecast - by Body Type
- 6. North America Electric Car Battery Market Analysis, Insights and Forecast, 2019-2031
- 6.1. Market Analysis, Insights and Forecast - by Body Type
- 6.1.1. Bus
- 6.1.2. LCV
- 6.1.3. M&HDT
- 6.1.4. Passenger Car
- 6.2. Market Analysis, Insights and Forecast - by Propulsion Type
- 6.2.1. BEV
- 6.2.2. PHEV
- 6.3. Market Analysis, Insights and Forecast - by Battery Chemistry
- 6.3.1. LFP
- 6.3.2. NCA
- 6.3.3. NCM
- 6.3.4. NMC
- 6.3.5. Others
- 6.4. Market Analysis, Insights and Forecast - by Capacity
- 6.4.1. 15 kWh to 40 kWh
- 6.4.2. 40 kWh to 80 kWh
- 6.4.3. Above 80 kWh
- 6.4.4. Less than 15 kWh
- 6.5. Market Analysis, Insights and Forecast - by Battery Form
- 6.5.1. Cylindrical
- 6.5.2. Pouch
- 6.5.3. Prismatic
- 6.6. Market Analysis, Insights and Forecast - by Method
- 6.6.1. Laser
- 6.6.2. Wire
- 6.7. Market Analysis, Insights and Forecast - by Component
- 6.7.1. Anode
- 6.7.2. Cathode
- 6.7.3. Electrolyte
- 6.7.4. Separator
- 6.8. Market Analysis, Insights and Forecast - by Material Type
- 6.8.1. Cobalt
- 6.8.2. Lithium
- 6.8.3. Manganese
- 6.8.4. Natural Graphite
- 6.8.5. Nickel
- 6.8.6. Other Materials
- 6.1. Market Analysis, Insights and Forecast - by Body Type
- 7. South America Electric Car Battery Market Analysis, Insights and Forecast, 2019-2031
- 7.1. Market Analysis, Insights and Forecast - by Body Type
- 7.1.1. Bus
- 7.1.2. LCV
- 7.1.3. M&HDT
- 7.1.4. Passenger Car
- 7.2. Market Analysis, Insights and Forecast - by Propulsion Type
- 7.2.1. BEV
- 7.2.2. PHEV
- 7.3. Market Analysis, Insights and Forecast - by Battery Chemistry
- 7.3.1. LFP
- 7.3.2. NCA
- 7.3.3. NCM
- 7.3.4. NMC
- 7.3.5. Others
- 7.4. Market Analysis, Insights and Forecast - by Capacity
- 7.4.1. 15 kWh to 40 kWh
- 7.4.2. 40 kWh to 80 kWh
- 7.4.3. Above 80 kWh
- 7.4.4. Less than 15 kWh
- 7.5. Market Analysis, Insights and Forecast - by Battery Form
- 7.5.1. Cylindrical
- 7.5.2. Pouch
- 7.5.3. Prismatic
- 7.6. Market Analysis, Insights and Forecast - by Method
- 7.6.1. Laser
- 7.6.2. Wire
- 7.7. Market Analysis, Insights and Forecast - by Component
- 7.7.1. Anode
- 7.7.2. Cathode
- 7.7.3. Electrolyte
- 7.7.4. Separator
- 7.8. Market Analysis, Insights and Forecast - by Material Type
- 7.8.1. Cobalt
- 7.8.2. Lithium
- 7.8.3. Manganese
- 7.8.4. Natural Graphite
- 7.8.5. Nickel
- 7.8.6. Other Materials
- 7.1. Market Analysis, Insights and Forecast - by Body Type
- 8. Europe Electric Car Battery Market Analysis, Insights and Forecast, 2019-2031
- 8.1. Market Analysis, Insights and Forecast - by Body Type
- 8.1.1. Bus
- 8.1.2. LCV
- 8.1.3. M&HDT
- 8.1.4. Passenger Car
- 8.2. Market Analysis, Insights and Forecast - by Propulsion Type
- 8.2.1. BEV
- 8.2.2. PHEV
- 8.3. Market Analysis, Insights and Forecast - by Battery Chemistry
- 8.3.1. LFP
- 8.3.2. NCA
- 8.3.3. NCM
- 8.3.4. NMC
- 8.3.5. Others
- 8.4. Market Analysis, Insights and Forecast - by Capacity
- 8.4.1. 15 kWh to 40 kWh
- 8.4.2. 40 kWh to 80 kWh
- 8.4.3. Above 80 kWh
- 8.4.4. Less than 15 kWh
- 8.5. Market Analysis, Insights and Forecast - by Battery Form
- 8.5.1. Cylindrical
- 8.5.2. Pouch
- 8.5.3. Prismatic
- 8.6. Market Analysis, Insights and Forecast - by Method
- 8.6.1. Laser
- 8.6.2. Wire
- 8.7. Market Analysis, Insights and Forecast - by Component
- 8.7.1. Anode
- 8.7.2. Cathode
- 8.7.3. Electrolyte
- 8.7.4. Separator
- 8.8. Market Analysis, Insights and Forecast - by Material Type
- 8.8.1. Cobalt
- 8.8.2. Lithium
- 8.8.3. Manganese
- 8.8.4. Natural Graphite
- 8.8.5. Nickel
- 8.8.6. Other Materials
- 8.1. Market Analysis, Insights and Forecast - by Body Type
- 9. Middle East & Africa Electric Car Battery Market Analysis, Insights and Forecast, 2019-2031
- 9.1. Market Analysis, Insights and Forecast - by Body Type
- 9.1.1. Bus
- 9.1.2. LCV
- 9.1.3. M&HDT
- 9.1.4. Passenger Car
- 9.2. Market Analysis, Insights and Forecast - by Propulsion Type
- 9.2.1. BEV
- 9.2.2. PHEV
- 9.3. Market Analysis, Insights and Forecast - by Battery Chemistry
- 9.3.1. LFP
- 9.3.2. NCA
- 9.3.3. NCM
- 9.3.4. NMC
- 9.3.5. Others
- 9.4. Market Analysis, Insights and Forecast - by Capacity
- 9.4.1. 15 kWh to 40 kWh
- 9.4.2. 40 kWh to 80 kWh
- 9.4.3. Above 80 kWh
- 9.4.4. Less than 15 kWh
- 9.5. Market Analysis, Insights and Forecast - by Battery Form
- 9.5.1. Cylindrical
- 9.5.2. Pouch
- 9.5.3. Prismatic
- 9.6. Market Analysis, Insights and Forecast - by Method
- 9.6.1. Laser
- 9.6.2. Wire
- 9.7. Market Analysis, Insights and Forecast - by Component
- 9.7.1. Anode
- 9.7.2. Cathode
- 9.7.3. Electrolyte
- 9.7.4. Separator
- 9.8. Market Analysis, Insights and Forecast - by Material Type
- 9.8.1. Cobalt
- 9.8.2. Lithium
- 9.8.3. Manganese
- 9.8.4. Natural Graphite
- 9.8.5. Nickel
- 9.8.6. Other Materials
- 9.1. Market Analysis, Insights and Forecast - by Body Type
- 10. Asia Pacific Electric Car Battery Market Analysis, Insights and Forecast, 2019-2031
- 10.1. Market Analysis, Insights and Forecast - by Body Type
- 10.1.1. Bus
- 10.1.2. LCV
- 10.1.3. M&HDT
- 10.1.4. Passenger Car
- 10.2. Market Analysis, Insights and Forecast - by Propulsion Type
- 10.2.1. BEV
- 10.2.2. PHEV
- 10.3. Market Analysis, Insights and Forecast - by Battery Chemistry
- 10.3.1. LFP
- 10.3.2. NCA
- 10.3.3. NCM
- 10.3.4. NMC
- 10.3.5. Others
- 10.4. Market Analysis, Insights and Forecast - by Capacity
- 10.4.1. 15 kWh to 40 kWh
- 10.4.2. 40 kWh to 80 kWh
- 10.4.3. Above 80 kWh
- 10.4.4. Less than 15 kWh
- 10.5. Market Analysis, Insights and Forecast - by Battery Form
- 10.5.1. Cylindrical
- 10.5.2. Pouch
- 10.5.3. Prismatic
- 10.6. Market Analysis, Insights and Forecast - by Method
- 10.6.1. Laser
- 10.6.2. Wire
- 10.7. Market Analysis, Insights and Forecast - by Component
- 10.7.1. Anode
- 10.7.2. Cathode
- 10.7.3. Electrolyte
- 10.7.4. Separator
- 10.8. Market Analysis, Insights and Forecast - by Material Type
- 10.8.1. Cobalt
- 10.8.2. Lithium
- 10.8.3. Manganese
- 10.8.4. Natural Graphite
- 10.8.5. Nickel
- 10.8.6. Other Materials
- 10.1. Market Analysis, Insights and Forecast - by Body Type
- 11. Competitive Analysis
- 11.1. Global Market Share Analysis 2024
- 11.2. Company Profiles
- 11.2.1 ENVISION AESC UK Ltd
- 11.2.1.1. Overview
- 11.2.1.2. Products
- 11.2.1.3. SWOT Analysis
- 11.2.1.4. Recent Developments
- 11.2.1.5. Financials (Based on Availability)
- 11.2.2 China Aviation Battery Co Ltd (CALB)
- 11.2.2.1. Overview
- 11.2.2.2. Products
- 11.2.2.3. SWOT Analysis
- 11.2.2.4. Recent Developments
- 11.2.2.5. Financials (Based on Availability)
- 11.2.3 Samsung SDI Co Ltd
- 11.2.3.1. Overview
- 11.2.3.2. Products
- 11.2.3.3. SWOT Analysis
- 11.2.3.4. Recent Developments
- 11.2.3.5. Financials (Based on Availability)
- 11.2.4 LG Energy Solution Ltd
- 11.2.4.1. Overview
- 11.2.4.2. Products
- 11.2.4.3. SWOT Analysis
- 11.2.4.4. Recent Developments
- 11.2.4.5. Financials (Based on Availability)
- 11.2.5 Guoxuan High-tech Co Ltd
- 11.2.5.1. Overview
- 11.2.5.2. Products
- 11.2.5.3. SWOT Analysis
- 11.2.5.4. Recent Developments
- 11.2.5.5. Financials (Based on Availability)
- 11.2.6 Farasis Energy (Ganzhou) Co Ltd
- 11.2.6.1. Overview
- 11.2.6.2. Products
- 11.2.6.3. SWOT Analysis
- 11.2.6.4. Recent Developments
- 11.2.6.5. Financials (Based on Availability)
- 11.2.7 TOSHIBA Corp
- 11.2.7.1. Overview
- 11.2.7.2. Products
- 11.2.7.3. SWOT Analysis
- 11.2.7.4. Recent Developments
- 11.2.7.5. Financials (Based on Availability)
- 11.2.8 Primearth EV Energy Co Ltd
- 11.2.8.1. Overview
- 11.2.8.2. Products
- 11.2.8.3. SWOT Analysis
- 11.2.8.4. Recent Developments
- 11.2.8.5. Financials (Based on Availability)
- 11.2.9 Contemporary Amperex Technology Co Ltd (CATL)
- 11.2.9.1. Overview
- 11.2.9.2. Products
- 11.2.9.3. SWOT Analysis
- 11.2.9.4. Recent Developments
- 11.2.9.5. Financials (Based on Availability)
- 11.2.10 BYD Company Ltd
- 11.2.10.1. Overview
- 11.2.10.2. Products
- 11.2.10.3. SWOT Analysis
- 11.2.10.4. Recent Developments
- 11.2.10.5. Financials (Based on Availability)
- 11.2.11 SK Innovation Co Ltd
- 11.2.11.1. Overview
- 11.2.11.2. Products
- 11.2.11.3. SWOT Analysis
- 11.2.11.4. Recent Developments
- 11.2.11.5. Financials (Based on Availability)
- 11.2.12 EVE Energy Co Ltd
- 11.2.12.1. Overview
- 11.2.12.2. Products
- 11.2.12.3. SWOT Analysis
- 11.2.12.4. Recent Developments
- 11.2.12.5. Financials (Based on Availability)
- 11.2.13 Panasonic Holdings Corporation
- 11.2.13.1. Overview
- 11.2.13.2. Products
- 11.2.13.3. SWOT Analysis
- 11.2.13.4. Recent Developments
- 11.2.13.5. Financials (Based on Availability)
- 11.2.14 SVOLT Energy Technology Co Ltd (SVOLT)
- 11.2.14.1. Overview
- 11.2.14.2. Products
- 11.2.14.3. SWOT Analysis
- 11.2.14.4. Recent Developments
- 11.2.14.5. Financials (Based on Availability)
- 11.2.1 ENVISION AESC UK Ltd
List of Figures
- Figure 1: Global Electric Car Battery Market Revenue Breakdown (Million, %) by Region 2024 & 2032
- Figure 2: North America Electric Car Battery Market Revenue (Million), by Body Type 2024 & 2032
- Figure 3: North America Electric Car Battery Market Revenue Share (%), by Body Type 2024 & 2032
- Figure 4: North America Electric Car Battery Market Revenue (Million), by Propulsion Type 2024 & 2032
- Figure 5: North America Electric Car Battery Market Revenue Share (%), by Propulsion Type 2024 & 2032
- Figure 6: North America Electric Car Battery Market Revenue (Million), by Battery Chemistry 2024 & 2032
- Figure 7: North America Electric Car Battery Market Revenue Share (%), by Battery Chemistry 2024 & 2032
- Figure 8: North America Electric Car Battery Market Revenue (Million), by Capacity 2024 & 2032
- Figure 9: North America Electric Car Battery Market Revenue Share (%), by Capacity 2024 & 2032
- Figure 10: North America Electric Car Battery Market Revenue (Million), by Battery Form 2024 & 2032
- Figure 11: North America Electric Car Battery Market Revenue Share (%), by Battery Form 2024 & 2032
- Figure 12: North America Electric Car Battery Market Revenue (Million), by Method 2024 & 2032
- Figure 13: North America Electric Car Battery Market Revenue Share (%), by Method 2024 & 2032
- Figure 14: North America Electric Car Battery Market Revenue (Million), by Component 2024 & 2032
- Figure 15: North America Electric Car Battery Market Revenue Share (%), by Component 2024 & 2032
- Figure 16: North America Electric Car Battery Market Revenue (Million), by Material Type 2024 & 2032
- Figure 17: North America Electric Car Battery Market Revenue Share (%), by Material Type 2024 & 2032
- Figure 18: North America Electric Car Battery Market Revenue (Million), by Country 2024 & 2032
- Figure 19: North America Electric Car Battery Market Revenue Share (%), by Country 2024 & 2032
- Figure 20: South America Electric Car Battery Market Revenue (Million), by Body Type 2024 & 2032
- Figure 21: South America Electric Car Battery Market Revenue Share (%), by Body Type 2024 & 2032
- Figure 22: South America Electric Car Battery Market Revenue (Million), by Propulsion Type 2024 & 2032
- Figure 23: South America Electric Car Battery Market Revenue Share (%), by Propulsion Type 2024 & 2032
- Figure 24: South America Electric Car Battery Market Revenue (Million), by Battery Chemistry 2024 & 2032
- Figure 25: South America Electric Car Battery Market Revenue Share (%), by Battery Chemistry 2024 & 2032
- Figure 26: South America Electric Car Battery Market Revenue (Million), by Capacity 2024 & 2032
- Figure 27: South America Electric Car Battery Market Revenue Share (%), by Capacity 2024 & 2032
- Figure 28: South America Electric Car Battery Market Revenue (Million), by Battery Form 2024 & 2032
- Figure 29: South America Electric Car Battery Market Revenue Share (%), by Battery Form 2024 & 2032
- Figure 30: South America Electric Car Battery Market Revenue (Million), by Method 2024 & 2032
- Figure 31: South America Electric Car Battery Market Revenue Share (%), by Method 2024 & 2032
- Figure 32: South America Electric Car Battery Market Revenue (Million), by Component 2024 & 2032
- Figure 33: South America Electric Car Battery Market Revenue Share (%), by Component 2024 & 2032
- Figure 34: South America Electric Car Battery Market Revenue (Million), by Material Type 2024 & 2032
- Figure 35: South America Electric Car Battery Market Revenue Share (%), by Material Type 2024 & 2032
- Figure 36: South America Electric Car Battery Market Revenue (Million), by Country 2024 & 2032
- Figure 37: South America Electric Car Battery Market Revenue Share (%), by Country 2024 & 2032
- Figure 38: Europe Electric Car Battery Market Revenue (Million), by Body Type 2024 & 2032
- Figure 39: Europe Electric Car Battery Market Revenue Share (%), by Body Type 2024 & 2032
- Figure 40: Europe Electric Car Battery Market Revenue (Million), by Propulsion Type 2024 & 2032
- Figure 41: Europe Electric Car Battery Market Revenue Share (%), by Propulsion Type 2024 & 2032
- Figure 42: Europe Electric Car Battery Market Revenue (Million), by Battery Chemistry 2024 & 2032
- Figure 43: Europe Electric Car Battery Market Revenue Share (%), by Battery Chemistry 2024 & 2032
- Figure 44: Europe Electric Car Battery Market Revenue (Million), by Capacity 2024 & 2032
- Figure 45: Europe Electric Car Battery Market Revenue Share (%), by Capacity 2024 & 2032
- Figure 46: Europe Electric Car Battery Market Revenue (Million), by Battery Form 2024 & 2032
- Figure 47: Europe Electric Car Battery Market Revenue Share (%), by Battery Form 2024 & 2032
- Figure 48: Europe Electric Car Battery Market Revenue (Million), by Method 2024 & 2032
- Figure 49: Europe Electric Car Battery Market Revenue Share (%), by Method 2024 & 2032
- Figure 50: Europe Electric Car Battery Market Revenue (Million), by Component 2024 & 2032
- Figure 51: Europe Electric Car Battery Market Revenue Share (%), by Component 2024 & 2032
- Figure 52: Europe Electric Car Battery Market Revenue (Million), by Material Type 2024 & 2032
- Figure 53: Europe Electric Car Battery Market Revenue Share (%), by Material Type 2024 & 2032
- Figure 54: Europe Electric Car Battery Market Revenue (Million), by Country 2024 & 2032
- Figure 55: Europe Electric Car Battery Market Revenue Share (%), by Country 2024 & 2032
- Figure 56: Middle East & Africa Electric Car Battery Market Revenue (Million), by Body Type 2024 & 2032
- Figure 57: Middle East & Africa Electric Car Battery Market Revenue Share (%), by Body Type 2024 & 2032
- Figure 58: Middle East & Africa Electric Car Battery Market Revenue (Million), by Propulsion Type 2024 & 2032
- Figure 59: Middle East & Africa Electric Car Battery Market Revenue Share (%), by Propulsion Type 2024 & 2032
- Figure 60: Middle East & Africa Electric Car Battery Market Revenue (Million), by Battery Chemistry 2024 & 2032
- Figure 61: Middle East & Africa Electric Car Battery Market Revenue Share (%), by Battery Chemistry 2024 & 2032
- Figure 62: Middle East & Africa Electric Car Battery Market Revenue (Million), by Capacity 2024 & 2032
- Figure 63: Middle East & Africa Electric Car Battery Market Revenue Share (%), by Capacity 2024 & 2032
- Figure 64: Middle East & Africa Electric Car Battery Market Revenue (Million), by Battery Form 2024 & 2032
- Figure 65: Middle East & Africa Electric Car Battery Market Revenue Share (%), by Battery Form 2024 & 2032
- Figure 66: Middle East & Africa Electric Car Battery Market Revenue (Million), by Method 2024 & 2032
- Figure 67: Middle East & Africa Electric Car Battery Market Revenue Share (%), by Method 2024 & 2032
- Figure 68: Middle East & Africa Electric Car Battery Market Revenue (Million), by Component 2024 & 2032
- Figure 69: Middle East & Africa Electric Car Battery Market Revenue Share (%), by Component 2024 & 2032
- Figure 70: Middle East & Africa Electric Car Battery Market Revenue (Million), by Material Type 2024 & 2032
- Figure 71: Middle East & Africa Electric Car Battery Market Revenue Share (%), by Material Type 2024 & 2032
- Figure 72: Middle East & Africa Electric Car Battery Market Revenue (Million), by Country 2024 & 2032
- Figure 73: Middle East & Africa Electric Car Battery Market Revenue Share (%), by Country 2024 & 2032
- Figure 74: Asia Pacific Electric Car Battery Market Revenue (Million), by Body Type 2024 & 2032
- Figure 75: Asia Pacific Electric Car Battery Market Revenue Share (%), by Body Type 2024 & 2032
- Figure 76: Asia Pacific Electric Car Battery Market Revenue (Million), by Propulsion Type 2024 & 2032
- Figure 77: Asia Pacific Electric Car Battery Market Revenue Share (%), by Propulsion Type 2024 & 2032
- Figure 78: Asia Pacific Electric Car Battery Market Revenue (Million), by Battery Chemistry 2024 & 2032
- Figure 79: Asia Pacific Electric Car Battery Market Revenue Share (%), by Battery Chemistry 2024 & 2032
- Figure 80: Asia Pacific Electric Car Battery Market Revenue (Million), by Capacity 2024 & 2032
- Figure 81: Asia Pacific Electric Car Battery Market Revenue Share (%), by Capacity 2024 & 2032
- Figure 82: Asia Pacific Electric Car Battery Market Revenue (Million), by Battery Form 2024 & 2032
- Figure 83: Asia Pacific Electric Car Battery Market Revenue Share (%), by Battery Form 2024 & 2032
- Figure 84: Asia Pacific Electric Car Battery Market Revenue (Million), by Method 2024 & 2032
- Figure 85: Asia Pacific Electric Car Battery Market Revenue Share (%), by Method 2024 & 2032
- Figure 86: Asia Pacific Electric Car Battery Market Revenue (Million), by Component 2024 & 2032
- Figure 87: Asia Pacific Electric Car Battery Market Revenue Share (%), by Component 2024 & 2032
- Figure 88: Asia Pacific Electric Car Battery Market Revenue (Million), by Material Type 2024 & 2032
- Figure 89: Asia Pacific Electric Car Battery Market Revenue Share (%), by Material Type 2024 & 2032
- Figure 90: Asia Pacific Electric Car Battery Market Revenue (Million), by Country 2024 & 2032
- Figure 91: Asia Pacific Electric Car Battery Market Revenue Share (%), by Country 2024 & 2032
List of Tables
- Table 1: Global Electric Car Battery Market Revenue Million Forecast, by Region 2019 & 2032
- Table 2: Global Electric Car Battery Market Revenue Million Forecast, by Body Type 2019 & 2032
- Table 3: Global Electric Car Battery Market Revenue Million Forecast, by Propulsion Type 2019 & 2032
- Table 4: Global Electric Car Battery Market Revenue Million Forecast, by Battery Chemistry 2019 & 2032
- Table 5: Global Electric Car Battery Market Revenue Million Forecast, by Capacity 2019 & 2032
- Table 6: Global Electric Car Battery Market Revenue Million Forecast, by Battery Form 2019 & 2032
- Table 7: Global Electric Car Battery Market Revenue Million Forecast, by Method 2019 & 2032
- Table 8: Global Electric Car Battery Market Revenue Million Forecast, by Component 2019 & 2032
- Table 9: Global Electric Car Battery Market Revenue Million Forecast, by Material Type 2019 & 2032
- Table 10: Global Electric Car Battery Market Revenue Million Forecast, by Region 2019 & 2032
- Table 11: Global Electric Car Battery Market Revenue Million Forecast, by Body Type 2019 & 2032
- Table 12: Global Electric Car Battery Market Revenue Million Forecast, by Propulsion Type 2019 & 2032
- Table 13: Global Electric Car Battery Market Revenue Million Forecast, by Battery Chemistry 2019 & 2032
- Table 14: Global Electric Car Battery Market Revenue Million Forecast, by Capacity 2019 & 2032
- Table 15: Global Electric Car Battery Market Revenue Million Forecast, by Battery Form 2019 & 2032
- Table 16: Global Electric Car Battery Market Revenue Million Forecast, by Method 2019 & 2032
- Table 17: Global Electric Car Battery Market Revenue Million Forecast, by Component 2019 & 2032
- Table 18: Global Electric Car Battery Market Revenue Million Forecast, by Material Type 2019 & 2032
- Table 19: Global Electric Car Battery Market Revenue Million Forecast, by Country 2019 & 2032
- Table 20: United States Electric Car Battery Market Revenue (Million) Forecast, by Application 2019 & 2032
- Table 21: Canada Electric Car Battery Market Revenue (Million) Forecast, by Application 2019 & 2032
- Table 22: Mexico Electric Car Battery Market Revenue (Million) Forecast, by Application 2019 & 2032
- Table 23: Global Electric Car Battery Market Revenue Million Forecast, by Body Type 2019 & 2032
- Table 24: Global Electric Car Battery Market Revenue Million Forecast, by Propulsion Type 2019 & 2032
- Table 25: Global Electric Car Battery Market Revenue Million Forecast, by Battery Chemistry 2019 & 2032
- Table 26: Global Electric Car Battery Market Revenue Million Forecast, by Capacity 2019 & 2032
- Table 27: Global Electric Car Battery Market Revenue Million Forecast, by Battery Form 2019 & 2032
- Table 28: Global Electric Car Battery Market Revenue Million Forecast, by Method 2019 & 2032
- Table 29: Global Electric Car Battery Market Revenue Million Forecast, by Component 2019 & 2032
- Table 30: Global Electric Car Battery Market Revenue Million Forecast, by Material Type 2019 & 2032
- Table 31: Global Electric Car Battery Market Revenue Million Forecast, by Country 2019 & 2032
- Table 32: Brazil Electric Car Battery Market Revenue (Million) Forecast, by Application 2019 & 2032
- Table 33: Argentina Electric Car Battery Market Revenue (Million) Forecast, by Application 2019 & 2032
- Table 34: Rest of South America Electric Car Battery Market Revenue (Million) Forecast, by Application 2019 & 2032
- Table 35: Global Electric Car Battery Market Revenue Million Forecast, by Body Type 2019 & 2032
- Table 36: Global Electric Car Battery Market Revenue Million Forecast, by Propulsion Type 2019 & 2032
- Table 37: Global Electric Car Battery Market Revenue Million Forecast, by Battery Chemistry 2019 & 2032
- Table 38: Global Electric Car Battery Market Revenue Million Forecast, by Capacity 2019 & 2032
- Table 39: Global Electric Car Battery Market Revenue Million Forecast, by Battery Form 2019 & 2032
- Table 40: Global Electric Car Battery Market Revenue Million Forecast, by Method 2019 & 2032
- Table 41: Global Electric Car Battery Market Revenue Million Forecast, by Component 2019 & 2032
- Table 42: Global Electric Car Battery Market Revenue Million Forecast, by Material Type 2019 & 2032
- Table 43: Global Electric Car Battery Market Revenue Million Forecast, by Country 2019 & 2032
- Table 44: United Kingdom Electric Car Battery Market Revenue (Million) Forecast, by Application 2019 & 2032
- Table 45: Germany Electric Car Battery Market Revenue (Million) Forecast, by Application 2019 & 2032
- Table 46: France Electric Car Battery Market Revenue (Million) Forecast, by Application 2019 & 2032
- Table 47: Italy Electric Car Battery Market Revenue (Million) Forecast, by Application 2019 & 2032
- Table 48: Spain Electric Car Battery Market Revenue (Million) Forecast, by Application 2019 & 2032
- Table 49: Russia Electric Car Battery Market Revenue (Million) Forecast, by Application 2019 & 2032
- Table 50: Benelux Electric Car Battery Market Revenue (Million) Forecast, by Application 2019 & 2032
- Table 51: Nordics Electric Car Battery Market Revenue (Million) Forecast, by Application 2019 & 2032
- Table 52: Rest of Europe Electric Car Battery Market Revenue (Million) Forecast, by Application 2019 & 2032
- Table 53: Global Electric Car Battery Market Revenue Million Forecast, by Body Type 2019 & 2032
- Table 54: Global Electric Car Battery Market Revenue Million Forecast, by Propulsion Type 2019 & 2032
- Table 55: Global Electric Car Battery Market Revenue Million Forecast, by Battery Chemistry 2019 & 2032
- Table 56: Global Electric Car Battery Market Revenue Million Forecast, by Capacity 2019 & 2032
- Table 57: Global Electric Car Battery Market Revenue Million Forecast, by Battery Form 2019 & 2032
- Table 58: Global Electric Car Battery Market Revenue Million Forecast, by Method 2019 & 2032
- Table 59: Global Electric Car Battery Market Revenue Million Forecast, by Component 2019 & 2032
- Table 60: Global Electric Car Battery Market Revenue Million Forecast, by Material Type 2019 & 2032
- Table 61: Global Electric Car Battery Market Revenue Million Forecast, by Country 2019 & 2032
- Table 62: Turkey Electric Car Battery Market Revenue (Million) Forecast, by Application 2019 & 2032
- Table 63: Israel Electric Car Battery Market Revenue (Million) Forecast, by Application 2019 & 2032
- Table 64: GCC Electric Car Battery Market Revenue (Million) Forecast, by Application 2019 & 2032
- Table 65: North Africa Electric Car Battery Market Revenue (Million) Forecast, by Application 2019 & 2032
- Table 66: South Africa Electric Car Battery Market Revenue (Million) Forecast, by Application 2019 & 2032
- Table 67: Rest of Middle East & Africa Electric Car Battery Market Revenue (Million) Forecast, by Application 2019 & 2032
- Table 68: Global Electric Car Battery Market Revenue Million Forecast, by Body Type 2019 & 2032
- Table 69: Global Electric Car Battery Market Revenue Million Forecast, by Propulsion Type 2019 & 2032
- Table 70: Global Electric Car Battery Market Revenue Million Forecast, by Battery Chemistry 2019 & 2032
- Table 71: Global Electric Car Battery Market Revenue Million Forecast, by Capacity 2019 & 2032
- Table 72: Global Electric Car Battery Market Revenue Million Forecast, by Battery Form 2019 & 2032
- Table 73: Global Electric Car Battery Market Revenue Million Forecast, by Method 2019 & 2032
- Table 74: Global Electric Car Battery Market Revenue Million Forecast, by Component 2019 & 2032
- Table 75: Global Electric Car Battery Market Revenue Million Forecast, by Material Type 2019 & 2032
- Table 76: Global Electric Car Battery Market Revenue Million Forecast, by Country 2019 & 2032
- Table 77: China Electric Car Battery Market Revenue (Million) Forecast, by Application 2019 & 2032
- Table 78: India Electric Car Battery Market Revenue (Million) Forecast, by Application 2019 & 2032
- Table 79: Japan Electric Car Battery Market Revenue (Million) Forecast, by Application 2019 & 2032
- Table 80: South Korea Electric Car Battery Market Revenue (Million) Forecast, by Application 2019 & 2032
- Table 81: ASEAN Electric Car Battery Market Revenue (Million) Forecast, by Application 2019 & 2032
- Table 82: Oceania Electric Car Battery Market Revenue (Million) Forecast, by Application 2019 & 2032
- Table 83: Rest of Asia Pacific Electric Car Battery Market Revenue (Million) Forecast, by Application 2019 & 2032
Frequently Asked Questions
1. What is the projected Compound Annual Growth Rate (CAGR) of the Electric Car Battery Market?
The projected CAGR is approximately 10.55%.
2. Which companies are prominent players in the Electric Car Battery Market?
Key companies in the market include ENVISION AESC UK Ltd, China Aviation Battery Co Ltd (CALB), Samsung SDI Co Ltd, LG Energy Solution Ltd, Guoxuan High-tech Co Ltd, Farasis Energy (Ganzhou) Co Ltd, TOSHIBA Corp, Primearth EV Energy Co Ltd, Contemporary Amperex Technology Co Ltd (CATL), BYD Company Ltd, SK Innovation Co Ltd, EVE Energy Co Ltd, Panasonic Holdings Corporation, SVOLT Energy Technology Co Ltd (SVOLT).
3. What are the main segments of the Electric Car Battery Market?
The market segments include Body Type, Propulsion Type, Battery Chemistry, Capacity, Battery Form, Method, Component, Material Type.
4. Can you provide details about the market size?
The market size is estimated to be USD XX Million as of 2022.
5. What are some drivers contributing to market growth?
Growing Travel and Tourism Industry is Driving the Car Rental Market.
6. What are the notable trends driving market growth?
OTHER KEY INDUSTRY TRENDS COVERED IN THE REPORT.
7. Are there any restraints impacting market growth?
Increasing Popularity of Ride-Sharing Services Pose Challenges for the Conventional Car Rental Market.
8. Can you provide examples of recent developments in the market?
June 2023: CATL announced that it launched Qiji Energy, a battery swap solution for heavy-duty trucks. The solution consists of Qiji Swapping Electric Blocks, Qiji Battery Swap Station, and Qiji Cloud Platform. Based on the CATL’s 3rd-generation LFP battery chemistry, Qiji Swapping Electric Blocks adopt the innovative NP (Non Propagation) technology and CTP (cell-to-pack) technology, striking a balance between safety and usage costs. Qiji Battery Swap Station enables one-stop swapping for different truck models and brands.January 2023: Chinese cell manufacturer, China Lithium Battery Technology Co., Ltd. (CALB), has partnered with Forsee Power to integrate high energy density cells into its battery systems.January 2023: Shinhan Securities Co., Ltd. has signed an MOU with SK On Co., Ltd. (SK On) on an investment alliance for a secondary battery ecosystem.
9. What pricing options are available for accessing the report?
Pricing options include single-user, multi-user, and enterprise licenses priced at USD 3800, USD 4500, and USD 5800 respectively.
10. Is the market size provided in terms of value or volume?
The market size is provided in terms of value, measured in Million.
11. Are there any specific market keywords associated with the report?
Yes, the market keyword associated with the report is "Electric Car Battery Market," which aids in identifying and referencing the specific market segment covered.
12. How do I determine which pricing option suits my needs best?
The pricing options vary based on user requirements and access needs. Individual users may opt for single-user licenses, while businesses requiring broader access may choose multi-user or enterprise licenses for cost-effective access to the report.
13. Are there any additional resources or data provided in the Electric Car Battery Market report?
While the report offers comprehensive insights, it's advisable to review the specific contents or supplementary materials provided to ascertain if additional resources or data are available.
14. How can I stay updated on further developments or reports in the Electric Car Battery Market?
To stay informed about further developments, trends, and reports in the Electric Car Battery Market, consider subscribing to industry newsletters, following relevant companies and organizations, or regularly checking reputable industry news sources and publications.
Methodology
Step 1 - Identification of Relevant Samples Size from Population Database


Step 2 - Approaches for Defining Global Market Size (Value, Volume* & Price*)

Note*: In applicable scenarios
Step 3 - Data Sources
Primary Research
- Web Analytics
- Survey Reports
- Research Institute
- Latest Research Reports
- Opinion Leaders
Secondary Research
- Annual Reports
- White Paper
- Latest Press Release
- Industry Association
- Paid Database
- Investor Presentations

Step 4 - Data Triangulation
Involves using different sources of information in order to increase the validity of a study
These sources are likely to be stakeholders in a program - participants, other researchers, program staff, other community members, and so on.
Then we put all data in single framework & apply various statistical tools to find out the dynamic on the market.
During the analysis stage, feedback from the stakeholder groups would be compared to determine areas of agreement as well as areas of divergence


