
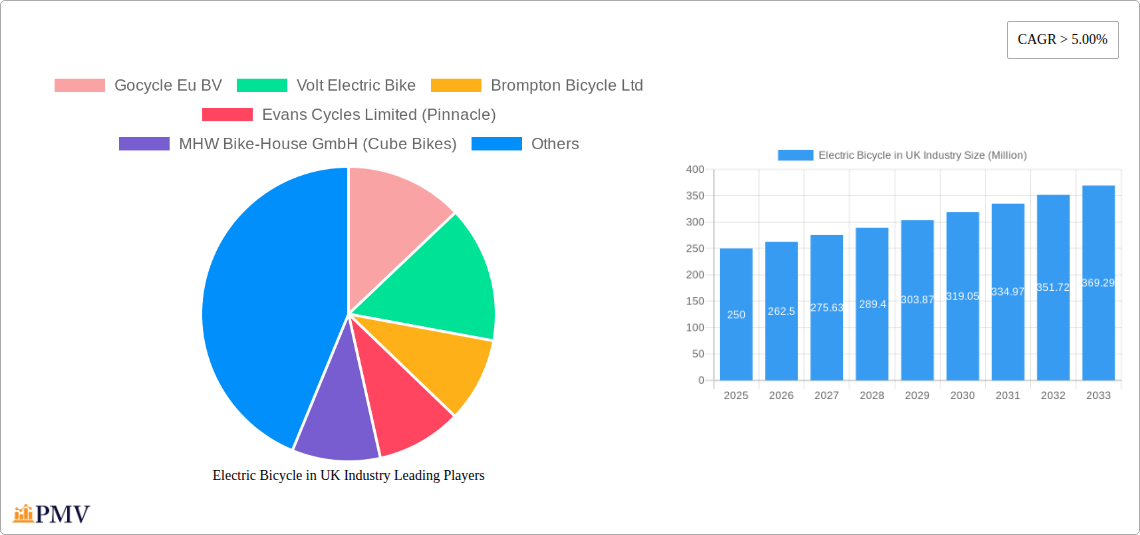
Key Insights
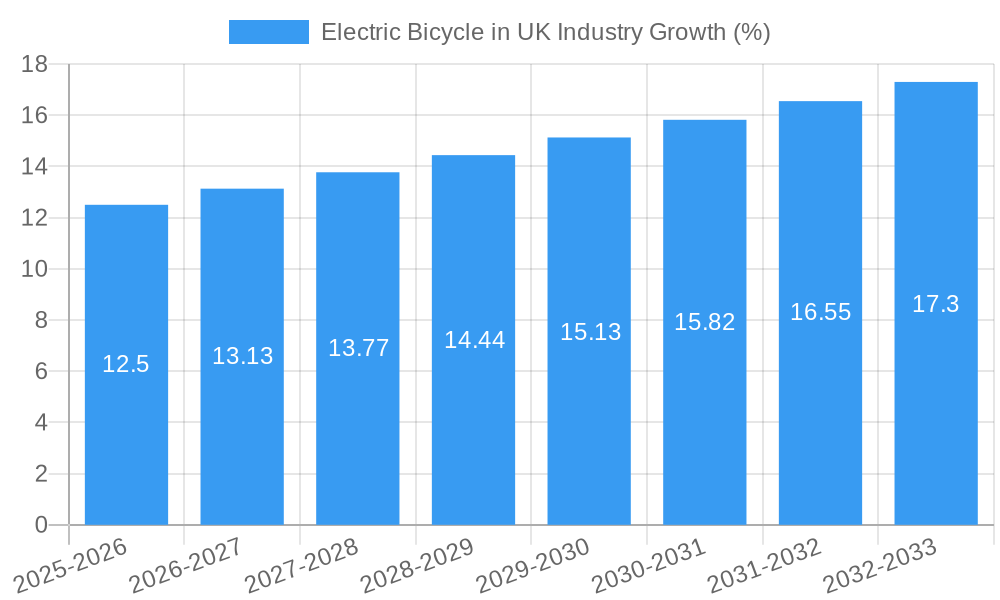
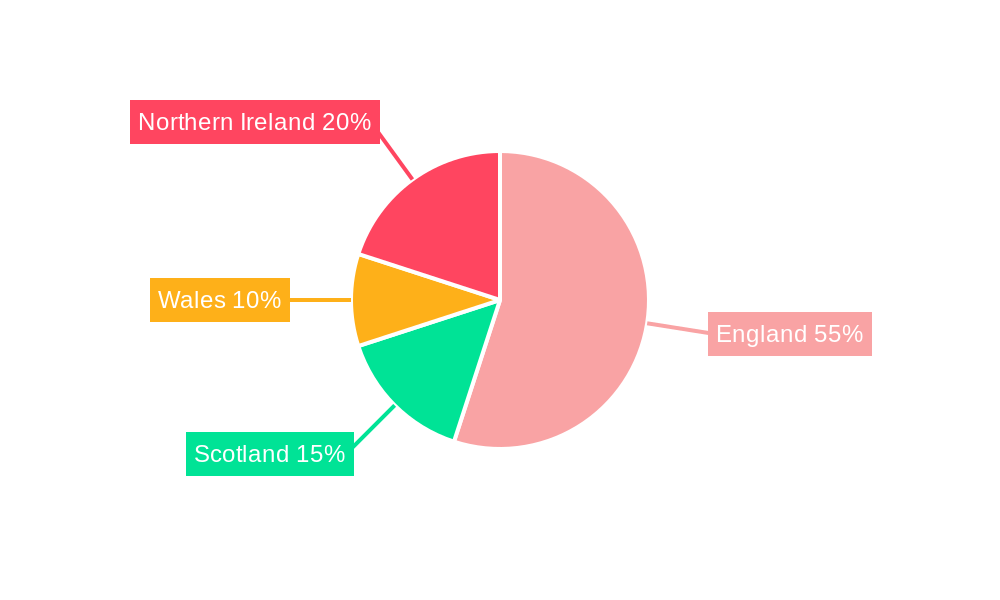
The UK electric bicycle market is experiencing robust growth, projected to maintain a Compound Annual Growth Rate (CAGR) exceeding 5% from 2025 to 2033. This expansion is driven by several key factors. Increasing environmental awareness and concerns about carbon emissions are prompting consumers to seek eco-friendly transportation alternatives. Government initiatives promoting cycling and the adoption of electric vehicles further stimulate market demand. The convenience and practicality of e-bikes, particularly for shorter commutes and urban navigation, also contribute significantly to market growth. Segmentation reveals a diverse landscape, with pedal-assisted e-bikes holding a substantial market share due to their versatility and ease of use. However, speed pedelecs and throttle-assisted models are gaining traction, fueled by the desire for faster travel. Lithium-ion batteries dominate the battery segment owing to their superior performance and longer lifespan compared to lead-acid counterparts. The application type segment shows strong demand across city/urban, trekking, and cargo/utility e-bikes, reflecting the multifaceted uses of these vehicles. Leading players like Gocycle, Volt, Brompton, and Giant are actively shaping the market through innovation and expanding product portfolios. The regional distribution within the UK shows significant uptake across England, Wales, Scotland, and Northern Ireland, with market penetration potentially higher in urban areas with established cycling infrastructure.
The competitive landscape is dynamic, with established bicycle manufacturers alongside specialized e-bike companies vying for market share. Innovation in battery technology, particularly focusing on longer range and faster charging times, is a key area of focus for manufacturers. Moreover, advancements in e-bike design and integration of smart features are enhancing the user experience and driving sales. While challenges exist, such as the initial higher purchase price compared to traditional bicycles and concerns about battery lifespan and charging infrastructure, the overall market trajectory suggests continued expansion. The increasing availability of financing options and government incentives are mitigating some of these challenges, contributing to the optimistic forecast for the UK electric bicycle market. We estimate the 2025 market size to be around £250 million, based on reported CAGR and industry growth patterns. This figure is projected to increase substantially by 2033, propelled by the trends discussed above.
Electric Bicycle in UK Industry: A Comprehensive Market Report (2019-2033)
This in-depth report provides a comprehensive analysis of the UK electric bicycle (e-bike) industry, offering valuable insights for stakeholders across the value chain. Covering the period 2019-2033, with a focus on 2025, this report unveils market trends, competitive dynamics, and future growth prospects within the rapidly expanding UK e-bike sector. The report is meticulously researched, providing actionable data and strategic recommendations for businesses operating or planning to enter this dynamic market. The total market value is predicted to reach £xx Million by 2033.
Electric Bicycle in UK Industry Market Structure & Competitive Dynamics
The UK electric bicycle market is characterized by a moderately fragmented structure, with a mix of established brands and emerging players. Market concentration is relatively low, with no single dominant player controlling a significant majority of market share. However, key players like Gocycle, Volt Electric Bike, and Brompton Bicycle Ltd hold substantial shares, driving innovation and influencing market trends. The competitive landscape is further shaped by a robust innovation ecosystem, fostering the development of new technologies and product features.
Regulatory frameworks, such as safety standards and emission regulations, play a crucial role in shaping market dynamics. Furthermore, the market witnesses increasing M&A activity, reflecting the consolidation efforts of major players and the entrance of new investors. Significant M&A deals during the historical period (2019-2024) reached a cumulative value of approximately £xx Million.
- Market Share (2024 Estimate): Brompton Bicycle Ltd (15%), Gocycle (10%), Volt Electric Bike (8%), Others (67%).
- M&A Deal Value (2019-2024): £xx Million (estimated)
- Key Competitive Factors: Innovation, Brand Reputation, Distribution Network, Pricing Strategy, After-sales service
The presence of substitute products, such as traditional bicycles and other forms of personal transportation, influences consumer choices. End-user trends toward sustainability and eco-friendly transportation are key drivers fueling market growth.
Electric Bicycle in UK Industry Industry Trends & Insights
The UK e-bike market has experienced significant growth during the historical period (2019-2024), fueled by increasing environmental concerns, government incentives for greener transportation, and technological advancements leading to improved battery life and performance. The market is projected to maintain a strong Compound Annual Growth Rate (CAGR) of xx% during the forecast period (2025-2033). Market penetration, currently estimated at xx%, is expected to increase substantially, reaching xx% by 2033, driven by rising consumer awareness and favourable government policies.
Technological disruptions, including advancements in battery technology (longer range, faster charging), improved motor efficiency, and smart connectivity features, are reshaping the industry. Consumer preferences are shifting toward lighter, more stylish, and technologically advanced e-bikes, with increasing demand for integrated features like GPS navigation and smartphone connectivity. The competitive dynamics are marked by intense rivalry among established players and the emergence of new entrants offering innovative products and services. Government initiatives, such as the Cycle to Work scheme, contribute significantly to the market’s growth.
Dominant Markets & Segments in Electric Bicycle in UK Industry
The UK e-bike market shows strong growth across various segments. However, the City/Urban segment currently holds the largest market share, driven by increasing urbanization and the need for efficient, sustainable urban transportation. The Lithium-ion Battery segment dominates the battery type market, owing to its superior performance compared to lead-acid batteries. The Pedal Assisted propulsion type also holds a leading position, favoured by consumers for its ease of use and longer range.
- Key Drivers for City/Urban Segment: Growing urbanization, improved cycling infrastructure, government incentives, and reduced traffic congestion.
- Key Drivers for Lithium-ion Battery Segment: Longer battery life, improved performance, and increased safety compared to lead-acid batteries.
- Key Drivers for Pedal Assisted Segment: Natural riding feel, extended range, and suitability for diverse terrains.
Regional dominance is currently observed in urban areas with well-established cycling infrastructure, such as London and other major cities. Government policies promoting cycling, investment in cycling infrastructure, and awareness campaigns play a vital role in shaping regional market dynamics.
Electric Bicycle in UK Industry Product Innovations
Recent product innovations in the UK e-bike market focus on improved battery technology, lighter frame designs, integrated smart features, and enhanced safety systems. Companies are introducing e-bikes with increased range, faster charging capabilities, and improved integration with smartphone apps for navigation and fitness tracking. The market is witnessing a trend towards more stylish and aesthetically appealing designs, appealing to a broader range of consumers. These advancements cater to the growing demand for high-performance, user-friendly, and technologically advanced e-bikes.
Report Segmentation & Scope
This report provides a detailed segmentation of the UK e-bike market based on propulsion type (Pedal Assisted, Speed Pedelec, Throttle Assisted), application type (Cargo/Utility, City/Urban, Trekking), and battery type (Lead Acid Battery, Lithium-ion Battery, Others). Each segment’s growth projections, market size (in £ Million), and competitive dynamics are analyzed. The report covers historical data (2019-2024), current market conditions (2025), and future forecasts (2025-2033).
- Propulsion Type: The Pedal Assisted segment is projected to maintain its dominance due to its versatility and efficiency, with a projected market size of £xx Million by 2033.
- Application Type: The City/Urban segment will continue its strong growth trajectory, driven by urbanisation and eco-conscious consumer choices. The market size is estimated at £xx Million by 2033.
- Battery Type: Lithium-ion batteries will dominate the market, owing to their superior performance, with a projected market size of £xx Million by 2033.
Key Drivers of Electric Bicycle in UK Industry Growth
Several factors contribute to the growth of the UK e-bike market. Technological advancements in battery technology, leading to extended range and faster charging, are a significant driver. Government initiatives promoting cycling through subsidies and improved infrastructure create a favorable environment. Increasing environmental awareness among consumers fuels the demand for sustainable transportation solutions. Finally, the convenience and affordability of e-bikes compared to cars make them an attractive option for commuting and recreational purposes.
Challenges in the Electric Bicycle in UK Industry Sector
The UK e-bike market faces several challenges. Supply chain disruptions can impact production and availability. The relatively high initial cost of e-bikes compared to traditional bicycles can limit market penetration among certain demographics. Concerns about battery life and charging infrastructure remain. Competition from other forms of personal transportation, such as electric scooters, poses a challenge.
Leading Players in the Electric Bicycle in UK Industry Market
- Gocycle Eu BV
- Volt Electric Bike
- Brompton Bicycle Ltd
- Evans Cycles Limited (Pinnacle)
- MHW Bike-House GmbH (Cube Bikes)
- Raleigh Bicycle Company
- Tandem Group Cycles (Falcon Cycles)
- Giant Manufacturing Co Ltd
- POWABYKE UK LIMITED (Powabyke)
- Trek Bicycle Corporation
- Tandem Group Cycles (DAWES)
Key Developments in Electric Bicycle in UK Industry Sector
- November 2022: The Tandem Group opens an eMobility sales and demo showroom in Birmingham, showcasing its commitment to the electric vehicle market.
- November 2022: Giant unveils the Stormguard E+, a full-suspension e-bike, signifying advancements in e-bike technology and design.
- December 2022: Volt Bikes and City AM collaborate on an ESG-focused project, highlighting the industry's increasing focus on environmental and social responsibility.
Strategic Electric Bicycle in UK Industry Market Outlook
The UK e-bike market presents significant growth potential. Continued technological advancements, supportive government policies, and rising consumer demand for sustainable transportation solutions will drive market expansion. Strategic opportunities lie in developing innovative products, expanding distribution networks, and targeting specific consumer segments. The market’s future success hinges on addressing challenges related to supply chain management, affordability, and infrastructure development. The focus on environmentally friendly initiatives and sustainable manufacturing processes will play a key role in shaping the future of the UK electric bicycle market.
Electric Bicycle in UK Industry Segmentation
-
1. Propulsion Type
- 1.1. Pedal Assisted
- 1.2. Speed Pedelec
- 1.3. Throttle Assisted
-
2. Application Type
- 2.1. Cargo/Utility
- 2.2. City/Urban
- 2.3. Trekking
-
3. Battery Type
- 3.1. Lead Acid Battery
- 3.2. Lithium-ion Battery
- 3.3. Others
Electric Bicycle in UK Industry Segmentation By Geography
-
1. North America
- 1.1. United States
- 1.2. Canada
- 1.3. Mexico
-
2. South America
- 2.1. Brazil
- 2.2. Argentina
- 2.3. Rest of South America
-
3. Europe
- 3.1. United Kingdom
- 3.2. Germany
- 3.3. France
- 3.4. Italy
- 3.5. Spain
- 3.6. Russia
- 3.7. Benelux
- 3.8. Nordics
- 3.9. Rest of Europe
-
4. Middle East & Africa
- 4.1. Turkey
- 4.2. Israel
- 4.3. GCC
- 4.4. North Africa
- 4.5. South Africa
- 4.6. Rest of Middle East & Africa
-
5. Asia Pacific
- 5.1. China
- 5.2. India
- 5.3. Japan
- 5.4. South Korea
- 5.5. ASEAN
- 5.6. Oceania
- 5.7. Rest of Asia Pacific
Electric Bicycle in UK Industry REPORT HIGHLIGHTS
| Aspects | Details |
|---|---|
| Study Period | 2019-2033 |
| Base Year | 2024 |
| Estimated Year | 2025 |
| Forecast Period | 2025-2033 |
| Historical Period | 2019-2024 |
| Growth Rate | CAGR of > 5.00% from 2019-2033 |
| Segmentation |
|
Table of Contents
- 1. Introduction
- 1.1. Research Scope
- 1.2. Market Segmentation
- 1.3. Research Methodology
- 1.4. Definitions and Assumptions
- 2. Executive Summary
- 2.1. Introduction
- 3. Market Dynamics
- 3.1. Introduction
- 3.2. Market Drivers
- 3.2.1. The Growth of The Global Automotive Turbocharger Market
- 3.3. Market Restrains
- 3.3.1. Increasing Complexity of Modern Vehicles
- 3.4. Market Trends
- 3.4.1. OTHER KEY INDUSTRY TRENDS COVERED IN THE REPORT
- 4. Market Factor Analysis
- 4.1. Porters Five Forces
- 4.2. Supply/Value Chain
- 4.3. PESTEL analysis
- 4.4. Market Entropy
- 4.5. Patent/Trademark Analysis
- 5. Global Electric Bicycle in UK Industry Analysis, Insights and Forecast, 2019-2031
- 5.1. Market Analysis, Insights and Forecast - by Propulsion Type
- 5.1.1. Pedal Assisted
- 5.1.2. Speed Pedelec
- 5.1.3. Throttle Assisted
- 5.2. Market Analysis, Insights and Forecast - by Application Type
- 5.2.1. Cargo/Utility
- 5.2.2. City/Urban
- 5.2.3. Trekking
- 5.3. Market Analysis, Insights and Forecast - by Battery Type
- 5.3.1. Lead Acid Battery
- 5.3.2. Lithium-ion Battery
- 5.3.3. Others
- 5.4. Market Analysis, Insights and Forecast - by Region
- 5.4.1. North America
- 5.4.2. South America
- 5.4.3. Europe
- 5.4.4. Middle East & Africa
- 5.4.5. Asia Pacific
- 5.1. Market Analysis, Insights and Forecast - by Propulsion Type
- 6. North America Electric Bicycle in UK Industry Analysis, Insights and Forecast, 2019-2031
- 6.1. Market Analysis, Insights and Forecast - by Propulsion Type
- 6.1.1. Pedal Assisted
- 6.1.2. Speed Pedelec
- 6.1.3. Throttle Assisted
- 6.2. Market Analysis, Insights and Forecast - by Application Type
- 6.2.1. Cargo/Utility
- 6.2.2. City/Urban
- 6.2.3. Trekking
- 6.3. Market Analysis, Insights and Forecast - by Battery Type
- 6.3.1. Lead Acid Battery
- 6.3.2. Lithium-ion Battery
- 6.3.3. Others
- 6.1. Market Analysis, Insights and Forecast - by Propulsion Type
- 7. South America Electric Bicycle in UK Industry Analysis, Insights and Forecast, 2019-2031
- 7.1. Market Analysis, Insights and Forecast - by Propulsion Type
- 7.1.1. Pedal Assisted
- 7.1.2. Speed Pedelec
- 7.1.3. Throttle Assisted
- 7.2. Market Analysis, Insights and Forecast - by Application Type
- 7.2.1. Cargo/Utility
- 7.2.2. City/Urban
- 7.2.3. Trekking
- 7.3. Market Analysis, Insights and Forecast - by Battery Type
- 7.3.1. Lead Acid Battery
- 7.3.2. Lithium-ion Battery
- 7.3.3. Others
- 7.1. Market Analysis, Insights and Forecast - by Propulsion Type
- 8. Europe Electric Bicycle in UK Industry Analysis, Insights and Forecast, 2019-2031
- 8.1. Market Analysis, Insights and Forecast - by Propulsion Type
- 8.1.1. Pedal Assisted
- 8.1.2. Speed Pedelec
- 8.1.3. Throttle Assisted
- 8.2. Market Analysis, Insights and Forecast - by Application Type
- 8.2.1. Cargo/Utility
- 8.2.2. City/Urban
- 8.2.3. Trekking
- 8.3. Market Analysis, Insights and Forecast - by Battery Type
- 8.3.1. Lead Acid Battery
- 8.3.2. Lithium-ion Battery
- 8.3.3. Others
- 8.1. Market Analysis, Insights and Forecast - by Propulsion Type
- 9. Middle East & Africa Electric Bicycle in UK Industry Analysis, Insights and Forecast, 2019-2031
- 9.1. Market Analysis, Insights and Forecast - by Propulsion Type
- 9.1.1. Pedal Assisted
- 9.1.2. Speed Pedelec
- 9.1.3. Throttle Assisted
- 9.2. Market Analysis, Insights and Forecast - by Application Type
- 9.2.1. Cargo/Utility
- 9.2.2. City/Urban
- 9.2.3. Trekking
- 9.3. Market Analysis, Insights and Forecast - by Battery Type
- 9.3.1. Lead Acid Battery
- 9.3.2. Lithium-ion Battery
- 9.3.3. Others
- 9.1. Market Analysis, Insights and Forecast - by Propulsion Type
- 10. Asia Pacific Electric Bicycle in UK Industry Analysis, Insights and Forecast, 2019-2031
- 10.1. Market Analysis, Insights and Forecast - by Propulsion Type
- 10.1.1. Pedal Assisted
- 10.1.2. Speed Pedelec
- 10.1.3. Throttle Assisted
- 10.2. Market Analysis, Insights and Forecast - by Application Type
- 10.2.1. Cargo/Utility
- 10.2.2. City/Urban
- 10.2.3. Trekking
- 10.3. Market Analysis, Insights and Forecast - by Battery Type
- 10.3.1. Lead Acid Battery
- 10.3.2. Lithium-ion Battery
- 10.3.3. Others
- 10.1. Market Analysis, Insights and Forecast - by Propulsion Type
- 11. England Electric Bicycle in UK Industry Analysis, Insights and Forecast, 2019-2031
- 12. Wales Electric Bicycle in UK Industry Analysis, Insights and Forecast, 2019-2031
- 13. Scotland Electric Bicycle in UK Industry Analysis, Insights and Forecast, 2019-2031
- 14. Northern Electric Bicycle in UK Industry Analysis, Insights and Forecast, 2019-2031
- 15. Ireland Electric Bicycle in UK Industry Analysis, Insights and Forecast, 2019-2031
- 16. Competitive Analysis
- 16.1. Global Market Share Analysis 2024
- 16.2. Company Profiles
- 16.2.1 Gocycle Eu BV
- 16.2.1.1. Overview
- 16.2.1.2. Products
- 16.2.1.3. SWOT Analysis
- 16.2.1.4. Recent Developments
- 16.2.1.5. Financials (Based on Availability)
- 16.2.2 Volt Electric Bike
- 16.2.2.1. Overview
- 16.2.2.2. Products
- 16.2.2.3. SWOT Analysis
- 16.2.2.4. Recent Developments
- 16.2.2.5. Financials (Based on Availability)
- 16.2.3 Brompton Bicycle Ltd
- 16.2.3.1. Overview
- 16.2.3.2. Products
- 16.2.3.3. SWOT Analysis
- 16.2.3.4. Recent Developments
- 16.2.3.5. Financials (Based on Availability)
- 16.2.4 Evans Cycles Limited (Pinnacle)
- 16.2.4.1. Overview
- 16.2.4.2. Products
- 16.2.4.3. SWOT Analysis
- 16.2.4.4. Recent Developments
- 16.2.4.5. Financials (Based on Availability)
- 16.2.5 MHW Bike-House GmbH (Cube Bikes)
- 16.2.5.1. Overview
- 16.2.5.2. Products
- 16.2.5.3. SWOT Analysis
- 16.2.5.4. Recent Developments
- 16.2.5.5. Financials (Based on Availability)
- 16.2.6 Raleigh Bicycle Company
- 16.2.6.1. Overview
- 16.2.6.2. Products
- 16.2.6.3. SWOT Analysis
- 16.2.6.4. Recent Developments
- 16.2.6.5. Financials (Based on Availability)
- 16.2.7 Tandem Group Cycles (Falcon Cycles)
- 16.2.7.1. Overview
- 16.2.7.2. Products
- 16.2.7.3. SWOT Analysis
- 16.2.7.4. Recent Developments
- 16.2.7.5. Financials (Based on Availability)
- 16.2.8 Giant Manufacturing Co Ltd
- 16.2.8.1. Overview
- 16.2.8.2. Products
- 16.2.8.3. SWOT Analysis
- 16.2.8.4. Recent Developments
- 16.2.8.5. Financials (Based on Availability)
- 16.2.9 POWABYKE UK LIMITED (Powabyke)
- 16.2.9.1. Overview
- 16.2.9.2. Products
- 16.2.9.3. SWOT Analysis
- 16.2.9.4. Recent Developments
- 16.2.9.5. Financials (Based on Availability)
- 16.2.10 Trek Bicycle Corporation
- 16.2.10.1. Overview
- 16.2.10.2. Products
- 16.2.10.3. SWOT Analysis
- 16.2.10.4. Recent Developments
- 16.2.10.5. Financials (Based on Availability)
- 16.2.11 Tandem Group Cycles (DAWES)
- 16.2.11.1. Overview
- 16.2.11.2. Products
- 16.2.11.3. SWOT Analysis
- 16.2.11.4. Recent Developments
- 16.2.11.5. Financials (Based on Availability)
- 16.2.1 Gocycle Eu BV
List of Figures
- Figure 1: Global Electric Bicycle in UK Industry Revenue Breakdown (Million, %) by Region 2024 & 2032
- Figure 2: United kingdom Region Electric Bicycle in UK Industry Revenue (Million), by Country 2024 & 2032
- Figure 3: United kingdom Region Electric Bicycle in UK Industry Revenue Share (%), by Country 2024 & 2032
- Figure 4: North America Electric Bicycle in UK Industry Revenue (Million), by Propulsion Type 2024 & 2032
- Figure 5: North America Electric Bicycle in UK Industry Revenue Share (%), by Propulsion Type 2024 & 2032
- Figure 6: North America Electric Bicycle in UK Industry Revenue (Million), by Application Type 2024 & 2032
- Figure 7: North America Electric Bicycle in UK Industry Revenue Share (%), by Application Type 2024 & 2032
- Figure 8: North America Electric Bicycle in UK Industry Revenue (Million), by Battery Type 2024 & 2032
- Figure 9: North America Electric Bicycle in UK Industry Revenue Share (%), by Battery Type 2024 & 2032
- Figure 10: North America Electric Bicycle in UK Industry Revenue (Million), by Country 2024 & 2032
- Figure 11: North America Electric Bicycle in UK Industry Revenue Share (%), by Country 2024 & 2032
- Figure 12: South America Electric Bicycle in UK Industry Revenue (Million), by Propulsion Type 2024 & 2032
- Figure 13: South America Electric Bicycle in UK Industry Revenue Share (%), by Propulsion Type 2024 & 2032
- Figure 14: South America Electric Bicycle in UK Industry Revenue (Million), by Application Type 2024 & 2032
- Figure 15: South America Electric Bicycle in UK Industry Revenue Share (%), by Application Type 2024 & 2032
- Figure 16: South America Electric Bicycle in UK Industry Revenue (Million), by Battery Type 2024 & 2032
- Figure 17: South America Electric Bicycle in UK Industry Revenue Share (%), by Battery Type 2024 & 2032
- Figure 18: South America Electric Bicycle in UK Industry Revenue (Million), by Country 2024 & 2032
- Figure 19: South America Electric Bicycle in UK Industry Revenue Share (%), by Country 2024 & 2032
- Figure 20: Europe Electric Bicycle in UK Industry Revenue (Million), by Propulsion Type 2024 & 2032
- Figure 21: Europe Electric Bicycle in UK Industry Revenue Share (%), by Propulsion Type 2024 & 2032
- Figure 22: Europe Electric Bicycle in UK Industry Revenue (Million), by Application Type 2024 & 2032
- Figure 23: Europe Electric Bicycle in UK Industry Revenue Share (%), by Application Type 2024 & 2032
- Figure 24: Europe Electric Bicycle in UK Industry Revenue (Million), by Battery Type 2024 & 2032
- Figure 25: Europe Electric Bicycle in UK Industry Revenue Share (%), by Battery Type 2024 & 2032
- Figure 26: Europe Electric Bicycle in UK Industry Revenue (Million), by Country 2024 & 2032
- Figure 27: Europe Electric Bicycle in UK Industry Revenue Share (%), by Country 2024 & 2032
- Figure 28: Middle East & Africa Electric Bicycle in UK Industry Revenue (Million), by Propulsion Type 2024 & 2032
- Figure 29: Middle East & Africa Electric Bicycle in UK Industry Revenue Share (%), by Propulsion Type 2024 & 2032
- Figure 30: Middle East & Africa Electric Bicycle in UK Industry Revenue (Million), by Application Type 2024 & 2032
- Figure 31: Middle East & Africa Electric Bicycle in UK Industry Revenue Share (%), by Application Type 2024 & 2032
- Figure 32: Middle East & Africa Electric Bicycle in UK Industry Revenue (Million), by Battery Type 2024 & 2032
- Figure 33: Middle East & Africa Electric Bicycle in UK Industry Revenue Share (%), by Battery Type 2024 & 2032
- Figure 34: Middle East & Africa Electric Bicycle in UK Industry Revenue (Million), by Country 2024 & 2032
- Figure 35: Middle East & Africa Electric Bicycle in UK Industry Revenue Share (%), by Country 2024 & 2032
- Figure 36: Asia Pacific Electric Bicycle in UK Industry Revenue (Million), by Propulsion Type 2024 & 2032
- Figure 37: Asia Pacific Electric Bicycle in UK Industry Revenue Share (%), by Propulsion Type 2024 & 2032
- Figure 38: Asia Pacific Electric Bicycle in UK Industry Revenue (Million), by Application Type 2024 & 2032
- Figure 39: Asia Pacific Electric Bicycle in UK Industry Revenue Share (%), by Application Type 2024 & 2032
- Figure 40: Asia Pacific Electric Bicycle in UK Industry Revenue (Million), by Battery Type 2024 & 2032
- Figure 41: Asia Pacific Electric Bicycle in UK Industry Revenue Share (%), by Battery Type 2024 & 2032
- Figure 42: Asia Pacific Electric Bicycle in UK Industry Revenue (Million), by Country 2024 & 2032
- Figure 43: Asia Pacific Electric Bicycle in UK Industry Revenue Share (%), by Country 2024 & 2032
List of Tables
- Table 1: Global Electric Bicycle in UK Industry Revenue Million Forecast, by Region 2019 & 2032
- Table 2: Global Electric Bicycle in UK Industry Revenue Million Forecast, by Propulsion Type 2019 & 2032
- Table 3: Global Electric Bicycle in UK Industry Revenue Million Forecast, by Application Type 2019 & 2032
- Table 4: Global Electric Bicycle in UK Industry Revenue Million Forecast, by Battery Type 2019 & 2032
- Table 5: Global Electric Bicycle in UK Industry Revenue Million Forecast, by Region 2019 & 2032
- Table 6: Global Electric Bicycle in UK Industry Revenue Million Forecast, by Country 2019 & 2032
- Table 7: England Electric Bicycle in UK Industry Revenue (Million) Forecast, by Application 2019 & 2032
- Table 8: Wales Electric Bicycle in UK Industry Revenue (Million) Forecast, by Application 2019 & 2032
- Table 9: Scotland Electric Bicycle in UK Industry Revenue (Million) Forecast, by Application 2019 & 2032
- Table 10: Northern Electric Bicycle in UK Industry Revenue (Million) Forecast, by Application 2019 & 2032
- Table 11: Ireland Electric Bicycle in UK Industry Revenue (Million) Forecast, by Application 2019 & 2032
- Table 12: Global Electric Bicycle in UK Industry Revenue Million Forecast, by Propulsion Type 2019 & 2032
- Table 13: Global Electric Bicycle in UK Industry Revenue Million Forecast, by Application Type 2019 & 2032
- Table 14: Global Electric Bicycle in UK Industry Revenue Million Forecast, by Battery Type 2019 & 2032
- Table 15: Global Electric Bicycle in UK Industry Revenue Million Forecast, by Country 2019 & 2032
- Table 16: United States Electric Bicycle in UK Industry Revenue (Million) Forecast, by Application 2019 & 2032
- Table 17: Canada Electric Bicycle in UK Industry Revenue (Million) Forecast, by Application 2019 & 2032
- Table 18: Mexico Electric Bicycle in UK Industry Revenue (Million) Forecast, by Application 2019 & 2032
- Table 19: Global Electric Bicycle in UK Industry Revenue Million Forecast, by Propulsion Type 2019 & 2032
- Table 20: Global Electric Bicycle in UK Industry Revenue Million Forecast, by Application Type 2019 & 2032
- Table 21: Global Electric Bicycle in UK Industry Revenue Million Forecast, by Battery Type 2019 & 2032
- Table 22: Global Electric Bicycle in UK Industry Revenue Million Forecast, by Country 2019 & 2032
- Table 23: Brazil Electric Bicycle in UK Industry Revenue (Million) Forecast, by Application 2019 & 2032
- Table 24: Argentina Electric Bicycle in UK Industry Revenue (Million) Forecast, by Application 2019 & 2032
- Table 25: Rest of South America Electric Bicycle in UK Industry Revenue (Million) Forecast, by Application 2019 & 2032
- Table 26: Global Electric Bicycle in UK Industry Revenue Million Forecast, by Propulsion Type 2019 & 2032
- Table 27: Global Electric Bicycle in UK Industry Revenue Million Forecast, by Application Type 2019 & 2032
- Table 28: Global Electric Bicycle in UK Industry Revenue Million Forecast, by Battery Type 2019 & 2032
- Table 29: Global Electric Bicycle in UK Industry Revenue Million Forecast, by Country 2019 & 2032
- Table 30: United Kingdom Electric Bicycle in UK Industry Revenue (Million) Forecast, by Application 2019 & 2032
- Table 31: Germany Electric Bicycle in UK Industry Revenue (Million) Forecast, by Application 2019 & 2032
- Table 32: France Electric Bicycle in UK Industry Revenue (Million) Forecast, by Application 2019 & 2032
- Table 33: Italy Electric Bicycle in UK Industry Revenue (Million) Forecast, by Application 2019 & 2032
- Table 34: Spain Electric Bicycle in UK Industry Revenue (Million) Forecast, by Application 2019 & 2032
- Table 35: Russia Electric Bicycle in UK Industry Revenue (Million) Forecast, by Application 2019 & 2032
- Table 36: Benelux Electric Bicycle in UK Industry Revenue (Million) Forecast, by Application 2019 & 2032
- Table 37: Nordics Electric Bicycle in UK Industry Revenue (Million) Forecast, by Application 2019 & 2032
- Table 38: Rest of Europe Electric Bicycle in UK Industry Revenue (Million) Forecast, by Application 2019 & 2032
- Table 39: Global Electric Bicycle in UK Industry Revenue Million Forecast, by Propulsion Type 2019 & 2032
- Table 40: Global Electric Bicycle in UK Industry Revenue Million Forecast, by Application Type 2019 & 2032
- Table 41: Global Electric Bicycle in UK Industry Revenue Million Forecast, by Battery Type 2019 & 2032
- Table 42: Global Electric Bicycle in UK Industry Revenue Million Forecast, by Country 2019 & 2032
- Table 43: Turkey Electric Bicycle in UK Industry Revenue (Million) Forecast, by Application 2019 & 2032
- Table 44: Israel Electric Bicycle in UK Industry Revenue (Million) Forecast, by Application 2019 & 2032
- Table 45: GCC Electric Bicycle in UK Industry Revenue (Million) Forecast, by Application 2019 & 2032
- Table 46: North Africa Electric Bicycle in UK Industry Revenue (Million) Forecast, by Application 2019 & 2032
- Table 47: South Africa Electric Bicycle in UK Industry Revenue (Million) Forecast, by Application 2019 & 2032
- Table 48: Rest of Middle East & Africa Electric Bicycle in UK Industry Revenue (Million) Forecast, by Application 2019 & 2032
- Table 49: Global Electric Bicycle in UK Industry Revenue Million Forecast, by Propulsion Type 2019 & 2032
- Table 50: Global Electric Bicycle in UK Industry Revenue Million Forecast, by Application Type 2019 & 2032
- Table 51: Global Electric Bicycle in UK Industry Revenue Million Forecast, by Battery Type 2019 & 2032
- Table 52: Global Electric Bicycle in UK Industry Revenue Million Forecast, by Country 2019 & 2032
- Table 53: China Electric Bicycle in UK Industry Revenue (Million) Forecast, by Application 2019 & 2032
- Table 54: India Electric Bicycle in UK Industry Revenue (Million) Forecast, by Application 2019 & 2032
- Table 55: Japan Electric Bicycle in UK Industry Revenue (Million) Forecast, by Application 2019 & 2032
- Table 56: South Korea Electric Bicycle in UK Industry Revenue (Million) Forecast, by Application 2019 & 2032
- Table 57: ASEAN Electric Bicycle in UK Industry Revenue (Million) Forecast, by Application 2019 & 2032
- Table 58: Oceania Electric Bicycle in UK Industry Revenue (Million) Forecast, by Application 2019 & 2032
- Table 59: Rest of Asia Pacific Electric Bicycle in UK Industry Revenue (Million) Forecast, by Application 2019 & 2032
Frequently Asked Questions
1. What is the projected Compound Annual Growth Rate (CAGR) of the Electric Bicycle in UK Industry?
The projected CAGR is approximately > 5.00%.
2. Which companies are prominent players in the Electric Bicycle in UK Industry?
Key companies in the market include Gocycle Eu BV, Volt Electric Bike, Brompton Bicycle Ltd, Evans Cycles Limited (Pinnacle), MHW Bike-House GmbH (Cube Bikes), Raleigh Bicycle Company, Tandem Group Cycles (Falcon Cycles), Giant Manufacturing Co Ltd, POWABYKE UK LIMITED (Powabyke), Trek Bicycle Corporation, Tandem Group Cycles (DAWES).
3. What are the main segments of the Electric Bicycle in UK Industry?
The market segments include Propulsion Type, Application Type, Battery Type.
4. Can you provide details about the market size?
The market size is estimated to be USD XX Million as of 2022.
5. What are some drivers contributing to market growth?
The Growth of The Global Automotive Turbocharger Market.
6. What are the notable trends driving market growth?
OTHER KEY INDUSTRY TRENDS COVERED IN THE REPORT.
7. Are there any restraints impacting market growth?
Increasing Complexity of Modern Vehicles.
8. Can you provide examples of recent developments in the market?
December 2022: Volt Bikes and City AM collaborate for the Launch of an ESG-Focused Project. Impact AM is a brand-new division of City AM that specializes in environmental, social, and governance issues.November 2022: The Tandem Group opens eMobility sales and demo showroom, the Launched under the Electric Life banner the space will be found in Birmingham, located off the M6 in Castle Vale.November 2022: The Stormguard E+, a full-suspension e-bike, is unveiled by Giant. The bicycles will be available for purchase in Europe in 2023 and will cost 7,999 Euros for the E+1 and 6,499 Euros for the E+2.
9. What pricing options are available for accessing the report?
Pricing options include single-user, multi-user, and enterprise licenses priced at USD 3800, USD 4500, and USD 5800 respectively.
10. Is the market size provided in terms of value or volume?
The market size is provided in terms of value, measured in Million.
11. Are there any specific market keywords associated with the report?
Yes, the market keyword associated with the report is "Electric Bicycle in UK Industry," which aids in identifying and referencing the specific market segment covered.
12. How do I determine which pricing option suits my needs best?
The pricing options vary based on user requirements and access needs. Individual users may opt for single-user licenses, while businesses requiring broader access may choose multi-user or enterprise licenses for cost-effective access to the report.
13. Are there any additional resources or data provided in the Electric Bicycle in UK Industry report?
While the report offers comprehensive insights, it's advisable to review the specific contents or supplementary materials provided to ascertain if additional resources or data are available.
14. How can I stay updated on further developments or reports in the Electric Bicycle in UK Industry?
To stay informed about further developments, trends, and reports in the Electric Bicycle in UK Industry, consider subscribing to industry newsletters, following relevant companies and organizations, or regularly checking reputable industry news sources and publications.
Methodology
Step 1 - Identification of Relevant Samples Size from Population Database


Step 2 - Approaches for Defining Global Market Size (Value, Volume* & Price*)

Note*: In applicable scenarios
Step 3 - Data Sources
Primary Research
- Web Analytics
- Survey Reports
- Research Institute
- Latest Research Reports
- Opinion Leaders
Secondary Research
- Annual Reports
- White Paper
- Latest Press Release
- Industry Association
- Paid Database
- Investor Presentations

Step 4 - Data Triangulation
Involves using different sources of information in order to increase the validity of a study
These sources are likely to be stakeholders in a program - participants, other researchers, program staff, other community members, and so on.
Then we put all data in single framework & apply various statistical tools to find out the dynamic on the market.
During the analysis stage, feedback from the stakeholder groups would be compared to determine areas of agreement as well as areas of divergence


