

Key Insights
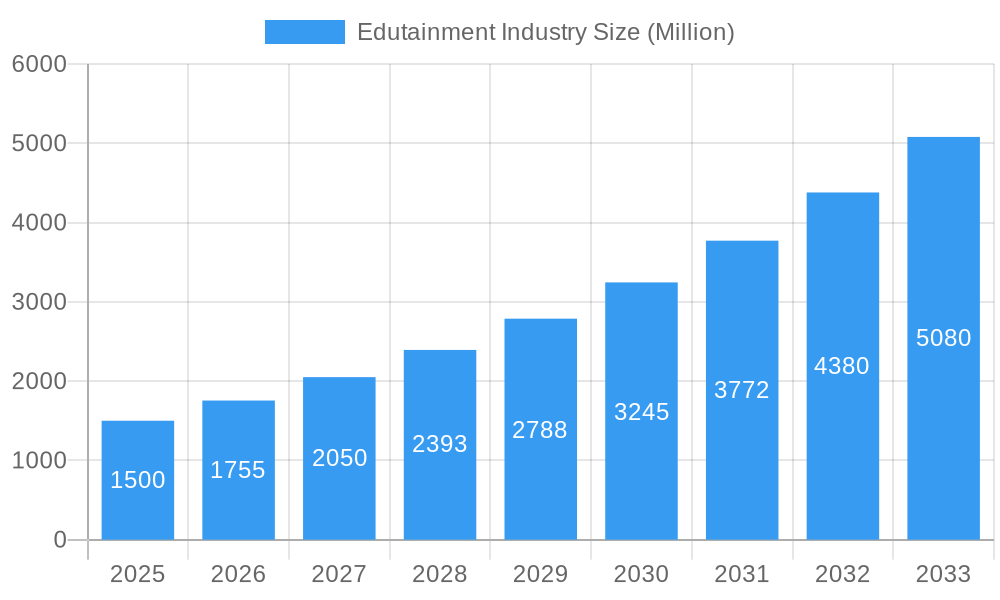
The global edutainment market is poised for substantial expansion, driven by robust demand and strategic industry evolution. Projected to reach a market size of $3 billion by 2025, with a compelling CAGR of 16.1%, this sector is characterized by increasing disposable incomes, a heightened focus on experiential learning, and the pervasive integration of technology in education. Parents are actively seeking engaging, enrichment-focused activities that foster cognitive development, social skills, and creativity in children. This aligns with a generational shift towards interactive and immersive learning experiences over traditional passive methods.
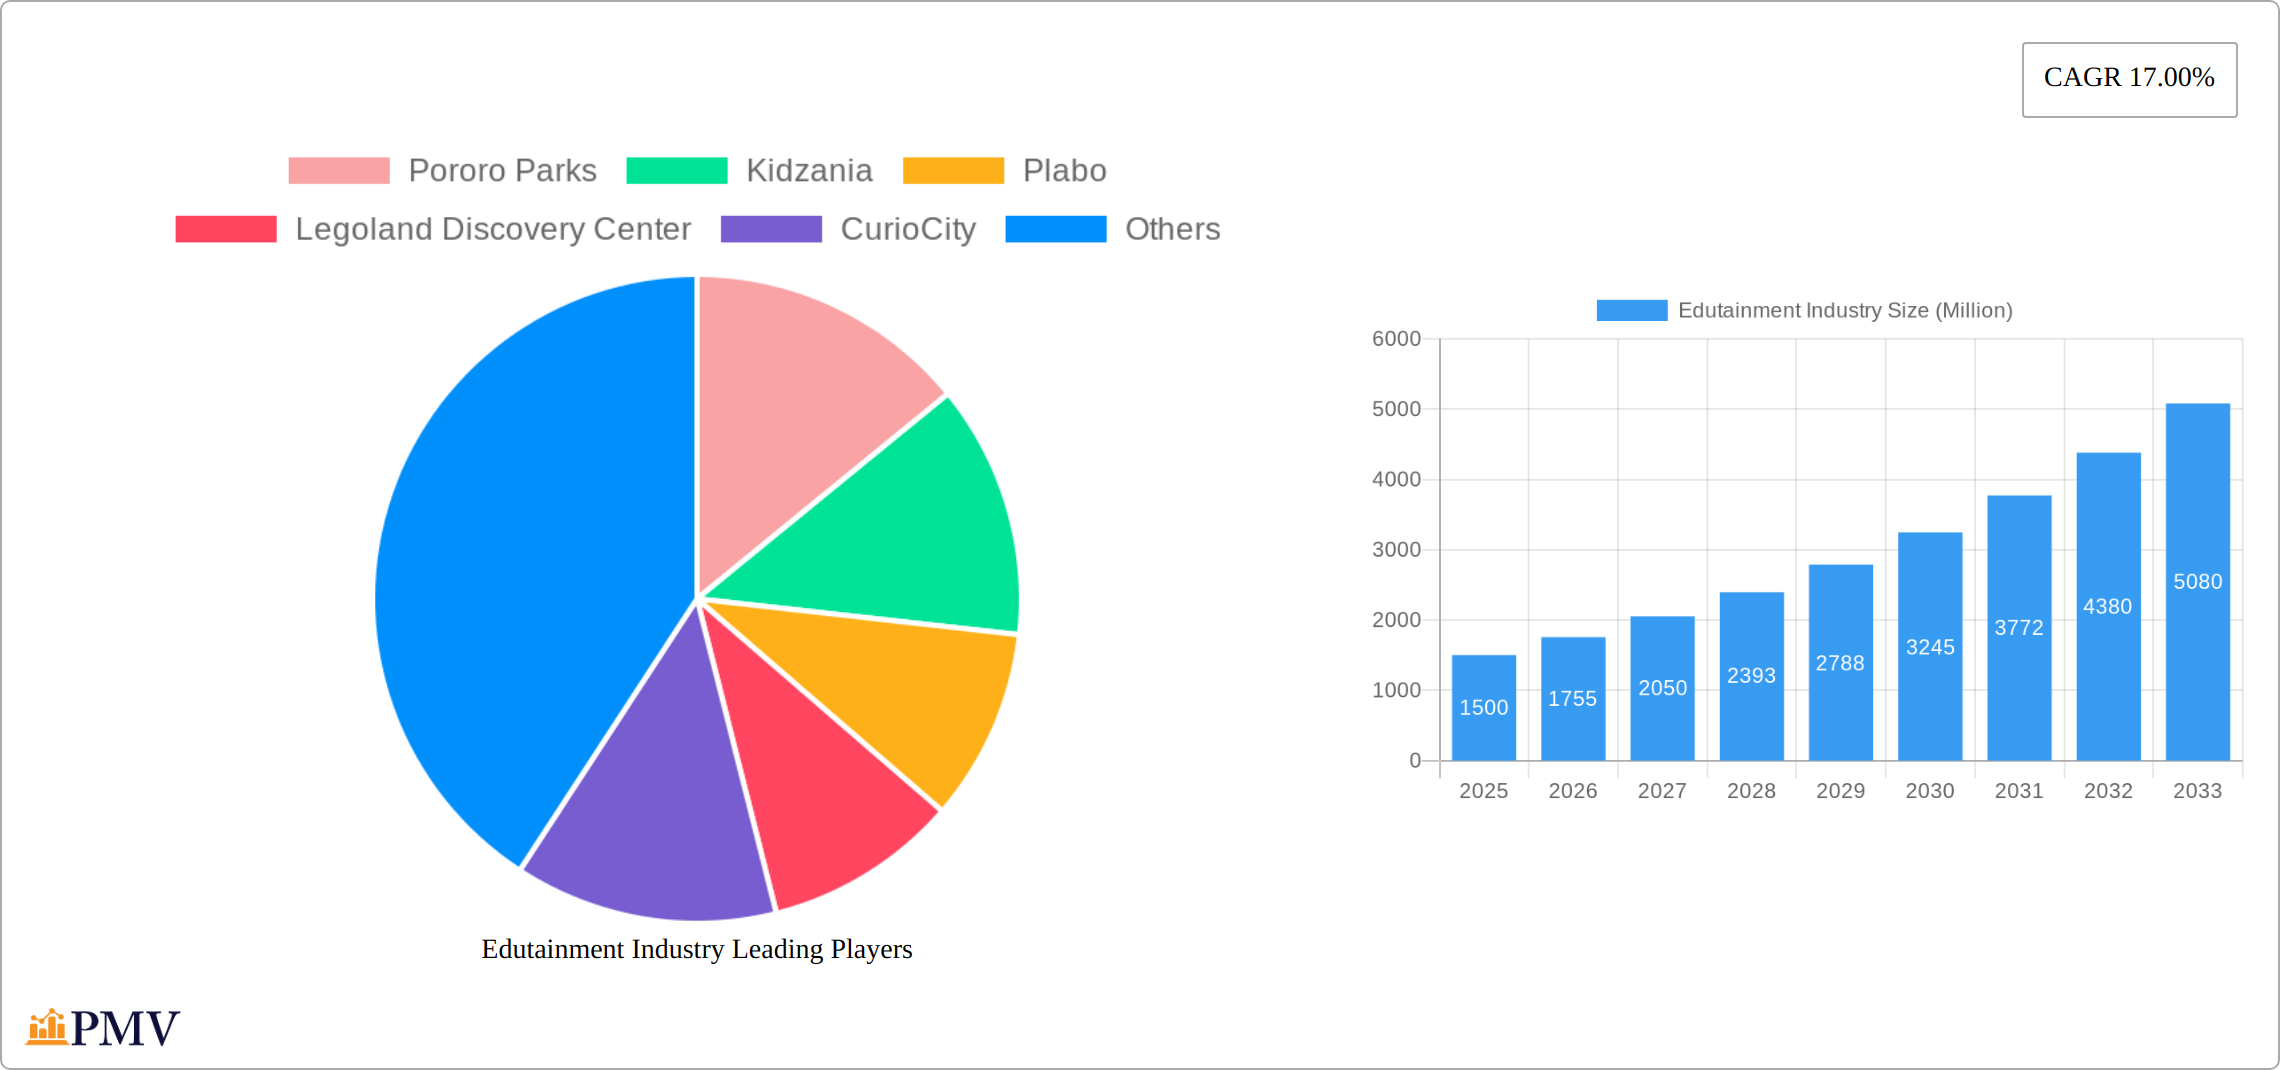
Edutainment Industry Market Size (In Billion)
Segmentation within the edutainment industry spans diverse formats, including theme parks (e.g., Legoland Discovery Center, Pororo Parks), interactive museums (CurioCity, Kidzania), and educational play centers (Mattel Play! Town). This broad appeal to various age groups and learning styles underpins market growth. Challenges include significant initial investment requirements for facility establishment and the inherent cyclicality of consumer spending on recreational pursuits.
Edutainment Industry Company Market Share
Despite these market dynamics, the edutainment sector's future outlook is highly promising. The integration of advanced technologies, such as augmented and virtual reality, is set to revolutionize the learning experience and broaden audience reach. Furthermore, increased collaborations between educational institutions and edutainment providers are accelerating market development. Sustained long-term growth hinges on the industry's agility in adapting to evolving consumer preferences and technological advancements. Intense competition among established leaders like Legoland and Kidzania, alongside emerging startups, necessitates a continued emphasis on developing high-quality, engaging content and delivering superior customer experiences. Innovation and adaptability will be critical for market leadership in this dynamic and growing sector.
Edutainment Industry Market Report: 2019-2033
This comprehensive report provides an in-depth analysis of the global edutainment industry, projecting a market valuation exceeding $XX Million by 2033. The study covers the period 2019-2033, with 2025 as the base and estimated year. This report is essential for investors, industry professionals, and strategic decision-makers seeking to understand the market's structure, trends, and future potential. It features detailed analyses of leading players like Pororo Parks, Kidzania, and Legoland Discovery Center, alongside emerging companies, offering actionable insights and growth projections.
Edutainment Industry Market Structure & Competitive Dynamics
The global edutainment market presents a moderately consolidated structure, with several key players holding substantial market shares. A Herfindahl-Hirschman Index (HHI) analysis reveals a value of xx, suggesting a moderately competitive landscape. This dynamic environment is fueled by a thriving innovation ecosystem, driven by advancements in augmented reality (AR), virtual reality (VR), interactive learning platforms, and sophisticated gamification techniques. Regulatory landscapes vary significantly across different geographical regions, directly impacting market entry strategies and operational procedures. The market faces competitive pressure from substitute products such as traditional educational institutions and established online learning platforms. A notable trend is the increasing consumer preference for experiential learning, significantly boosting the demand for innovative edutainment offerings.
Mergers and acquisitions (M&A) activity has been considerable, with deal values exceeding $XX Million between 2019 and 2024. Significant M&A events include:
- The acquisition of [Company A] by [Company B] in 2022, valued at $XX Million, which significantly altered the competitive landscape and expanded market reach for [Company B].
- A strategic partnership formed between [Company C] and [Company D] in 2023, creating synergies and potentially leading to future collaborative product development and market expansion.
Appendix A provides a detailed breakdown of market share data for key players, highlighting the leadership of [Name of top company] which commanded a xx% market share in 2024. This dominance reflects their successful strategies in product innovation and market penetration.
Edutainment Industry Industry Trends & Insights
The global edutainment market is experiencing robust growth, propelled by several key factors: rising disposable incomes, a growing preference for experiential learning, and continuous advancements in technology. The market is projected to maintain a Compound Annual Growth Rate (CAGR) of xx% throughout the forecast period (2025-2033), exceeding $XX Million by 2033. Technological disruptions, particularly the integration of augmented reality (AR) and virtual reality (VR) technologies, are transforming the edutainment landscape. These technologies provide immersive and interactive learning experiences, fundamentally changing how educational content is delivered and consumed.
Consumer preferences are shifting towards personalized and engaging learning content. This trend presents significant opportunities for the development and delivery of customized edutainment solutions catering to specific learning styles and needs. The competitive dynamics are marked by intense competition among established players and the emergence of innovative startups, stimulating product diversification and service enhancements. Market penetration of edutainment services is steadily increasing, notably in developing economies, with an estimated xx% penetration rate in 2024, suggesting substantial untapped potential.
Dominant Markets & Segments in Edutainment Industry
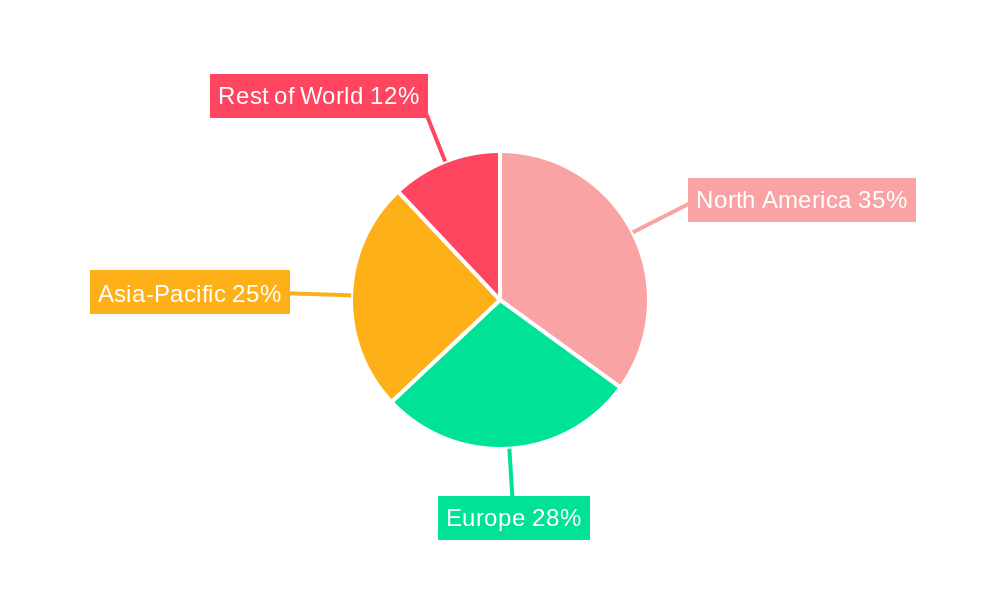
The Asia-Pacific region currently holds the largest market share in the global edutainment industry. This dominance is attributed to several factors: a large and rapidly growing population, rising disposable incomes, and increasing government support for educational initiatives and tourism.
- Key Drivers in Asia-Pacific:
- Rapid urbanization and the expansion of the middle-class population creating a larger consumer base.
- Favorable government policies supporting the education sector and promoting tourism, fostering a supportive regulatory environment.
- Significant investments in infrastructure development, improving access to edutainment services and experiences.
A detailed analysis reveals that China and India are the leading national markets within the Asia-Pacific region, contributing a combined xx% to the global market share. The strong presence of major edutainment players and the high adoption rate of innovative technologies further strengthen the Asia-Pacific region's dominance. Other regional markets, such as North America and Europe, are also exhibiting robust growth, driven by increasing demand for interactive and engaging learning experiences across various age demographics.
Edutainment Industry Product Innovations
Recent product innovations in the edutainment sector are revolutionizing the learning experience. Key advancements include the integration of AI-powered personalized learning platforms, the development of immersive VR/AR experiences, and the creation of interactive exhibits that seamlessly blend education and entertainment. These innovations provide significant competitive advantages by enhancing engagement, personalizing learning pathways, and creating memorable and effective learning experiences. The market demonstrates strong receptiveness to these innovations, driven by the increasing demand for engaging and effective educational tools and the widespread adoption of technology across diverse age groups.
Report Segmentation & Scope
This report segments the edutainment market based on several key parameters to provide a comprehensive understanding of the market landscape:
- By Product Type: Interactive exhibits, theme parks, educational games, virtual reality experiences, mobile applications, and other innovative formats. Each segment presents unique growth trajectories and competitive dynamics. For instance, the VR experience segment is poised for substantial growth, with a projected CAGR of xx% during the forecast period, reaching a market size of $XX Million by 2033.
- By Age Group: Preschool, K-12, and adult learners. The K-12 segment is anticipated to maintain its dominance due to the significant demand for enhanced learning experiences within this demographic.
- By Geography: North America, Europe, Asia-Pacific, Middle East & Africa, and South America, allowing for a regional-specific analysis of market trends and opportunities.
Key Drivers of Edutainment Industry Growth
Several factors contribute to the growth of the edutainment industry. Technological advancements, such as VR/AR and AI, are enhancing the learning experience, making it more engaging and effective. The rising disposable incomes of families worldwide are enabling greater spending on recreational and educational activities. Governments in various regions are actively promoting STEM education and experiential learning, fostering industry growth. Lastly, increasing awareness of the importance of early childhood development fuels the demand for quality edutainment products and services.
Challenges in the Edutainment Industry Sector
The edutainment industry faces several challenges, including the high cost of developing and maintaining innovative products and services. Regulatory hurdles and compliance requirements vary across different regions, potentially hindering market entry. Supply chain disruptions and fluctuations in raw material prices can affect the profitability of businesses. Intense competition among existing players and emerging companies puts pressure on margins and profitability. For example, increased competition led to a xx% reduction in average revenue per user (ARPU) for some companies in 2024.
Leading Players in the Edutainment Industry Market
- Pororo Parks
- Kidzania
- Plabo
- Legoland Discovery Center
- CurioCity
- Kindercity
- Mattel Play! Town
- Totter's Otterville
- Kidz Holding S A L
- Little Explorers
- ConveGenius
- Grey Sim
- Edsys
- IdeaCrate Edutainment Company
- DreamUs Edutainment
Key Developments in Edutainment Industry Sector
- January 2023: Launch of a new AR-based edutainment app by [Company Name].
- March 2024: Partnership between [Company A] and [Company B] to develop a new interactive exhibit.
- June 2024: Acquisition of [Company C] by [Company D] for $XX Million.
Strategic Edutainment Industry Market Outlook
The edutainment industry is poised for significant growth in the coming years. The increasing adoption of innovative technologies, coupled with the rising demand for personalized and engaging learning experiences, presents lucrative opportunities for market players. Strategic alliances, product diversification, and expansion into new markets will be crucial for achieving sustained growth. Focus on creating high-quality, engaging content that caters to diverse learning styles and preferences will be key to success. The industry's future potential is substantial, with projections indicating a market value well exceeding $XX Million by 2033.
Edutainment Industry Segmentation
-
1. product type
- 1.1. Interactive
- 1.2. Non interactive
- 1.3. Hybrid
- 1.4. Explorative
-
2. end use age group
- 2.1. Children
- 2.2. Teenagers
- 2.3. Young Adult
-
3. region/ country
- 3.1. United States of America
- 3.2. Europe
- 3.3. China
- 3.4. Japan
- 3.5. South East Asia
- 3.6. India
- 3.7. Central and South America
Edutainment Industry Segmentation By Geography
-
1. North America
- 1.1. United States
- 1.2. Canada
- 1.3. Mexico
-
2. South America
- 2.1. Brazil
- 2.2. Argentina
- 2.3. Rest of South America
-
3. Europe
- 3.1. United Kingdom
- 3.2. Germany
- 3.3. France
- 3.4. Italy
- 3.5. Spain
- 3.6. Russia
- 3.7. Benelux
- 3.8. Nordics
- 3.9. Rest of Europe
-
4. Middle East & Africa
- 4.1. Turkey
- 4.2. Israel
- 4.3. GCC
- 4.4. North Africa
- 4.5. South Africa
- 4.6. Rest of Middle East & Africa
-
5. Asia Pacific
- 5.1. China
- 5.2. India
- 5.3. Japan
- 5.4. South Korea
- 5.5. ASEAN
- 5.6. Oceania
- 5.7. Rest of Asia Pacific
Edutainment Industry Regional Market Share
Geographic Coverage of Edutainment Industry
Edutainment Industry REPORT HIGHLIGHTS
| Aspects | Details |
|---|---|
| Study Period | 2020-2034 |
| Base Year | 2025 |
| Estimated Year | 2026 |
| Forecast Period | 2026-2034 |
| Historical Period | 2020-2025 |
| Growth Rate | CAGR of 16.1% from 2020-2034 |
| Segmentation |
|
Table of Contents
- 1. Introduction
- 1.1. Research Scope
- 1.2. Market Segmentation
- 1.3. Research Objective
- 1.4. Definitions and Assumptions
- 2. Executive Summary
- 2.1. Market Snapshot
- 3. Market Dynamics
- 3.1. Market Drivers
- 3.2. Market Restrains
- 3.3. Market Trends
- 3.4. Market Opportunities
- 4. Market Factor Analysis
- 4.1. Porters Five Forces
- 4.1.1. Bargaining Power of Suppliers
- 4.1.2. Bargaining Power of Buyers
- 4.1.3. Threat of New Entrants
- 4.1.4. Threat of Substitutes
- 4.1.5. Competitive Rivalry
- 4.2. PESTEL analysis
- 4.3. BCG Analysis
- 4.3.1. Stars (High Growth, High Market Share)
- 4.3.2. Cash Cows (Low Growth, High Market Share)
- 4.3.3. Question Mark (High Growth, Low Market Share)
- 4.3.4. Dogs (Low Growth, Low Market Share)
- 4.4. Ansoff Matrix Analysis
- 4.5. Supply Chain Analysis
- 4.6. Regulatory Landscape
- 4.7. Current Market Potential and Opportunity Assessment (TAM–SAM–SOM Framework)
- 4.8. PMV Analyst Note
- 4.1. Porters Five Forces
- 5. Market Analysis, Insights and Forecast 2021-2033
- 5.1. Market Analysis, Insights and Forecast - by product type
- 5.1.1. Interactive
- 5.1.2. Non interactive
- 5.1.3. Hybrid
- 5.1.4. Explorative
- 5.2. Market Analysis, Insights and Forecast - by end use age group
- 5.2.1. Children
- 5.2.2. Teenagers
- 5.2.3. Young Adult
- 5.3. Market Analysis, Insights and Forecast - by region/ country
- 5.3.1. United States of America
- 5.3.2. Europe
- 5.3.3. China
- 5.3.4. Japan
- 5.3.5. South East Asia
- 5.3.6. India
- 5.3.7. Central and South America
- 5.4. Market Analysis, Insights and Forecast - by Region
- 5.4.1. North America
- 5.4.2. South America
- 5.4.3. Europe
- 5.4.4. Middle East & Africa
- 5.4.5. Asia Pacific
- 5.1. Market Analysis, Insights and Forecast - by product type
- 6. Global Edutainment Industry Analysis, Insights and Forecast, 2021-2033
- 6.1. Market Analysis, Insights and Forecast - by product type
- 6.1.1. Interactive
- 6.1.2. Non interactive
- 6.1.3. Hybrid
- 6.1.4. Explorative
- 6.2. Market Analysis, Insights and Forecast - by end use age group
- 6.2.1. Children
- 6.2.2. Teenagers
- 6.2.3. Young Adult
- 6.3. Market Analysis, Insights and Forecast - by region/ country
- 6.3.1. United States of America
- 6.3.2. Europe
- 6.3.3. China
- 6.3.4. Japan
- 6.3.5. South East Asia
- 6.3.6. India
- 6.3.7. Central and South America
- 6.1. Market Analysis, Insights and Forecast - by product type
- 7. North America Edutainment Industry Analysis, Insights and Forecast, 2020-2032
- 7.1. Market Analysis, Insights and Forecast - by product type
- 7.1.1. Interactive
- 7.1.2. Non interactive
- 7.1.3. Hybrid
- 7.1.4. Explorative
- 7.2. Market Analysis, Insights and Forecast - by end use age group
- 7.2.1. Children
- 7.2.2. Teenagers
- 7.2.3. Young Adult
- 7.3. Market Analysis, Insights and Forecast - by region/ country
- 7.3.1. United States of America
- 7.3.2. Europe
- 7.3.3. China
- 7.3.4. Japan
- 7.3.5. South East Asia
- 7.3.6. India
- 7.3.7. Central and South America
- 7.1. Market Analysis, Insights and Forecast - by product type
- 8. South America Edutainment Industry Analysis, Insights and Forecast, 2020-2032
- 8.1. Market Analysis, Insights and Forecast - by product type
- 8.1.1. Interactive
- 8.1.2. Non interactive
- 8.1.3. Hybrid
- 8.1.4. Explorative
- 8.2. Market Analysis, Insights and Forecast - by end use age group
- 8.2.1. Children
- 8.2.2. Teenagers
- 8.2.3. Young Adult
- 8.3. Market Analysis, Insights and Forecast - by region/ country
- 8.3.1. United States of America
- 8.3.2. Europe
- 8.3.3. China
- 8.3.4. Japan
- 8.3.5. South East Asia
- 8.3.6. India
- 8.3.7. Central and South America
- 8.1. Market Analysis, Insights and Forecast - by product type
- 9. Europe Edutainment Industry Analysis, Insights and Forecast, 2020-2032
- 9.1. Market Analysis, Insights and Forecast - by product type
- 9.1.1. Interactive
- 9.1.2. Non interactive
- 9.1.3. Hybrid
- 9.1.4. Explorative
- 9.2. Market Analysis, Insights and Forecast - by end use age group
- 9.2.1. Children
- 9.2.2. Teenagers
- 9.2.3. Young Adult
- 9.3. Market Analysis, Insights and Forecast - by region/ country
- 9.3.1. United States of America
- 9.3.2. Europe
- 9.3.3. China
- 9.3.4. Japan
- 9.3.5. South East Asia
- 9.3.6. India
- 9.3.7. Central and South America
- 9.1. Market Analysis, Insights and Forecast - by product type
- 10. Middle East & Africa Edutainment Industry Analysis, Insights and Forecast, 2020-2032
- 10.1. Market Analysis, Insights and Forecast - by product type
- 10.1.1. Interactive
- 10.1.2. Non interactive
- 10.1.3. Hybrid
- 10.1.4. Explorative
- 10.2. Market Analysis, Insights and Forecast - by end use age group
- 10.2.1. Children
- 10.2.2. Teenagers
- 10.2.3. Young Adult
- 10.3. Market Analysis, Insights and Forecast - by region/ country
- 10.3.1. United States of America
- 10.3.2. Europe
- 10.3.3. China
- 10.3.4. Japan
- 10.3.5. South East Asia
- 10.3.6. India
- 10.3.7. Central and South America
- 10.1. Market Analysis, Insights and Forecast - by product type
- 11. Asia Pacific Edutainment Industry Analysis, Insights and Forecast, 2020-2032
- 11.1. Market Analysis, Insights and Forecast - by product type
- 11.1.1. Interactive
- 11.1.2. Non interactive
- 11.1.3. Hybrid
- 11.1.4. Explorative
- 11.2. Market Analysis, Insights and Forecast - by end use age group
- 11.2.1. Children
- 11.2.2. Teenagers
- 11.2.3. Young Adult
- 11.3. Market Analysis, Insights and Forecast - by region/ country
- 11.3.1. United States of America
- 11.3.2. Europe
- 11.3.3. China
- 11.3.4. Japan
- 11.3.5. South East Asia
- 11.3.6. India
- 11.3.7. Central and South America
- 11.1. Market Analysis, Insights and Forecast - by product type
- 12. Competitive Analysis
- 12.1. Company Profiles
- 12.1.1 Pororo Parks
- 12.1.1.1. Company Overview
- 12.1.1.2. Products
- 12.1.1.3. Company Financials
- 12.1.1.4. SWOT Analysis
- 12.1.2 Kidzania
- 12.1.2.1. Company Overview
- 12.1.2.2. Products
- 12.1.2.3. Company Financials
- 12.1.2.4. SWOT Analysis
- 12.1.3 Plabo
- 12.1.3.1. Company Overview
- 12.1.3.2. Products
- 12.1.3.3. Company Financials
- 12.1.3.4. SWOT Analysis
- 12.1.4 Legoland Discovery Center
- 12.1.4.1. Company Overview
- 12.1.4.2. Products
- 12.1.4.3. Company Financials
- 12.1.4.4. SWOT Analysis
- 12.1.5 CurioCity
- 12.1.5.1. Company Overview
- 12.1.5.2. Products
- 12.1.5.3. Company Financials
- 12.1.5.4. SWOT Analysis
- 12.1.6 Kindercity
- 12.1.6.1. Company Overview
- 12.1.6.2. Products
- 12.1.6.3. Company Financials
- 12.1.6.4. SWOT Analysis
- 12.1.7 Mattel Play! Town
- 12.1.7.1. Company Overview
- 12.1.7.2. Products
- 12.1.7.3. Company Financials
- 12.1.7.4. SWOT Analysis
- 12.1.8 Totter's Otterville
- 12.1.8.1. Company Overview
- 12.1.8.2. Products
- 12.1.8.3. Company Financials
- 12.1.8.4. SWOT Analysis
- 12.1.9 Kidz Holding S A L
- 12.1.9.1. Company Overview
- 12.1.9.2. Products
- 12.1.9.3. Company Financials
- 12.1.9.4. SWOT Analysis
- 12.1.10 Little Explorers
- 12.1.10.1. Company Overview
- 12.1.10.2. Products
- 12.1.10.3. Company Financials
- 12.1.10.4. SWOT Analysis
- 12.1.11 ConveGenius
- 12.1.11.1. Company Overview
- 12.1.11.2. Products
- 12.1.11.3. Company Financials
- 12.1.11.4. SWOT Analysis
- 12.1.12 Grey Sim
- 12.1.12.1. Company Overview
- 12.1.12.2. Products
- 12.1.12.3. Company Financials
- 12.1.12.4. SWOT Analysis
- 12.1.13 Edsys
- 12.1.13.1. Company Overview
- 12.1.13.2. Products
- 12.1.13.3. Company Financials
- 12.1.13.4. SWOT Analysis
- 12.1.14 IdeaCrate Edutainment Company
- 12.1.14.1. Company Overview
- 12.1.14.2. Products
- 12.1.14.3. Company Financials
- 12.1.14.4. SWOT Analysis
- 12.1.15 DreamUs Edutainment*List Not Exhaustive
- 12.1.15.1. Company Overview
- 12.1.15.2. Products
- 12.1.15.3. Company Financials
- 12.1.15.4. SWOT Analysis
- 12.1.1 Pororo Parks
- 12.2. Market Entropy
- 12.2.1 Company's Key Areas Served
- 12.2.2 Recent Developments
- 12.3. Company Market Share Analysis 2025
- 12.3.1 Top 5 Companies Market Share Analysis
- 12.3.2 Top 3 Companies Market Share Analysis
- 12.4. List of Potential Customers
- 13. Research Methodology
List of Figures
- Figure 1: Global Edutainment Industry Revenue Breakdown (billion, %) by Region 2025 & 2033
- Figure 2: North America Edutainment Industry Revenue (billion), by product type 2025 & 2033
- Figure 3: North America Edutainment Industry Revenue Share (%), by product type 2025 & 2033
- Figure 4: North America Edutainment Industry Revenue (billion), by end use age group 2025 & 2033
- Figure 5: North America Edutainment Industry Revenue Share (%), by end use age group 2025 & 2033
- Figure 6: North America Edutainment Industry Revenue (billion), by region/ country 2025 & 2033
- Figure 7: North America Edutainment Industry Revenue Share (%), by region/ country 2025 & 2033
- Figure 8: North America Edutainment Industry Revenue (billion), by Country 2025 & 2033
- Figure 9: North America Edutainment Industry Revenue Share (%), by Country 2025 & 2033
- Figure 10: South America Edutainment Industry Revenue (billion), by product type 2025 & 2033
- Figure 11: South America Edutainment Industry Revenue Share (%), by product type 2025 & 2033
- Figure 12: South America Edutainment Industry Revenue (billion), by end use age group 2025 & 2033
- Figure 13: South America Edutainment Industry Revenue Share (%), by end use age group 2025 & 2033
- Figure 14: South America Edutainment Industry Revenue (billion), by region/ country 2025 & 2033
- Figure 15: South America Edutainment Industry Revenue Share (%), by region/ country 2025 & 2033
- Figure 16: South America Edutainment Industry Revenue (billion), by Country 2025 & 2033
- Figure 17: South America Edutainment Industry Revenue Share (%), by Country 2025 & 2033
- Figure 18: Europe Edutainment Industry Revenue (billion), by product type 2025 & 2033
- Figure 19: Europe Edutainment Industry Revenue Share (%), by product type 2025 & 2033
- Figure 20: Europe Edutainment Industry Revenue (billion), by end use age group 2025 & 2033
- Figure 21: Europe Edutainment Industry Revenue Share (%), by end use age group 2025 & 2033
- Figure 22: Europe Edutainment Industry Revenue (billion), by region/ country 2025 & 2033
- Figure 23: Europe Edutainment Industry Revenue Share (%), by region/ country 2025 & 2033
- Figure 24: Europe Edutainment Industry Revenue (billion), by Country 2025 & 2033
- Figure 25: Europe Edutainment Industry Revenue Share (%), by Country 2025 & 2033
- Figure 26: Middle East & Africa Edutainment Industry Revenue (billion), by product type 2025 & 2033
- Figure 27: Middle East & Africa Edutainment Industry Revenue Share (%), by product type 2025 & 2033
- Figure 28: Middle East & Africa Edutainment Industry Revenue (billion), by end use age group 2025 & 2033
- Figure 29: Middle East & Africa Edutainment Industry Revenue Share (%), by end use age group 2025 & 2033
- Figure 30: Middle East & Africa Edutainment Industry Revenue (billion), by region/ country 2025 & 2033
- Figure 31: Middle East & Africa Edutainment Industry Revenue Share (%), by region/ country 2025 & 2033
- Figure 32: Middle East & Africa Edutainment Industry Revenue (billion), by Country 2025 & 2033
- Figure 33: Middle East & Africa Edutainment Industry Revenue Share (%), by Country 2025 & 2033
- Figure 34: Asia Pacific Edutainment Industry Revenue (billion), by product type 2025 & 2033
- Figure 35: Asia Pacific Edutainment Industry Revenue Share (%), by product type 2025 & 2033
- Figure 36: Asia Pacific Edutainment Industry Revenue (billion), by end use age group 2025 & 2033
- Figure 37: Asia Pacific Edutainment Industry Revenue Share (%), by end use age group 2025 & 2033
- Figure 38: Asia Pacific Edutainment Industry Revenue (billion), by region/ country 2025 & 2033
- Figure 39: Asia Pacific Edutainment Industry Revenue Share (%), by region/ country 2025 & 2033
- Figure 40: Asia Pacific Edutainment Industry Revenue (billion), by Country 2025 & 2033
- Figure 41: Asia Pacific Edutainment Industry Revenue Share (%), by Country 2025 & 2033
List of Tables
- Table 1: Global Edutainment Industry Revenue billion Forecast, by product type 2020 & 2033
- Table 2: Global Edutainment Industry Revenue billion Forecast, by end use age group 2020 & 2033
- Table 3: Global Edutainment Industry Revenue billion Forecast, by region/ country 2020 & 2033
- Table 4: Global Edutainment Industry Revenue billion Forecast, by Region 2020 & 2033
- Table 5: Global Edutainment Industry Revenue billion Forecast, by product type 2020 & 2033
- Table 6: Global Edutainment Industry Revenue billion Forecast, by end use age group 2020 & 2033
- Table 7: Global Edutainment Industry Revenue billion Forecast, by region/ country 2020 & 2033
- Table 8: Global Edutainment Industry Revenue billion Forecast, by Country 2020 & 2033
- Table 9: United States Edutainment Industry Revenue (billion) Forecast, by Application 2020 & 2033
- Table 10: Canada Edutainment Industry Revenue (billion) Forecast, by Application 2020 & 2033
- Table 11: Mexico Edutainment Industry Revenue (billion) Forecast, by Application 2020 & 2033
- Table 12: Global Edutainment Industry Revenue billion Forecast, by product type 2020 & 2033
- Table 13: Global Edutainment Industry Revenue billion Forecast, by end use age group 2020 & 2033
- Table 14: Global Edutainment Industry Revenue billion Forecast, by region/ country 2020 & 2033
- Table 15: Global Edutainment Industry Revenue billion Forecast, by Country 2020 & 2033
- Table 16: Brazil Edutainment Industry Revenue (billion) Forecast, by Application 2020 & 2033
- Table 17: Argentina Edutainment Industry Revenue (billion) Forecast, by Application 2020 & 2033
- Table 18: Rest of South America Edutainment Industry Revenue (billion) Forecast, by Application 2020 & 2033
- Table 19: Global Edutainment Industry Revenue billion Forecast, by product type 2020 & 2033
- Table 20: Global Edutainment Industry Revenue billion Forecast, by end use age group 2020 & 2033
- Table 21: Global Edutainment Industry Revenue billion Forecast, by region/ country 2020 & 2033
- Table 22: Global Edutainment Industry Revenue billion Forecast, by Country 2020 & 2033
- Table 23: United Kingdom Edutainment Industry Revenue (billion) Forecast, by Application 2020 & 2033
- Table 24: Germany Edutainment Industry Revenue (billion) Forecast, by Application 2020 & 2033
- Table 25: France Edutainment Industry Revenue (billion) Forecast, by Application 2020 & 2033
- Table 26: Italy Edutainment Industry Revenue (billion) Forecast, by Application 2020 & 2033
- Table 27: Spain Edutainment Industry Revenue (billion) Forecast, by Application 2020 & 2033
- Table 28: Russia Edutainment Industry Revenue (billion) Forecast, by Application 2020 & 2033
- Table 29: Benelux Edutainment Industry Revenue (billion) Forecast, by Application 2020 & 2033
- Table 30: Nordics Edutainment Industry Revenue (billion) Forecast, by Application 2020 & 2033
- Table 31: Rest of Europe Edutainment Industry Revenue (billion) Forecast, by Application 2020 & 2033
- Table 32: Global Edutainment Industry Revenue billion Forecast, by product type 2020 & 2033
- Table 33: Global Edutainment Industry Revenue billion Forecast, by end use age group 2020 & 2033
- Table 34: Global Edutainment Industry Revenue billion Forecast, by region/ country 2020 & 2033
- Table 35: Global Edutainment Industry Revenue billion Forecast, by Country 2020 & 2033
- Table 36: Turkey Edutainment Industry Revenue (billion) Forecast, by Application 2020 & 2033
- Table 37: Israel Edutainment Industry Revenue (billion) Forecast, by Application 2020 & 2033
- Table 38: GCC Edutainment Industry Revenue (billion) Forecast, by Application 2020 & 2033
- Table 39: North Africa Edutainment Industry Revenue (billion) Forecast, by Application 2020 & 2033
- Table 40: South Africa Edutainment Industry Revenue (billion) Forecast, by Application 2020 & 2033
- Table 41: Rest of Middle East & Africa Edutainment Industry Revenue (billion) Forecast, by Application 2020 & 2033
- Table 42: Global Edutainment Industry Revenue billion Forecast, by product type 2020 & 2033
- Table 43: Global Edutainment Industry Revenue billion Forecast, by end use age group 2020 & 2033
- Table 44: Global Edutainment Industry Revenue billion Forecast, by region/ country 2020 & 2033
- Table 45: Global Edutainment Industry Revenue billion Forecast, by Country 2020 & 2033
- Table 46: China Edutainment Industry Revenue (billion) Forecast, by Application 2020 & 2033
- Table 47: India Edutainment Industry Revenue (billion) Forecast, by Application 2020 & 2033
- Table 48: Japan Edutainment Industry Revenue (billion) Forecast, by Application 2020 & 2033
- Table 49: South Korea Edutainment Industry Revenue (billion) Forecast, by Application 2020 & 2033
- Table 50: ASEAN Edutainment Industry Revenue (billion) Forecast, by Application 2020 & 2033
- Table 51: Oceania Edutainment Industry Revenue (billion) Forecast, by Application 2020 & 2033
- Table 52: Rest of Asia Pacific Edutainment Industry Revenue (billion) Forecast, by Application 2020 & 2033
Frequently Asked Questions
1. What is the projected Compound Annual Growth Rate (CAGR) of the Edutainment Industry?
The projected CAGR is approximately 16.1%.
2. Which companies are prominent players in the Edutainment Industry?
Key companies in the market include Pororo Parks, Kidzania, Plabo, Legoland Discovery Center, CurioCity, Kindercity, Mattel Play! Town, Totter's Otterville, Kidz Holding S A L, Little Explorers, ConveGenius, Grey Sim, Edsys, IdeaCrate Edutainment Company, DreamUs Edutainment*List Not Exhaustive.
3. What are the main segments of the Edutainment Industry?
The market segments include product type, end use age group, region/ country.
4. Can you provide details about the market size?
The market size is estimated to be USD 3 billion as of 2022.
5. What are some drivers contributing to market growth?
N/A
6. What are the notable trends driving market growth?
Technological Advancement Is Driving Edutech To Newer Heights.
7. Are there any restraints impacting market growth?
N/A
8. Can you provide examples of recent developments in the market?
N/A
9. What pricing options are available for accessing the report?
Pricing options include single-user, multi-user, and enterprise licenses priced at USD 4750, USD 4950, and USD 6800 respectively.
10. Is the market size provided in terms of value or volume?
The market size is provided in terms of value, measured in billion.
11. Are there any specific market keywords associated with the report?
Yes, the market keyword associated with the report is "Edutainment Industry," which aids in identifying and referencing the specific market segment covered.
12. How do I determine which pricing option suits my needs best?
The pricing options vary based on user requirements and access needs. Individual users may opt for single-user licenses, while businesses requiring broader access may choose multi-user or enterprise licenses for cost-effective access to the report.
13. Are there any additional resources or data provided in the Edutainment Industry report?
While the report offers comprehensive insights, it's advisable to review the specific contents or supplementary materials provided to ascertain if additional resources or data are available.
14. How can I stay updated on further developments or reports in the Edutainment Industry?
To stay informed about further developments, trends, and reports in the Edutainment Industry, consider subscribing to industry newsletters, following relevant companies and organizations, or regularly checking reputable industry news sources and publications.
Methodology
Step 1 - Identification of Relevant Samples Size from Population Database


Step 2 - Approaches for Defining Global Market Size (Value, Volume* & Price*)

Note*: In applicable scenarios
Step 3 - Data Sources
Primary Research
- Web Analytics
- Survey Reports
- Research Institute
- Latest Research Reports
- Opinion Leaders
Secondary Research
- Annual Reports
- White Paper
- Latest Press Release
- Industry Association
- Paid Database
- Investor Presentations

Step 4 - Data Triangulation
Involves using different sources of information in order to increase the validity of a study
These sources are likely to be stakeholders in a program - participants, other researchers, program staff, other community members, and so on.
Then we put all data in single framework & apply various statistical tools to find out the dynamic on the market.
During the analysis stage, feedback from the stakeholder groups would be compared to determine areas of agreement as well as areas of divergence