


Key Insights
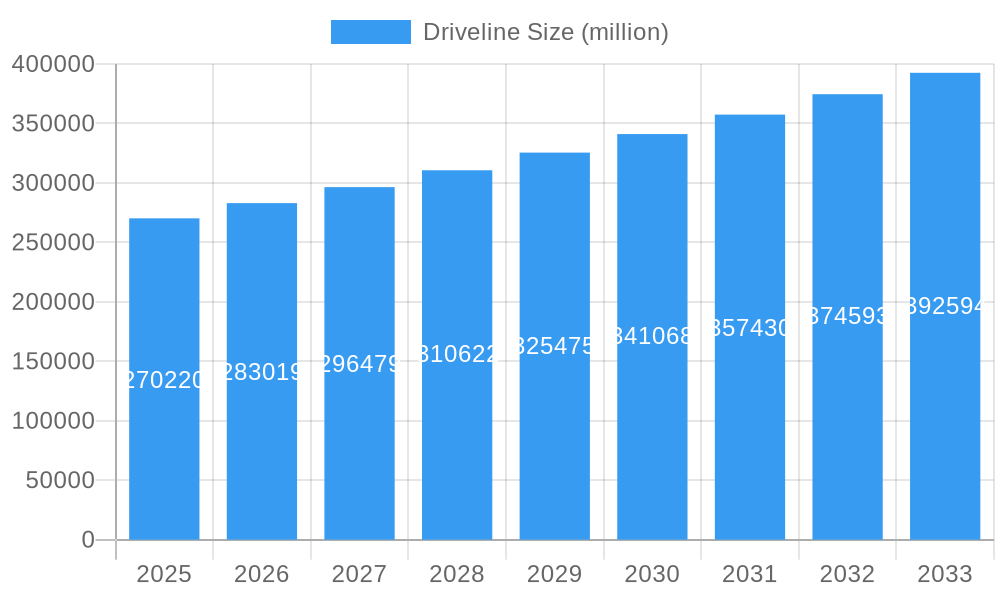
The global driveline market is poised for significant expansion, projected to reach an estimated USD 270,220 million. This growth is underpinned by a robust Compound Annual Growth Rate (CAGR) of 4.8% between 2025 and 2033, indicating sustained demand and innovation within the automotive sector. A key driver for this market surge is the accelerating adoption of electric vehicles (EVs) and the increasing complexity of hybrid powertrains, both of which necessitate advanced and efficient driveline systems. The continuous push towards improved fuel efficiency and reduced emissions across internal combustion engine (ICE) vehicles also fuels the demand for sophisticated driveline technologies. Furthermore, advancements in electric drivelines, including integrated e-axles and advanced transmission systems for EVs, are opening new avenues for market growth. The evolving regulatory landscape, with governments worldwide implementing stricter emissions standards, is another significant factor propelling the market forward as manufacturers invest in cleaner and more efficient driveline solutions.
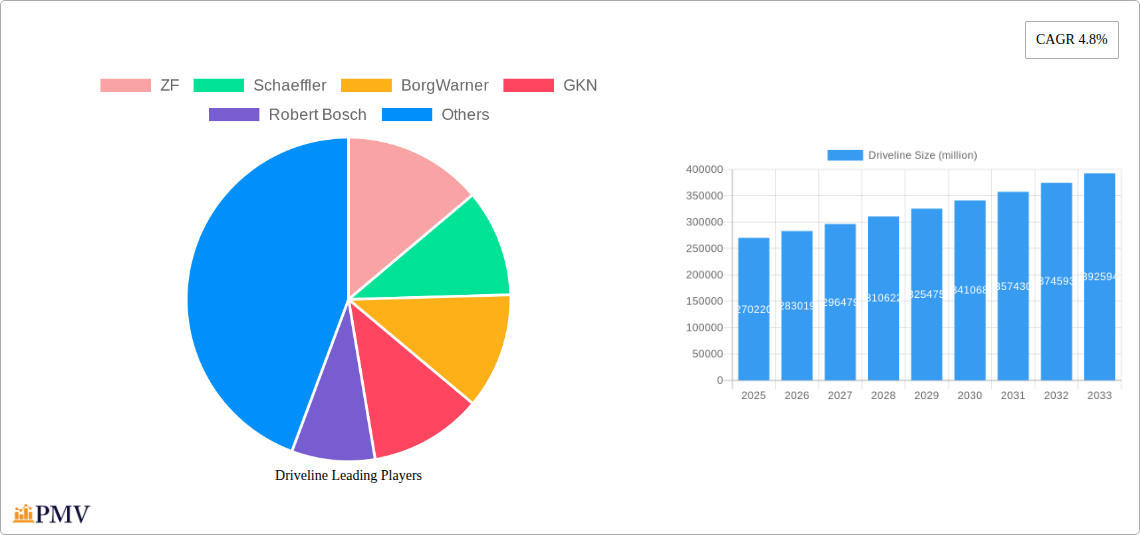
Driveline Market Size (In Billion)

The market is segmented across various power output ranges, including 45-100 kW, 101-250 kW, and above 250 kW, catering to a diverse array of vehicle types from compact cars to heavy-duty trucks. Key driveline types include Series Driveline, Parallel Driveline, Power Split Driveline, and Electric Driveline. The electric driveline segment is expected to witness the most rapid growth, driven by the global EV revolution. Major industry players such as ZF, Schaeffler, BorgWarner, GKN, and Robert Bosch are at the forefront of innovation, investing heavily in research and development to create next-generation driveline technologies. Automotive giants like Volkswagen, Ford Motors, Toyota Motors, and Mahindra & Mahindra are key consumers, integrating these advanced systems into their expanding portfolios of ICE and electric vehicles. Geographically, Asia Pacific, particularly China and India, is anticipated to be a dominant market due to its large automotive manufacturing base and rapidly growing EV adoption. North America and Europe also represent substantial markets, driven by stringent environmental regulations and high consumer demand for advanced automotive technologies.
Driveline Company Market Share
Driveline Market Analysis: Growth, Innovation, and Competitive Landscape (2019-2033)
This comprehensive report offers an in-depth analysis of the global driveline market, covering a detailed study period from 2019 to 2033, with a base year of 2025 and a forecast period from 2025 to 2033. It delves into market dynamics, key trends, competitive strategies, and technological advancements shaping the automotive driveline market, electric vehicle (EV) driveline, and hybrid vehicle driveline sectors. We provide actionable insights for stakeholders, including automotive OEMs, tier-1 suppliers, and technology providers, to navigate the evolving driveline technology landscape and capitalize on emerging opportunities in powertrain solutions.
Driveline Market Structure & Competitive Dynamics
The global driveline market is characterized by moderate to high concentration, with a significant portion of market share held by established players. Innovation ecosystems are thriving, driven by the rapid transition towards electrification and advancements in e-axle technology. Regulatory frameworks, particularly concerning emissions standards and fuel efficiency, are a key influence on product development and market entry. Product substitutes, such as alternative powertrain architectures and advancements in battery technology impacting vehicle range, present a dynamic competitive environment. End-user trends are heavily skewed towards demand for more efficient, sustainable, and performance-oriented driveline components. Merger and acquisition (M&A) activities are prevalent as companies seek to consolidate their market positions, gain access to new technologies, and expand their global footprint. For instance, key players are actively engaging in strategic alliances and acquisitions to enhance their capabilities in electric driveline systems and advanced driveline manufacturing. M&A deal values are projected to reach several million in strategic acquisitions aimed at securing critical intellectual property and manufacturing capacity for next-generation drivelines.
- Market Concentration: Dominated by a mix of large, integrated automotive suppliers and specialized driveline manufacturers.
- Innovation Ecosystems: Driven by R&D in electric motors, power electronics, battery integration, and lightweight materials for driveline manufacturing.
- Regulatory Frameworks: Stringent emission norms and mandates for EV adoption are significant market shapers.
- Product Substitutes: Advancements in battery technology and alternative energy sources influence driveline demand.
- End-User Trends: Growing preference for EVs, improved fuel efficiency, and enhanced driving performance.
- M&A Activities: Strategic acquisitions and partnerships aimed at expanding technological capabilities and market reach in automotive powertrain innovation.
Driveline Industry Trends & Insights
The driveline industry is experiencing robust growth, fueled by several pivotal trends. The accelerating adoption of electric vehicles (EVs) is the primary market growth driver, necessitating the development and widespread implementation of advanced electric drivelines and e-axles. Technological disruptions, including advancements in power split drivelines, series drivelines, and parallel drivelines for hybrid applications, are continuously reshaping the market. Consumer preferences are shifting towards vehicles offering enhanced performance, superior fuel economy, and a reduced environmental footprint, directly impacting demand for efficient driveline solutions. The competitive dynamics are intensifying, with traditional automotive suppliers investing heavily in EV driveline technology and new entrants focusing on innovative solutions. The market is projected to witness a Compound Annual Growth Rate (CAGR) of approximately xx% over the forecast period. Market penetration of electric drivelines is expected to surge, particularly in passenger car segments. The integration of sophisticated driveline control systems and the development of highly efficient driveline components are key areas of focus for manufacturers aiming to capture market share. Furthermore, the evolution of all-wheel-drive (AWD) driveline systems for both ICE and EV platforms remains a significant trend, offering enhanced traction and performance. The increasing sophistication of transmission systems and the ongoing optimization of torque transfer devices are also contributing to market expansion, with a projected market size of over hundreds of million by 2033.
- Market Growth Drivers: Escalating EV adoption, government incentives for clean mobility, rising fuel prices, and increasing consumer awareness regarding environmental sustainability.
- Technological Disruptions: Innovations in e-motor efficiency, power electronics integration, lightweight materials, and advanced driveline cooling systems.
- Consumer Preferences: Demand for better performance, lower running costs, quieter operation, and reduced emissions.
- Competitive Dynamics: Intense R&D, strategic partnerships between OEMs and suppliers, and a focus on cost optimization for driveline production.
Dominant Markets & Segments in Driveline
The driveline market's dominance varies significantly across regions and application segments. North America and Europe are currently leading markets, driven by stringent emission regulations and a high adoption rate of electric and hybrid vehicles. Asia Pacific, particularly China, is emerging as a powerhouse due to substantial government support for EVs and a massive automotive manufacturing base. Within the application segments, the 101 — 250 kW power range is currently dominant, reflecting the widespread demand for mid-range passenger vehicles and SUVs, both conventional and electrified. However, the Above 250 kW segment is projected to witness the fastest growth, propelled by the increasing popularity of performance-oriented EVs and heavy-duty vehicles.
In terms of driveline types, the Electric Driveline segment is experiencing exponential growth, outpacing traditional Series Driveline, Parallel Driveline, and Power Split Driveline technologies in terms of market expansion. This shift is directly attributable to the global transition towards electrification. Key drivers for the dominance of specific regions include favorable economic policies supporting EV manufacturing and adoption, robust charging infrastructure development, and a strong automotive industry presence. For instance, government initiatives in countries like Germany and the United States are crucial for the growth of the EV driveline sector. Economic policies promoting research and development in advanced driveline technologies are also critical. Furthermore, the increasing availability of advanced driveline manufacturing equipment and skilled labor contribute to regional market leadership. The demand for efficient driveline systems in commercial vehicles, particularly for last-mile delivery, is also a significant growth factor. The market for rear-wheel drive (RWD) driveline, front-wheel drive (FWD) driveline, and all-wheel drive (AWD) driveline systems is evolving, with a growing emphasis on electric-based architectures.
- Leading Region: North America and Europe due to strong EV adoption and regulatory mandates.
- Emerging Region: Asia Pacific, driven by China's aggressive EV policies and production capabilities.
- Dominant Application Segment: 101 — 250 kW, serving a broad range of passenger vehicles.
- Fastest Growing Application Segment: Above 250 kW, fueled by performance EVs and electric trucks.
- Dominant Driveline Type: Electric Driveline, capturing significant market share from ICE-based systems.
- Key Drivers for Dominance: Supportive government policies, charging infrastructure, consumer demand for EVs, and technological advancements in electric powertrain solutions.
Driveline Product Innovations
The driveline market is witnessing a surge in product innovations focused on enhancing efficiency, reducing weight, and improving performance, particularly for electrified powertrains. Innovations include integrated e-axles that combine the electric motor, power electronics, and transmission into a single, compact unit, optimizing space and weight. Advanced dual-clutch transmissions (DCTs) and continuously variable transmissions (CVTs) for hybrid vehicles continue to evolve, offering improved fuel economy and driving dynamics. The development of lightweight materials like aluminum alloys and carbon fiber composites for driveline shafts and housings is crucial for improving energy efficiency. Furthermore, the integration of intelligent control systems that optimize torque distribution and gear selection based on driving conditions is a key area of development. These innovations provide significant competitive advantages by offering superior performance, increased range for EVs, and reduced operational costs. The market is seeing a significant push towards modular driveline architectures that can be adapted across various vehicle platforms, increasing manufacturing efficiency and reducing development costs.
Report Segmentation & Scope
This report meticulously segments the global driveline market across critical dimensions to provide granular insights. The segmentation by Application includes: 45 — 100 kW, 101 — 250 kW, and Above 250 kW. The 45 — 100 kW segment caters to smaller passenger cars and compact EVs, with projected growth driven by the increasing demand for urban mobility solutions. The 101 — 250 kW segment, currently dominant, encompasses a wide array of passenger vehicles and is expected to maintain strong growth as the core of the automotive market. The Above 250 kW segment, representing high-performance vehicles and commercial applications, is poised for the most rapid expansion due to the electrification of performance segments and the burgeoning electric truck market. Segmentation by Type includes: Series Driveline, Parallel Driveline, Power Split Driveline, and Electric Driveline. The Electric Driveline segment is the primary growth engine, projected to dominate the market by the end of the forecast period. Series, Parallel, and Power Split Drivelines remain crucial for hybrid applications, with ongoing advancements to improve their efficiency and integration.
- Application Segments:
- 45 — 100 kW: Focus on compact EVs and hybrid vehicles; growth driven by urban mobility.
- 101 — 250 kW: Dominant segment for passenger cars and SUVs; continued steady growth.
- Above 250 kW: High-performance EVs and commercial vehicles; fastest projected growth.
- Driveline Type Segments:
- Series Driveline: Primarily for hybrid applications; steady but moderate growth.
- Parallel Driveline: Also for hybrid applications; evolving with efficiency improvements.
- Power Split Driveline: Key for advanced hybrid systems; sustained demand.
- Electric Driveline: Exponential growth, projected to lead the market; driven by EV adoption.
Key Drivers of Driveline Growth
Several factors are propelling the growth of the driveline market. The accelerating global shift towards electric vehicles (EVs) and the increasing demand for hybrid vehicle drivelines are paramount. Government regulations mandating reduced emissions and promoting sustainable transportation are significant catalysts. Advances in e-mobility technology, including more efficient electric motors and integrated power electronics, are making electric powertrains more viable and attractive. The continuous improvement in battery technology, leading to longer ranges and faster charging times, further bolsters EV adoption and, consequently, the demand for electric drivelines. Economic incentives and subsidies offered by governments worldwide for EV purchases and manufacturing also play a crucial role. Furthermore, the rising global fuel prices make fuel-efficient driveline solutions, both for internal combustion engine (ICE) vehicles and hybrids, increasingly appealing to consumers. The development of advanced driveline control software is also contributing to enhanced performance and efficiency.
- EV Adoption: The primary driver, fueled by technological advancements and consumer interest.
- Emissions Regulations: Stringent government mandates are pushing manufacturers towards cleaner powertrains.
- Technological Advancements: Innovations in e-axles, motor efficiency, and battery integration.
- Government Incentives: Subsidies and tax credits encouraging EV purchases and production.
- Fuel Price Volatility: Increasing fuel costs drive demand for more efficient vehicles.
Challenges in the Driveline Sector
Despite the positive growth trajectory, the driveline sector faces several challenges. The high cost of electric driveline components, particularly batteries and power electronics, remains a significant barrier to widespread adoption, especially in emerging economies. Supply chain disruptions, exacerbated by geopolitical events and the reliance on specific raw materials for battery production, can impact manufacturing timelines and costs. Intense competition among established automotive suppliers and new EV startups leads to price pressures and the need for continuous innovation to maintain market share. Developing and scaling up production capacity for next-generation drivelines requires substantial capital investment. Navigating diverse and evolving regulatory landscapes across different countries adds complexity for global manufacturers. The need for robust and reliable driveline cooling systems to manage heat in high-performance EVs also presents engineering challenges. Furthermore, the integration of advanced driveline software with vehicle systems requires significant expertise and testing.
- High Cost of EV Driveline Components: Affecting affordability for consumers.
- Supply Chain Volatility: Leading to potential production delays and cost fluctuations.
- Intense Competition: Driving price wars and demanding constant innovation.
- Capital Investment: Significant funding required for R&D and manufacturing expansion.
- Evolving Regulatory Landscape: Requiring adaptability and compliance across regions.
Leading Players in the Driveline Market
The driveline market features a robust ecosystem of leading companies actively shaping the industry. These include global automotive giants and specialized driveline component manufacturers.
- ZF
- Schaeffler
- BorgWarner
- GKN
- Robert Bosch
- Volkswagen
- Ford Motors
- Toyota Motors
- Mahindra & Mahindra
Key Developments in Driveline Sector
The driveline sector has witnessed significant strategic moves and technological advancements that are reshaping the competitive landscape.
- 2023/October: BorgWarner's acquisition of a majority stake in an electric driveline technology company, bolstering its EV powertrain portfolio.
- 2024/March: ZF Friedrichshafen AG launched a new generation of integrated e-axles, offering higher efficiency and power density for electric vehicles.
- 2024/July: Schaeffler announced significant investments in e-mobility solutions, including advanced driveline systems for passenger and commercial EVs.
- 2025/January: GKN Automotive unveiled a new, highly efficient electric driveline system for SUVs, targeting a million unit annual production capacity.
- 2025/April: Robert Bosch GmbH showcased its latest power electronics for electric vehicles, crucial for optimizing electric driveline performance.
- 2025/August: Volkswagen AG announced its strategy to accelerate EV platform development, with a strong focus on in-house electric driveline manufacturing.
- 2026/February: Ford Motors revealed plans for its next-generation electric F-150 driveline, emphasizing enhanced towing capacity and range.
- 2026/June: Toyota Motors continued to invest in hybrid driveline technology while expanding its electric driveline development for future BEVs.
- 2027/November: Mahindra & Mahindra showcased innovative driveline solutions for its upcoming electric SUV lineup, focusing on performance and cost-effectiveness.
Strategic Driveline Market Outlook
The strategic outlook for the driveline market is overwhelmingly positive, driven by the irreversible trend towards vehicle electrification and sustainability. Growth accelerators include the ongoing technological advancements in electric motor efficiency, power electronics integration, and battery management systems, all of which directly enhance the performance and appeal of electric drivelines. The increasing demand for all-wheel-drive (AWD) electric drivelines and sophisticated torque vectoring systems will create significant market opportunities. Strategic collaborations between automotive OEMs and tier-1 suppliers will be crucial for developing and scaling modular driveline architectures that can be adapted across multiple vehicle platforms, thereby reducing costs and time-to-market. Furthermore, the market potential for advanced driveline control software and predictive maintenance solutions offers avenues for value-added services. Companies that can effectively navigate the transition to electrification, invest in cutting-edge driveline technology, and optimize their manufacturing processes are well-positioned for sustained success and profitability in the coming years, with market expansion expected to reach several hundred million in value.
Driveline Segmentation
-
1. Application
- 1.1. 45 — 100 kW
- 1.2. 101 — 250 kW
- 1.3. Above 250 kW
-
2. Types
- 2.1. Series Driveline
- 2.2. Parallel Driveline
- 2.3. Power Split Driveline
- 2.4. Electric Driveline
Driveline Segmentation By Geography
-
1. North America
- 1.1. United States
- 1.2. Canada
- 1.3. Mexico
-
2. South America
- 2.1. Brazil
- 2.2. Argentina
- 2.3. Rest of South America
-
3. Europe
- 3.1. United Kingdom
- 3.2. Germany
- 3.3. France
- 3.4. Italy
- 3.5. Spain
- 3.6. Russia
- 3.7. Benelux
- 3.8. Nordics
- 3.9. Rest of Europe
-
4. Middle East & Africa
- 4.1. Turkey
- 4.2. Israel
- 4.3. GCC
- 4.4. North Africa
- 4.5. South Africa
- 4.6. Rest of Middle East & Africa
-
5. Asia Pacific
- 5.1. China
- 5.2. India
- 5.3. Japan
- 5.4. South Korea
- 5.5. ASEAN
- 5.6. Oceania
- 5.7. Rest of Asia Pacific
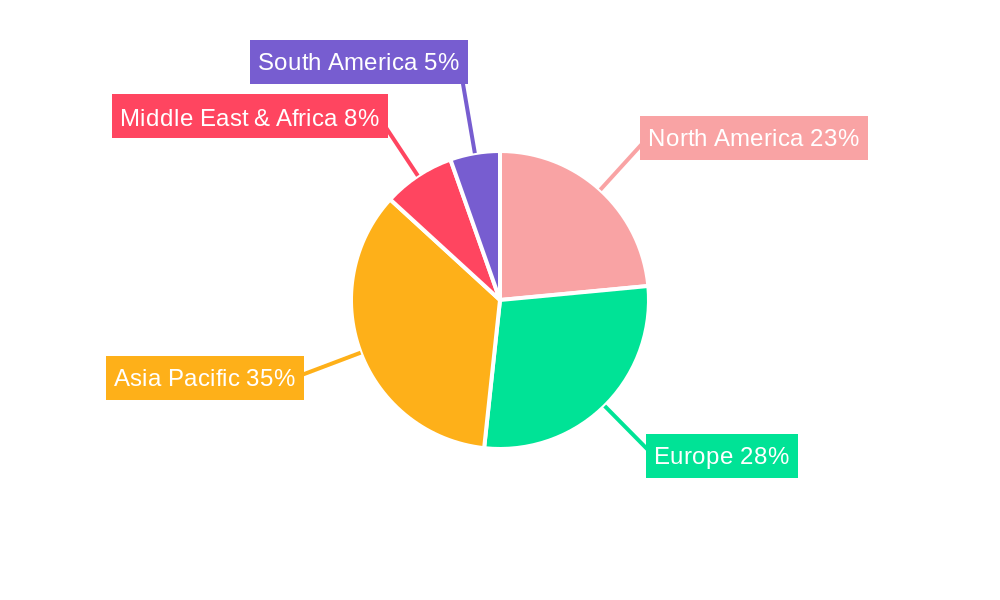
Driveline Regional Market Share
Geographic Coverage of Driveline
Driveline REPORT HIGHLIGHTS
| Aspects | Details |
|---|---|
| Study Period | 2020-2034 |
| Base Year | 2025 |
| Estimated Year | 2026 |
| Forecast Period | 2026-2034 |
| Historical Period | 2020-2025 |
| Growth Rate | CAGR of 4.8% from 2020-2034 |
| Segmentation |
|
Table of Contents
- 1. Introduction
- 1.1. Research Scope
- 1.2. Market Segmentation
- 1.3. Research Methodology
- 1.4. Definitions and Assumptions
- 2. Executive Summary
- 2.1. Introduction
- 3. Market Dynamics
- 3.1. Introduction
- 3.2. Market Drivers
- 3.3. Market Restrains
- 3.4. Market Trends
- 4. Market Factor Analysis
- 4.1. Porters Five Forces
- 4.2. Supply/Value Chain
- 4.3. PESTEL analysis
- 4.4. Market Entropy
- 4.5. Patent/Trademark Analysis
- 5. Global Driveline Analysis, Insights and Forecast, 2020-2032
- 5.1. Market Analysis, Insights and Forecast - by Application
- 5.1.1. 45 — 100 kW
- 5.1.2. 101 — 250 kW
- 5.1.3. Above 250 kW
- 5.2. Market Analysis, Insights and Forecast - by Types
- 5.2.1. Series Driveline
- 5.2.2. Parallel Driveline
- 5.2.3. Power Split Driveline
- 5.2.4. Electric Driveline
- 5.3. Market Analysis, Insights and Forecast - by Region
- 5.3.1. North America
- 5.3.2. South America
- 5.3.3. Europe
- 5.3.4. Middle East & Africa
- 5.3.5. Asia Pacific
- 5.1. Market Analysis, Insights and Forecast - by Application
- 6. North America Driveline Analysis, Insights and Forecast, 2020-2032
- 6.1. Market Analysis, Insights and Forecast - by Application
- 6.1.1. 45 — 100 kW
- 6.1.2. 101 — 250 kW
- 6.1.3. Above 250 kW
- 6.2. Market Analysis, Insights and Forecast - by Types
- 6.2.1. Series Driveline
- 6.2.2. Parallel Driveline
- 6.2.3. Power Split Driveline
- 6.2.4. Electric Driveline
- 6.1. Market Analysis, Insights and Forecast - by Application
- 7. South America Driveline Analysis, Insights and Forecast, 2020-2032
- 7.1. Market Analysis, Insights and Forecast - by Application
- 7.1.1. 45 — 100 kW
- 7.1.2. 101 — 250 kW
- 7.1.3. Above 250 kW
- 7.2. Market Analysis, Insights and Forecast - by Types
- 7.2.1. Series Driveline
- 7.2.2. Parallel Driveline
- 7.2.3. Power Split Driveline
- 7.2.4. Electric Driveline
- 7.1. Market Analysis, Insights and Forecast - by Application
- 8. Europe Driveline Analysis, Insights and Forecast, 2020-2032
- 8.1. Market Analysis, Insights and Forecast - by Application
- 8.1.1. 45 — 100 kW
- 8.1.2. 101 — 250 kW
- 8.1.3. Above 250 kW
- 8.2. Market Analysis, Insights and Forecast - by Types
- 8.2.1. Series Driveline
- 8.2.2. Parallel Driveline
- 8.2.3. Power Split Driveline
- 8.2.4. Electric Driveline
- 8.1. Market Analysis, Insights and Forecast - by Application
- 9. Middle East & Africa Driveline Analysis, Insights and Forecast, 2020-2032
- 9.1. Market Analysis, Insights and Forecast - by Application
- 9.1.1. 45 — 100 kW
- 9.1.2. 101 — 250 kW
- 9.1.3. Above 250 kW
- 9.2. Market Analysis, Insights and Forecast - by Types
- 9.2.1. Series Driveline
- 9.2.2. Parallel Driveline
- 9.2.3. Power Split Driveline
- 9.2.4. Electric Driveline
- 9.1. Market Analysis, Insights and Forecast - by Application
- 10. Asia Pacific Driveline Analysis, Insights and Forecast, 2020-2032
- 10.1. Market Analysis, Insights and Forecast - by Application
- 10.1.1. 45 — 100 kW
- 10.1.2. 101 — 250 kW
- 10.1.3. Above 250 kW
- 10.2. Market Analysis, Insights and Forecast - by Types
- 10.2.1. Series Driveline
- 10.2.2. Parallel Driveline
- 10.2.3. Power Split Driveline
- 10.2.4. Electric Driveline
- 10.1. Market Analysis, Insights and Forecast - by Application
- 11. Competitive Analysis
- 11.1. Global Market Share Analysis 2025
- 11.2. Company Profiles
- 11.2.1 ZF
- 11.2.1.1. Overview
- 11.2.1.2. Products
- 11.2.1.3. SWOT Analysis
- 11.2.1.4. Recent Developments
- 11.2.1.5. Financials (Based on Availability)
- 11.2.2 Schaeffler
- 11.2.2.1. Overview
- 11.2.2.2. Products
- 11.2.2.3. SWOT Analysis
- 11.2.2.4. Recent Developments
- 11.2.2.5. Financials (Based on Availability)
- 11.2.3 BorgWarner
- 11.2.3.1. Overview
- 11.2.3.2. Products
- 11.2.3.3. SWOT Analysis
- 11.2.3.4. Recent Developments
- 11.2.3.5. Financials (Based on Availability)
- 11.2.4 GKN
- 11.2.4.1. Overview
- 11.2.4.2. Products
- 11.2.4.3. SWOT Analysis
- 11.2.4.4. Recent Developments
- 11.2.4.5. Financials (Based on Availability)
- 11.2.5 Robert Bosch
- 11.2.5.1. Overview
- 11.2.5.2. Products
- 11.2.5.3. SWOT Analysis
- 11.2.5.4. Recent Developments
- 11.2.5.5. Financials (Based on Availability)
- 11.2.6 Volkswagen
- 11.2.6.1. Overview
- 11.2.6.2. Products
- 11.2.6.3. SWOT Analysis
- 11.2.6.4. Recent Developments
- 11.2.6.5. Financials (Based on Availability)
- 11.2.7 Ford Motors
- 11.2.7.1. Overview
- 11.2.7.2. Products
- 11.2.7.3. SWOT Analysis
- 11.2.7.4. Recent Developments
- 11.2.7.5. Financials (Based on Availability)
- 11.2.8 ToyotaMotors
- 11.2.8.1. Overview
- 11.2.8.2. Products
- 11.2.8.3. SWOT Analysis
- 11.2.8.4. Recent Developments
- 11.2.8.5. Financials (Based on Availability)
- 11.2.9 Mahindra & Mahindra
- 11.2.9.1. Overview
- 11.2.9.2. Products
- 11.2.9.3. SWOT Analysis
- 11.2.9.4. Recent Developments
- 11.2.9.5. Financials (Based on Availability)
- 11.2.1 ZF
List of Figures
- Figure 1: Global Driveline Revenue Breakdown (million, %) by Region 2025 & 2033
- Figure 2: North America Driveline Revenue (million), by Application 2025 & 2033
- Figure 3: North America Driveline Revenue Share (%), by Application 2025 & 2033
- Figure 4: North America Driveline Revenue (million), by Types 2025 & 2033
- Figure 5: North America Driveline Revenue Share (%), by Types 2025 & 2033
- Figure 6: North America Driveline Revenue (million), by Country 2025 & 2033
- Figure 7: North America Driveline Revenue Share (%), by Country 2025 & 2033
- Figure 8: South America Driveline Revenue (million), by Application 2025 & 2033
- Figure 9: South America Driveline Revenue Share (%), by Application 2025 & 2033
- Figure 10: South America Driveline Revenue (million), by Types 2025 & 2033
- Figure 11: South America Driveline Revenue Share (%), by Types 2025 & 2033
- Figure 12: South America Driveline Revenue (million), by Country 2025 & 2033
- Figure 13: South America Driveline Revenue Share (%), by Country 2025 & 2033
- Figure 14: Europe Driveline Revenue (million), by Application 2025 & 2033
- Figure 15: Europe Driveline Revenue Share (%), by Application 2025 & 2033
- Figure 16: Europe Driveline Revenue (million), by Types 2025 & 2033
- Figure 17: Europe Driveline Revenue Share (%), by Types 2025 & 2033
- Figure 18: Europe Driveline Revenue (million), by Country 2025 & 2033
- Figure 19: Europe Driveline Revenue Share (%), by Country 2025 & 2033
- Figure 20: Middle East & Africa Driveline Revenue (million), by Application 2025 & 2033
- Figure 21: Middle East & Africa Driveline Revenue Share (%), by Application 2025 & 2033
- Figure 22: Middle East & Africa Driveline Revenue (million), by Types 2025 & 2033
- Figure 23: Middle East & Africa Driveline Revenue Share (%), by Types 2025 & 2033
- Figure 24: Middle East & Africa Driveline Revenue (million), by Country 2025 & 2033
- Figure 25: Middle East & Africa Driveline Revenue Share (%), by Country 2025 & 2033
- Figure 26: Asia Pacific Driveline Revenue (million), by Application 2025 & 2033
- Figure 27: Asia Pacific Driveline Revenue Share (%), by Application 2025 & 2033
- Figure 28: Asia Pacific Driveline Revenue (million), by Types 2025 & 2033
- Figure 29: Asia Pacific Driveline Revenue Share (%), by Types 2025 & 2033
- Figure 30: Asia Pacific Driveline Revenue (million), by Country 2025 & 2033
- Figure 31: Asia Pacific Driveline Revenue Share (%), by Country 2025 & 2033
List of Tables
- Table 1: Global Driveline Revenue million Forecast, by Application 2020 & 2033
- Table 2: Global Driveline Revenue million Forecast, by Types 2020 & 2033
- Table 3: Global Driveline Revenue million Forecast, by Region 2020 & 2033
- Table 4: Global Driveline Revenue million Forecast, by Application 2020 & 2033
- Table 5: Global Driveline Revenue million Forecast, by Types 2020 & 2033
- Table 6: Global Driveline Revenue million Forecast, by Country 2020 & 2033
- Table 7: United States Driveline Revenue (million) Forecast, by Application 2020 & 2033
- Table 8: Canada Driveline Revenue (million) Forecast, by Application 2020 & 2033
- Table 9: Mexico Driveline Revenue (million) Forecast, by Application 2020 & 2033
- Table 10: Global Driveline Revenue million Forecast, by Application 2020 & 2033
- Table 11: Global Driveline Revenue million Forecast, by Types 2020 & 2033
- Table 12: Global Driveline Revenue million Forecast, by Country 2020 & 2033
- Table 13: Brazil Driveline Revenue (million) Forecast, by Application 2020 & 2033
- Table 14: Argentina Driveline Revenue (million) Forecast, by Application 2020 & 2033
- Table 15: Rest of South America Driveline Revenue (million) Forecast, by Application 2020 & 2033
- Table 16: Global Driveline Revenue million Forecast, by Application 2020 & 2033
- Table 17: Global Driveline Revenue million Forecast, by Types 2020 & 2033
- Table 18: Global Driveline Revenue million Forecast, by Country 2020 & 2033
- Table 19: United Kingdom Driveline Revenue (million) Forecast, by Application 2020 & 2033
- Table 20: Germany Driveline Revenue (million) Forecast, by Application 2020 & 2033
- Table 21: France Driveline Revenue (million) Forecast, by Application 2020 & 2033
- Table 22: Italy Driveline Revenue (million) Forecast, by Application 2020 & 2033
- Table 23: Spain Driveline Revenue (million) Forecast, by Application 2020 & 2033
- Table 24: Russia Driveline Revenue (million) Forecast, by Application 2020 & 2033
- Table 25: Benelux Driveline Revenue (million) Forecast, by Application 2020 & 2033
- Table 26: Nordics Driveline Revenue (million) Forecast, by Application 2020 & 2033
- Table 27: Rest of Europe Driveline Revenue (million) Forecast, by Application 2020 & 2033
- Table 28: Global Driveline Revenue million Forecast, by Application 2020 & 2033
- Table 29: Global Driveline Revenue million Forecast, by Types 2020 & 2033
- Table 30: Global Driveline Revenue million Forecast, by Country 2020 & 2033
- Table 31: Turkey Driveline Revenue (million) Forecast, by Application 2020 & 2033
- Table 32: Israel Driveline Revenue (million) Forecast, by Application 2020 & 2033
- Table 33: GCC Driveline Revenue (million) Forecast, by Application 2020 & 2033
- Table 34: North Africa Driveline Revenue (million) Forecast, by Application 2020 & 2033
- Table 35: South Africa Driveline Revenue (million) Forecast, by Application 2020 & 2033
- Table 36: Rest of Middle East & Africa Driveline Revenue (million) Forecast, by Application 2020 & 2033
- Table 37: Global Driveline Revenue million Forecast, by Application 2020 & 2033
- Table 38: Global Driveline Revenue million Forecast, by Types 2020 & 2033
- Table 39: Global Driveline Revenue million Forecast, by Country 2020 & 2033
- Table 40: China Driveline Revenue (million) Forecast, by Application 2020 & 2033
- Table 41: India Driveline Revenue (million) Forecast, by Application 2020 & 2033
- Table 42: Japan Driveline Revenue (million) Forecast, by Application 2020 & 2033
- Table 43: South Korea Driveline Revenue (million) Forecast, by Application 2020 & 2033
- Table 44: ASEAN Driveline Revenue (million) Forecast, by Application 2020 & 2033
- Table 45: Oceania Driveline Revenue (million) Forecast, by Application 2020 & 2033
- Table 46: Rest of Asia Pacific Driveline Revenue (million) Forecast, by Application 2020 & 2033
Frequently Asked Questions
1. What is the projected Compound Annual Growth Rate (CAGR) of the Driveline?
The projected CAGR is approximately 4.8%.
2. Which companies are prominent players in the Driveline?
Key companies in the market include ZF, Schaeffler, BorgWarner, GKN, Robert Bosch, Volkswagen, Ford Motors, ToyotaMotors, Mahindra & Mahindra.
3. What are the main segments of the Driveline?
The market segments include Application, Types.
4. Can you provide details about the market size?
The market size is estimated to be USD 270220 million as of 2022.
5. What are some drivers contributing to market growth?
N/A
6. What are the notable trends driving market growth?
N/A
7. Are there any restraints impacting market growth?
N/A
8. Can you provide examples of recent developments in the market?
N/A
9. What pricing options are available for accessing the report?
Pricing options include single-user, multi-user, and enterprise licenses priced at USD 4900.00, USD 7350.00, and USD 9800.00 respectively.
10. Is the market size provided in terms of value or volume?
The market size is provided in terms of value, measured in million.
11. Are there any specific market keywords associated with the report?
Yes, the market keyword associated with the report is "Driveline," which aids in identifying and referencing the specific market segment covered.
12. How do I determine which pricing option suits my needs best?
The pricing options vary based on user requirements and access needs. Individual users may opt for single-user licenses, while businesses requiring broader access may choose multi-user or enterprise licenses for cost-effective access to the report.
13. Are there any additional resources or data provided in the Driveline report?
While the report offers comprehensive insights, it's advisable to review the specific contents or supplementary materials provided to ascertain if additional resources or data are available.
14. How can I stay updated on further developments or reports in the Driveline?
To stay informed about further developments, trends, and reports in the Driveline, consider subscribing to industry newsletters, following relevant companies and organizations, or regularly checking reputable industry news sources and publications.
Methodology
Step 1 - Identification of Relevant Samples Size from Population Database


Step 2 - Approaches for Defining Global Market Size (Value, Volume* & Price*)

Note*: In applicable scenarios
Step 3 - Data Sources
Primary Research
- Web Analytics
- Survey Reports
- Research Institute
- Latest Research Reports
- Opinion Leaders
Secondary Research
- Annual Reports
- White Paper
- Latest Press Release
- Industry Association
- Paid Database
- Investor Presentations

Step 4 - Data Triangulation
Involves using different sources of information in order to increase the validity of a study
These sources are likely to be stakeholders in a program - participants, other researchers, program staff, other community members, and so on.
Then we put all data in single framework & apply various statistical tools to find out the dynamic on the market.
During the analysis stage, feedback from the stakeholder groups would be compared to determine areas of agreement as well as areas of divergence