
Key Insights
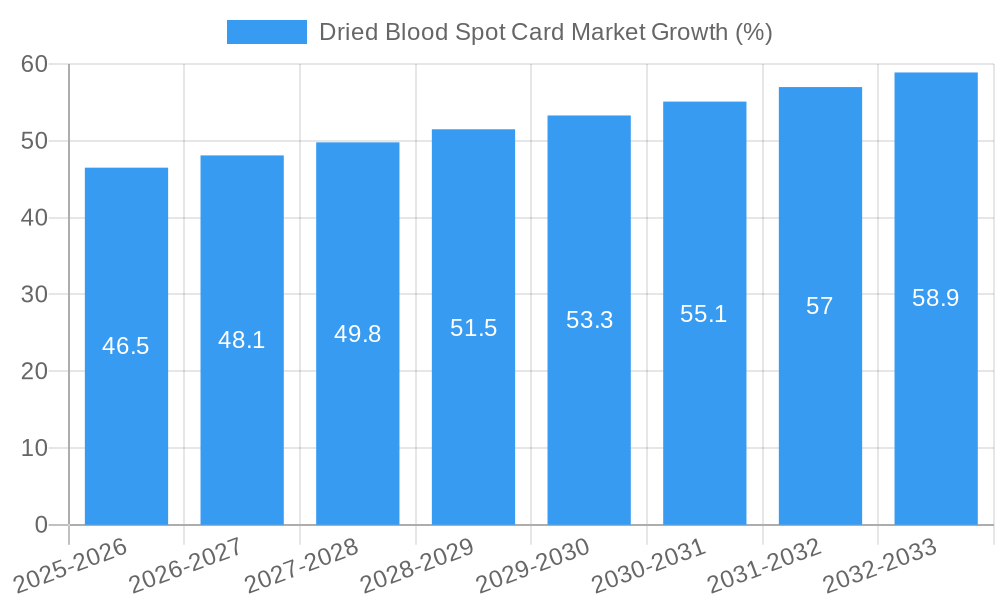
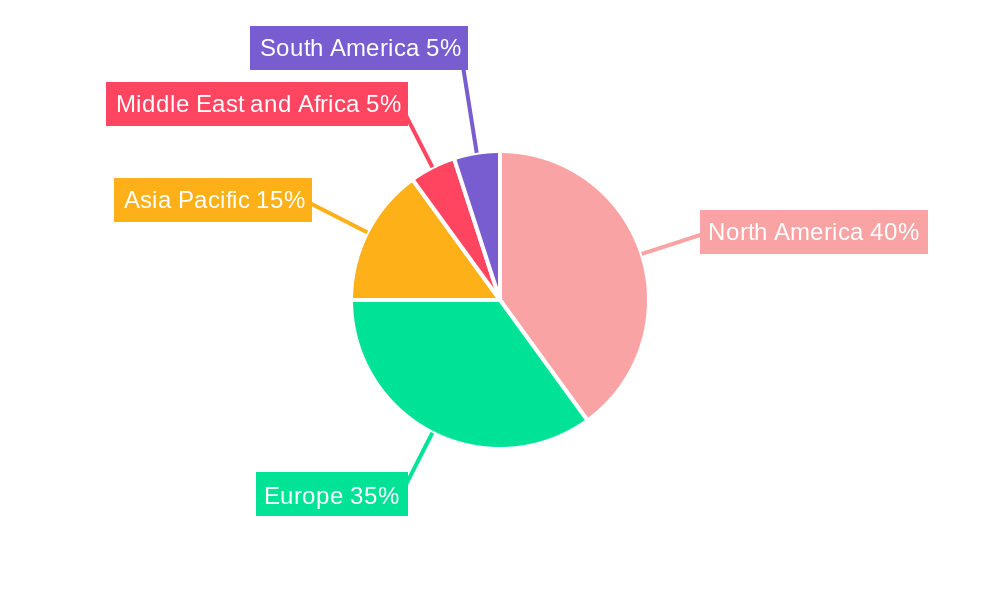
The Dried Blood Spot (DBS) card market is experiencing steady growth, driven by the increasing adoption of DBS technology in various applications, particularly in infectious disease testing, newborn screening, and therapeutic drug monitoring. The market's expansion is fueled by the numerous advantages of DBS cards, including their ease of use, cost-effectiveness, non-invasive sample collection, and suitability for remote testing. This translates into improved accessibility and efficiency in healthcare diagnostics, particularly in resource-limited settings. The 3.10% CAGR indicates a consistent market expansion, projected to continue over the forecast period (2025-2033). Key players like Shimadzu Scientific Instruments, QIAGEN, and PerkinElmer are driving innovation in card technology and expanding their market share through strategic partnerships and product development. Market segmentation by card type (Ahlstrom, Whatman, FTA, and others) highlights the competitive landscape and varying technological advancements within the industry. The application segment reveals the diverse use cases of DBS cards, with infectious disease testing and newborn screening forming major revenue contributors. The geographic distribution reflects a strong presence across North America and Europe, with emerging markets in Asia-Pacific and other regions showing considerable potential for growth as healthcare infrastructure improves.
The future of the DBS card market hinges on technological advancements in card materials, improved automation in sample processing, and the development of more sophisticated diagnostic assays compatible with DBS technology. Furthermore, stringent regulatory frameworks surrounding diagnostics and increasing focus on personalized medicine are shaping the market trajectory. The expansion into new application areas, such as forensic science and point-of-care diagnostics, promises further market growth. However, potential restraints include the variability in blood spot quality, limitations in the volume of sample available for testing, and the need for skilled technicians for certain procedures. Despite these challenges, the overall market outlook for DBS cards remains positive, driven by its clear advantages over traditional blood collection methods and the increasing demand for accessible, cost-effective diagnostic solutions.
Dried Blood Spot Card Market: A Comprehensive Report (2019-2033)
This comprehensive report provides an in-depth analysis of the Dried Blood Spot (DBS) Card Market, offering valuable insights for stakeholders across the industry. With a study period spanning 2019-2033, a base year of 2025, and a forecast period of 2025-2033, this report covers historical data (2019-2024) and projects future market trends. The report segments the market by card type (Ahlstrom, Whatman, FTA, Others) and application (Infectious Disease Testing, Newborn Screening, Forensics, Therapeutic Drug Monitoring, Others), providing a granular understanding of market dynamics. The market is projected to reach xx Million by 2033, with a CAGR of xx% during the forecast period.
Dried Blood Spot Card Market Market Structure & Competitive Dynamics
The Dried Blood Spot Card market exhibits a moderately concentrated structure, with key players holding significant market share. The market is characterized by intense competition, driven by continuous product innovation, strategic mergers and acquisitions (M&A), and evolving regulatory landscapes. Major players such as Shimadzu Scientific Instruments, QIAGEN, and PerkinElmer are engaged in aggressive strategies to expand their market presence. Innovation ecosystems are thriving, fueled by advancements in molecular diagnostics and the increasing demand for point-of-care testing. Regulatory frameworks, varying across different geographical regions, significantly impact market access and product approvals. The market faces competition from alternative sample collection methods, but the advantages of DBS cards – ease of use, cost-effectiveness, and suitability for various applications – continue to drive market growth. M&A activity has been observed, though specific deal values remain undisclosed for many transactions. Some notable recent transactions have involved smaller companies being acquired by larger players looking to expand their product portfolios. The market share of top players is estimated to be around xx%, with smaller players competing aggressively for a share of the remaining market.
Dried Blood Spot Card Market Industry Trends & Insights
The Dried Blood Spot Card market is experiencing robust growth, propelled by several key factors. The rising prevalence of infectious diseases, coupled with the increasing need for rapid diagnostics, is a major driver. Advancements in molecular diagnostics technology are enhancing the sensitivity and specificity of DBS-based assays, further expanding market applications. The growing demand for newborn screening programs globally contributes to market expansion, particularly in developing economies. Consumer preferences are shifting toward non-invasive, convenient sample collection methods, aligning perfectly with the ease of use offered by DBS cards. Technological disruptions, including the integration of automation and artificial intelligence in diagnostics, are enhancing the efficiency and scalability of DBS testing. The market penetration of DBS cards in various healthcare settings, from hospitals to decentralized testing facilities, is steadily increasing. This growth, despite variations in market entry barriers and competition in certain niches, is projected to continue with a steady growth rate for the foreseeable future.
Dominant Markets & Segments in Dried Blood Spot Card Market
Leading Region/Country: North America currently dominates the Dried Blood Spot Card market, driven by high healthcare expenditure, robust regulatory frameworks supporting innovative diagnostic solutions, and advanced healthcare infrastructure. Europe follows closely, with strong growth prospects in emerging economies.
Leading Segment (Card Type): Whatman cards currently hold a significant market share, owing to their established reputation, extensive distribution networks, and superior performance characteristics. However, Ahlstrom and FTA cards are also experiencing notable growth, driven by their suitability in specific applications.
Leading Segment (Application): Newborn screening is currently the dominant application segment, attributed to the widespread implementation of mandatory screening programs globally. Infectious disease testing is a rapidly growing segment, fueled by the increasing prevalence of infectious diseases.
Key Drivers:
- North America: High healthcare expenditure, advanced healthcare infrastructure, strong regulatory support for innovation.
- Europe: Growing adoption of advanced diagnostic technologies, increasing prevalence of chronic diseases.
- Asia-Pacific: Rising healthcare expenditure, increasing awareness of newborn screening, and improving healthcare infrastructure.
Dried Blood Spot Card Market Product Innovations
Recent advancements in DBS card technology have focused on improving sample stability, enhancing assay performance, and developing novel applications. Manufacturers are introducing cards with enhanced absorbent properties, minimizing sample degradation and improving the accuracy of diagnostic tests. The integration of novel materials and surface modifications are further enhancing the performance and efficiency of DBS-based assays. These innovations, coupled with advancements in molecular diagnostics, are continuously expanding the range of applications for DBS cards, contributing to their growing market adoption.
Report Segmentation & Scope
This report segments the Dried Blood Spot Card market based on card type and application.
By Card Type:
- Ahlstrom: This segment shows steady growth driven by its established reputation and reliable performance.
- Whatman: This segment is a market leader due to high quality and wide use.
- FTA: This segment experiences growth driven by its suitability for specific applications requiring high sample stability.
- Others: This segment comprises various niche card types, which collectively contribute to market growth.
By Application:
- Infectious Disease Testing: This is a high-growth segment driven by increasing prevalence of infectious diseases and demand for rapid diagnostics.
- Newborn Screening: This is a dominant segment, due to growing global implementation of newborn screening programs.
- Forensics: This segment benefits from the DBS cards ability to preserve DNA/RNA samples long-term.
- Therapeutic Drug Monitoring: This segment is expected to grow due to the rising adoption of personalized medicine.
- Others: This includes niche applications showing potential for future growth.
Each segment's analysis includes growth projections, market size estimations, and competitive dynamics.
Key Drivers of Dried Blood Spot Card Market Growth
Several factors fuel the growth of the DBS card market. The increasing prevalence of chronic and infectious diseases necessitates efficient and cost-effective diagnostic tools. The rising demand for point-of-care diagnostics, particularly in remote areas with limited access to advanced healthcare facilities, is another major driver. Government initiatives promoting newborn screening programs and funding research in molecular diagnostics are further bolstering market growth. Technological advancements, such as improved card designs and enhanced assay methodologies, contribute to improved testing accuracy and efficiency.
Challenges in the Dried Blood Spot Card Market Sector
The DBS card market faces challenges including stringent regulatory requirements for medical devices, impacting product approvals and market entry. Supply chain disruptions and fluctuations in raw material prices can impact manufacturing costs and profitability. Furthermore, intense competition from alternative sample collection methods and the need for continuous innovation to stay ahead of the curve present ongoing challenges for market players. These factors, if not addressed efficiently, could hinder overall market growth. The impact of these factors may lead to an estimated xx% reduction in potential market size by 2033.
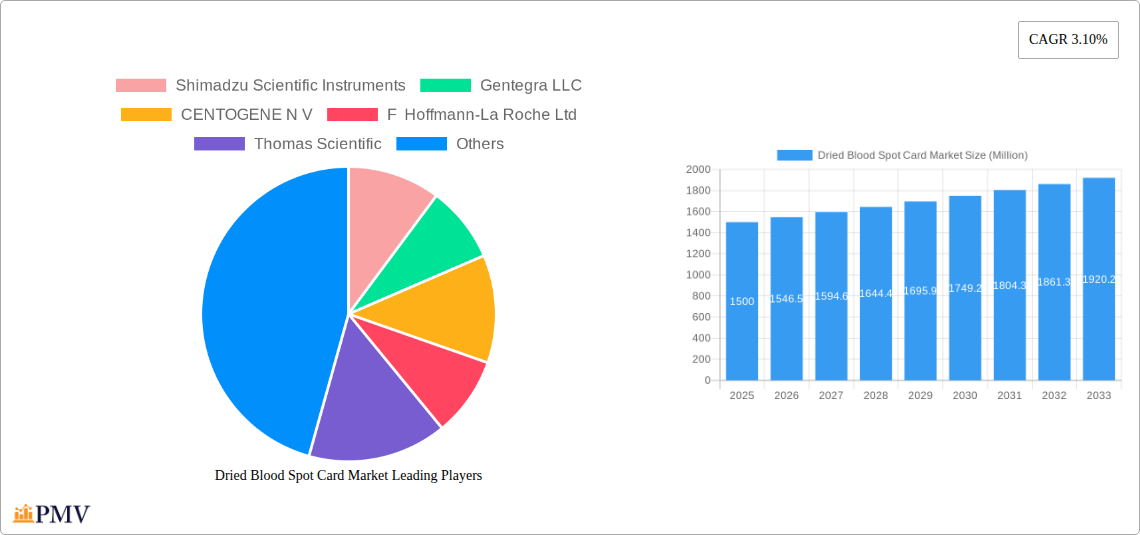
Leading Players in the Dried Blood Spot Card Market Market
- Shimadzu Scientific Instruments
- Gentegra LLC
- CENTOGENE N V
- F Hoffmann-La Roche Ltd
- Thomas Scientific
- Hemaxis
- Lipomic Healthcare
- Eastern Business Forms Inc
- ARCHIMEDlife
- QIAGEN
- PerkinElmer
- Ahlstrom-Munksjö
Key Developments in Dried Blood Spot Card Market Sector
August 2022: Boston Heart Diagnostics Corporation launched a broad range of tests using dried blood spot collection for cardiovascular risk factors, type 2 diabetes, and wellness assessments. This significantly expands the applications of DBS cards in preventative healthcare.
June 2022: A study demonstrated the effectiveness and cost-efficiency of Whatman FTA cards in molecular diagnostics for Yellow Fever Virus detection, highlighting the utility of DBS cards in infectious disease surveillance and control. This validated the existing application and market and promoted the use of DBS further.
Strategic Dried Blood Spot Card Market Market Outlook
The Dried Blood Spot Card market presents significant growth potential, driven by the increasing adoption of point-of-care diagnostics, advancements in molecular diagnostics, and the growing need for efficient and cost-effective sample collection methods. Strategic opportunities lie in developing innovative card designs, expanding applications into new therapeutic areas, and forging strategic partnerships to enhance market penetration. Focusing on expanding into emerging markets and investing in research and development to improve the accuracy and efficiency of DBS-based assays is crucial for future success. The market's future trajectory is highly promising, indicating robust growth and significant opportunities for players capitalizing on these trends.
Dried Blood Spot Card Market Segmentation
-
1. Card Type
- 1.1. Ahlstrom 226
- 1.2. Whatman 903
- 1.3. FTA
- 1.4. Others
-
2. Application
- 2.1. Infectious Disease Testing
- 2.2. Newborn Screening
- 2.3. Forensics
- 2.4. Therapeutic Drug Monitoring
- 2.5. Others
Dried Blood Spot Card Market Segmentation By Geography
-
1. North America
- 1.1. United States
- 1.2. Canada
- 1.3. Mexico
-
2. Europe
- 2.1. Germany
- 2.2. United Kingdom
- 2.3. France
- 2.4. Italy
- 2.5. Spain
- 2.6. Rest of Europe
-
3. Asia Pacific
- 3.1. China
- 3.2. Japan
- 3.3. India
- 3.4. Australia
- 3.5. South Korea
- 3.6. Rest of Asia Pacific
-
4. Middle East and Africa
- 4.1. GCC
- 4.2. South Africa
- 4.3. Rest of Middle East and Africa
-
5. South America
- 5.1. Brazil
- 5.2. Argentina
- 5.3. Rest of South America
Dried Blood Spot Card Market REPORT HIGHLIGHTS
| Aspects | Details |
|---|---|
| Study Period | 2019-2033 |
| Base Year | 2024 |
| Estimated Year | 2025 |
| Forecast Period | 2025-2033 |
| Historical Period | 2019-2024 |
| Growth Rate | CAGR of 3.10% from 2019-2033 |
| Segmentation |
|
Table of Contents
- 1. Introduction
- 1.1. Research Scope
- 1.2. Market Segmentation
- 1.3. Research Methodology
- 1.4. Definitions and Assumptions
- 2. Executive Summary
- 2.1. Introduction
- 3. Market Dynamics
- 3.1. Introduction
- 3.2. Market Drivers
- 3.2.1. Increasing Use of DBS Cards in Diagnostic Testing; Rise of Forensic Toxicology Applications
- 3.3. Market Restrains
- 3.3.1. Contamination Caused in DBS Collection Cards
- 3.4. Market Trends
- 3.4.1. Newborn Screening Segment is Expected to Witness Considerable Growth Over the Forecast Period
- 4. Market Factor Analysis
- 4.1. Porters Five Forces
- 4.2. Supply/Value Chain
- 4.3. PESTEL analysis
- 4.4. Market Entropy
- 4.5. Patent/Trademark Analysis
- 5. Global Dried Blood Spot Card Market Analysis, Insights and Forecast, 2019-2031
- 5.1. Market Analysis, Insights and Forecast - by Card Type
- 5.1.1. Ahlstrom 226
- 5.1.2. Whatman 903
- 5.1.3. FTA
- 5.1.4. Others
- 5.2. Market Analysis, Insights and Forecast - by Application
- 5.2.1. Infectious Disease Testing
- 5.2.2. Newborn Screening
- 5.2.3. Forensics
- 5.2.4. Therapeutic Drug Monitoring
- 5.2.5. Others
- 5.3. Market Analysis, Insights and Forecast - by Region
- 5.3.1. North America
- 5.3.2. Europe
- 5.3.3. Asia Pacific
- 5.3.4. Middle East and Africa
- 5.3.5. South America
- 5.1. Market Analysis, Insights and Forecast - by Card Type
- 6. North America Dried Blood Spot Card Market Analysis, Insights and Forecast, 2019-2031
- 6.1. Market Analysis, Insights and Forecast - by Card Type
- 6.1.1. Ahlstrom 226
- 6.1.2. Whatman 903
- 6.1.3. FTA
- 6.1.4. Others
- 6.2. Market Analysis, Insights and Forecast - by Application
- 6.2.1. Infectious Disease Testing
- 6.2.2. Newborn Screening
- 6.2.3. Forensics
- 6.2.4. Therapeutic Drug Monitoring
- 6.2.5. Others
- 6.1. Market Analysis, Insights and Forecast - by Card Type
- 7. Europe Dried Blood Spot Card Market Analysis, Insights and Forecast, 2019-2031
- 7.1. Market Analysis, Insights and Forecast - by Card Type
- 7.1.1. Ahlstrom 226
- 7.1.2. Whatman 903
- 7.1.3. FTA
- 7.1.4. Others
- 7.2. Market Analysis, Insights and Forecast - by Application
- 7.2.1. Infectious Disease Testing
- 7.2.2. Newborn Screening
- 7.2.3. Forensics
- 7.2.4. Therapeutic Drug Monitoring
- 7.2.5. Others
- 7.1. Market Analysis, Insights and Forecast - by Card Type
- 8. Asia Pacific Dried Blood Spot Card Market Analysis, Insights and Forecast, 2019-2031
- 8.1. Market Analysis, Insights and Forecast - by Card Type
- 8.1.1. Ahlstrom 226
- 8.1.2. Whatman 903
- 8.1.3. FTA
- 8.1.4. Others
- 8.2. Market Analysis, Insights and Forecast - by Application
- 8.2.1. Infectious Disease Testing
- 8.2.2. Newborn Screening
- 8.2.3. Forensics
- 8.2.4. Therapeutic Drug Monitoring
- 8.2.5. Others
- 8.1. Market Analysis, Insights and Forecast - by Card Type
- 9. Middle East and Africa Dried Blood Spot Card Market Analysis, Insights and Forecast, 2019-2031
- 9.1. Market Analysis, Insights and Forecast - by Card Type
- 9.1.1. Ahlstrom 226
- 9.1.2. Whatman 903
- 9.1.3. FTA
- 9.1.4. Others
- 9.2. Market Analysis, Insights and Forecast - by Application
- 9.2.1. Infectious Disease Testing
- 9.2.2. Newborn Screening
- 9.2.3. Forensics
- 9.2.4. Therapeutic Drug Monitoring
- 9.2.5. Others
- 9.1. Market Analysis, Insights and Forecast - by Card Type
- 10. South America Dried Blood Spot Card Market Analysis, Insights and Forecast, 2019-2031
- 10.1. Market Analysis, Insights and Forecast - by Card Type
- 10.1.1. Ahlstrom 226
- 10.1.2. Whatman 903
- 10.1.3. FTA
- 10.1.4. Others
- 10.2. Market Analysis, Insights and Forecast - by Application
- 10.2.1. Infectious Disease Testing
- 10.2.2. Newborn Screening
- 10.2.3. Forensics
- 10.2.4. Therapeutic Drug Monitoring
- 10.2.5. Others
- 10.1. Market Analysis, Insights and Forecast - by Card Type
- 11. North America Dried Blood Spot Card Market Analysis, Insights and Forecast, 2019-2031
- 11.1. Market Analysis, Insights and Forecast - By Country/Sub-region
- 11.1.1 United States
- 11.1.2 Canada
- 11.1.3 Mexico
- 12. Europe Dried Blood Spot Card Market Analysis, Insights and Forecast, 2019-2031
- 12.1. Market Analysis, Insights and Forecast - By Country/Sub-region
- 12.1.1 Germany
- 12.1.2 United Kingdom
- 12.1.3 France
- 12.1.4 Italy
- 12.1.5 Spain
- 12.1.6 Rest of Europe
- 13. Asia Pacific Dried Blood Spot Card Market Analysis, Insights and Forecast, 2019-2031
- 13.1. Market Analysis, Insights and Forecast - By Country/Sub-region
- 13.1.1 China
- 13.1.2 Japan
- 13.1.3 India
- 13.1.4 Australia
- 13.1.5 South Korea
- 13.1.6 Rest of Asia Pacific
- 14. Middle East and Africa Dried Blood Spot Card Market Analysis, Insights and Forecast, 2019-2031
- 14.1. Market Analysis, Insights and Forecast - By Country/Sub-region
- 14.1.1 GCC
- 14.1.2 South Africa
- 14.1.3 Rest of Middle East and Africa
- 15. South America Dried Blood Spot Card Market Analysis, Insights and Forecast, 2019-2031
- 15.1. Market Analysis, Insights and Forecast - By Country/Sub-region
- 15.1.1 Brazil
- 15.1.2 Argentina
- 15.1.3 Rest of South America
- 16. Competitive Analysis
- 16.1. Global Market Share Analysis 2024
- 16.2. Company Profiles
- 16.2.1 Shimadzu Scientific Instruments
- 16.2.1.1. Overview
- 16.2.1.2. Products
- 16.2.1.3. SWOT Analysis
- 16.2.1.4. Recent Developments
- 16.2.1.5. Financials (Based on Availability)
- 16.2.2 Gentegra LLC
- 16.2.2.1. Overview
- 16.2.2.2. Products
- 16.2.2.3. SWOT Analysis
- 16.2.2.4. Recent Developments
- 16.2.2.5. Financials (Based on Availability)
- 16.2.3 CENTOGENE N V
- 16.2.3.1. Overview
- 16.2.3.2. Products
- 16.2.3.3. SWOT Analysis
- 16.2.3.4. Recent Developments
- 16.2.3.5. Financials (Based on Availability)
- 16.2.4 F Hoffmann-La Roche Ltd
- 16.2.4.1. Overview
- 16.2.4.2. Products
- 16.2.4.3. SWOT Analysis
- 16.2.4.4. Recent Developments
- 16.2.4.5. Financials (Based on Availability)
- 16.2.5 Thomas Scientific
- 16.2.5.1. Overview
- 16.2.5.2. Products
- 16.2.5.3. SWOT Analysis
- 16.2.5.4. Recent Developments
- 16.2.5.5. Financials (Based on Availability)
- 16.2.6 Hemaxis
- 16.2.6.1. Overview
- 16.2.6.2. Products
- 16.2.6.3. SWOT Analysis
- 16.2.6.4. Recent Developments
- 16.2.6.5. Financials (Based on Availability)
- 16.2.7 Lipomic Healthcare
- 16.2.7.1. Overview
- 16.2.7.2. Products
- 16.2.7.3. SWOT Analysis
- 16.2.7.4. Recent Developments
- 16.2.7.5. Financials (Based on Availability)
- 16.2.8 Eastern Business Forms Inc
- 16.2.8.1. Overview
- 16.2.8.2. Products
- 16.2.8.3. SWOT Analysis
- 16.2.8.4. Recent Developments
- 16.2.8.5. Financials (Based on Availability)
- 16.2.9 ARCHIMEDlife
- 16.2.9.1. Overview
- 16.2.9.2. Products
- 16.2.9.3. SWOT Analysis
- 16.2.9.4. Recent Developments
- 16.2.9.5. Financials (Based on Availability)
- 16.2.10 QIAGEN
- 16.2.10.1. Overview
- 16.2.10.2. Products
- 16.2.10.3. SWOT Analysis
- 16.2.10.4. Recent Developments
- 16.2.10.5. Financials (Based on Availability)
- 16.2.11 PerkinElmer
- 16.2.11.1. Overview
- 16.2.11.2. Products
- 16.2.11.3. SWOT Analysis
- 16.2.11.4. Recent Developments
- 16.2.11.5. Financials (Based on Availability)
- 16.2.12 Ahlstrom-Munksjö
- 16.2.12.1. Overview
- 16.2.12.2. Products
- 16.2.12.3. SWOT Analysis
- 16.2.12.4. Recent Developments
- 16.2.12.5. Financials (Based on Availability)
- 16.2.1 Shimadzu Scientific Instruments
List of Figures
- Figure 1: Global Dried Blood Spot Card Market Revenue Breakdown (Million, %) by Region 2024 & 2032
- Figure 2: Global Dried Blood Spot Card Market Volume Breakdown (K Unit, %) by Region 2024 & 2032
- Figure 3: North America Dried Blood Spot Card Market Revenue (Million), by Country 2024 & 2032
- Figure 4: North America Dried Blood Spot Card Market Volume (K Unit), by Country 2024 & 2032
- Figure 5: North America Dried Blood Spot Card Market Revenue Share (%), by Country 2024 & 2032
- Figure 6: North America Dried Blood Spot Card Market Volume Share (%), by Country 2024 & 2032
- Figure 7: Europe Dried Blood Spot Card Market Revenue (Million), by Country 2024 & 2032
- Figure 8: Europe Dried Blood Spot Card Market Volume (K Unit), by Country 2024 & 2032
- Figure 9: Europe Dried Blood Spot Card Market Revenue Share (%), by Country 2024 & 2032
- Figure 10: Europe Dried Blood Spot Card Market Volume Share (%), by Country 2024 & 2032
- Figure 11: Asia Pacific Dried Blood Spot Card Market Revenue (Million), by Country 2024 & 2032
- Figure 12: Asia Pacific Dried Blood Spot Card Market Volume (K Unit), by Country 2024 & 2032
- Figure 13: Asia Pacific Dried Blood Spot Card Market Revenue Share (%), by Country 2024 & 2032
- Figure 14: Asia Pacific Dried Blood Spot Card Market Volume Share (%), by Country 2024 & 2032
- Figure 15: Middle East and Africa Dried Blood Spot Card Market Revenue (Million), by Country 2024 & 2032
- Figure 16: Middle East and Africa Dried Blood Spot Card Market Volume (K Unit), by Country 2024 & 2032
- Figure 17: Middle East and Africa Dried Blood Spot Card Market Revenue Share (%), by Country 2024 & 2032
- Figure 18: Middle East and Africa Dried Blood Spot Card Market Volume Share (%), by Country 2024 & 2032
- Figure 19: South America Dried Blood Spot Card Market Revenue (Million), by Country 2024 & 2032
- Figure 20: South America Dried Blood Spot Card Market Volume (K Unit), by Country 2024 & 2032
- Figure 21: South America Dried Blood Spot Card Market Revenue Share (%), by Country 2024 & 2032
- Figure 22: South America Dried Blood Spot Card Market Volume Share (%), by Country 2024 & 2032
- Figure 23: North America Dried Blood Spot Card Market Revenue (Million), by Card Type 2024 & 2032
- Figure 24: North America Dried Blood Spot Card Market Volume (K Unit), by Card Type 2024 & 2032
- Figure 25: North America Dried Blood Spot Card Market Revenue Share (%), by Card Type 2024 & 2032
- Figure 26: North America Dried Blood Spot Card Market Volume Share (%), by Card Type 2024 & 2032
- Figure 27: North America Dried Blood Spot Card Market Revenue (Million), by Application 2024 & 2032
- Figure 28: North America Dried Blood Spot Card Market Volume (K Unit), by Application 2024 & 2032
- Figure 29: North America Dried Blood Spot Card Market Revenue Share (%), by Application 2024 & 2032
- Figure 30: North America Dried Blood Spot Card Market Volume Share (%), by Application 2024 & 2032
- Figure 31: North America Dried Blood Spot Card Market Revenue (Million), by Country 2024 & 2032
- Figure 32: North America Dried Blood Spot Card Market Volume (K Unit), by Country 2024 & 2032
- Figure 33: North America Dried Blood Spot Card Market Revenue Share (%), by Country 2024 & 2032
- Figure 34: North America Dried Blood Spot Card Market Volume Share (%), by Country 2024 & 2032
- Figure 35: Europe Dried Blood Spot Card Market Revenue (Million), by Card Type 2024 & 2032
- Figure 36: Europe Dried Blood Spot Card Market Volume (K Unit), by Card Type 2024 & 2032
- Figure 37: Europe Dried Blood Spot Card Market Revenue Share (%), by Card Type 2024 & 2032
- Figure 38: Europe Dried Blood Spot Card Market Volume Share (%), by Card Type 2024 & 2032
- Figure 39: Europe Dried Blood Spot Card Market Revenue (Million), by Application 2024 & 2032
- Figure 40: Europe Dried Blood Spot Card Market Volume (K Unit), by Application 2024 & 2032
- Figure 41: Europe Dried Blood Spot Card Market Revenue Share (%), by Application 2024 & 2032
- Figure 42: Europe Dried Blood Spot Card Market Volume Share (%), by Application 2024 & 2032
- Figure 43: Europe Dried Blood Spot Card Market Revenue (Million), by Country 2024 & 2032
- Figure 44: Europe Dried Blood Spot Card Market Volume (K Unit), by Country 2024 & 2032
- Figure 45: Europe Dried Blood Spot Card Market Revenue Share (%), by Country 2024 & 2032
- Figure 46: Europe Dried Blood Spot Card Market Volume Share (%), by Country 2024 & 2032
- Figure 47: Asia Pacific Dried Blood Spot Card Market Revenue (Million), by Card Type 2024 & 2032
- Figure 48: Asia Pacific Dried Blood Spot Card Market Volume (K Unit), by Card Type 2024 & 2032
- Figure 49: Asia Pacific Dried Blood Spot Card Market Revenue Share (%), by Card Type 2024 & 2032
- Figure 50: Asia Pacific Dried Blood Spot Card Market Volume Share (%), by Card Type 2024 & 2032
- Figure 51: Asia Pacific Dried Blood Spot Card Market Revenue (Million), by Application 2024 & 2032
- Figure 52: Asia Pacific Dried Blood Spot Card Market Volume (K Unit), by Application 2024 & 2032
- Figure 53: Asia Pacific Dried Blood Spot Card Market Revenue Share (%), by Application 2024 & 2032
- Figure 54: Asia Pacific Dried Blood Spot Card Market Volume Share (%), by Application 2024 & 2032
- Figure 55: Asia Pacific Dried Blood Spot Card Market Revenue (Million), by Country 2024 & 2032
- Figure 56: Asia Pacific Dried Blood Spot Card Market Volume (K Unit), by Country 2024 & 2032
- Figure 57: Asia Pacific Dried Blood Spot Card Market Revenue Share (%), by Country 2024 & 2032
- Figure 58: Asia Pacific Dried Blood Spot Card Market Volume Share (%), by Country 2024 & 2032
- Figure 59: Middle East and Africa Dried Blood Spot Card Market Revenue (Million), by Card Type 2024 & 2032
- Figure 60: Middle East and Africa Dried Blood Spot Card Market Volume (K Unit), by Card Type 2024 & 2032
- Figure 61: Middle East and Africa Dried Blood Spot Card Market Revenue Share (%), by Card Type 2024 & 2032
- Figure 62: Middle East and Africa Dried Blood Spot Card Market Volume Share (%), by Card Type 2024 & 2032
- Figure 63: Middle East and Africa Dried Blood Spot Card Market Revenue (Million), by Application 2024 & 2032
- Figure 64: Middle East and Africa Dried Blood Spot Card Market Volume (K Unit), by Application 2024 & 2032
- Figure 65: Middle East and Africa Dried Blood Spot Card Market Revenue Share (%), by Application 2024 & 2032
- Figure 66: Middle East and Africa Dried Blood Spot Card Market Volume Share (%), by Application 2024 & 2032
- Figure 67: Middle East and Africa Dried Blood Spot Card Market Revenue (Million), by Country 2024 & 2032
- Figure 68: Middle East and Africa Dried Blood Spot Card Market Volume (K Unit), by Country 2024 & 2032
- Figure 69: Middle East and Africa Dried Blood Spot Card Market Revenue Share (%), by Country 2024 & 2032
- Figure 70: Middle East and Africa Dried Blood Spot Card Market Volume Share (%), by Country 2024 & 2032
- Figure 71: South America Dried Blood Spot Card Market Revenue (Million), by Card Type 2024 & 2032
- Figure 72: South America Dried Blood Spot Card Market Volume (K Unit), by Card Type 2024 & 2032
- Figure 73: South America Dried Blood Spot Card Market Revenue Share (%), by Card Type 2024 & 2032
- Figure 74: South America Dried Blood Spot Card Market Volume Share (%), by Card Type 2024 & 2032
- Figure 75: South America Dried Blood Spot Card Market Revenue (Million), by Application 2024 & 2032
- Figure 76: South America Dried Blood Spot Card Market Volume (K Unit), by Application 2024 & 2032
- Figure 77: South America Dried Blood Spot Card Market Revenue Share (%), by Application 2024 & 2032
- Figure 78: South America Dried Blood Spot Card Market Volume Share (%), by Application 2024 & 2032
- Figure 79: South America Dried Blood Spot Card Market Revenue (Million), by Country 2024 & 2032
- Figure 80: South America Dried Blood Spot Card Market Volume (K Unit), by Country 2024 & 2032
- Figure 81: South America Dried Blood Spot Card Market Revenue Share (%), by Country 2024 & 2032
- Figure 82: South America Dried Blood Spot Card Market Volume Share (%), by Country 2024 & 2032
List of Tables
- Table 1: Global Dried Blood Spot Card Market Revenue Million Forecast, by Region 2019 & 2032
- Table 2: Global Dried Blood Spot Card Market Volume K Unit Forecast, by Region 2019 & 2032
- Table 3: Global Dried Blood Spot Card Market Revenue Million Forecast, by Card Type 2019 & 2032
- Table 4: Global Dried Blood Spot Card Market Volume K Unit Forecast, by Card Type 2019 & 2032
- Table 5: Global Dried Blood Spot Card Market Revenue Million Forecast, by Application 2019 & 2032
- Table 6: Global Dried Blood Spot Card Market Volume K Unit Forecast, by Application 2019 & 2032
- Table 7: Global Dried Blood Spot Card Market Revenue Million Forecast, by Region 2019 & 2032
- Table 8: Global Dried Blood Spot Card Market Volume K Unit Forecast, by Region 2019 & 2032
- Table 9: Global Dried Blood Spot Card Market Revenue Million Forecast, by Country 2019 & 2032
- Table 10: Global Dried Blood Spot Card Market Volume K Unit Forecast, by Country 2019 & 2032
- Table 11: United States Dried Blood Spot Card Market Revenue (Million) Forecast, by Application 2019 & 2032
- Table 12: United States Dried Blood Spot Card Market Volume (K Unit) Forecast, by Application 2019 & 2032
- Table 13: Canada Dried Blood Spot Card Market Revenue (Million) Forecast, by Application 2019 & 2032
- Table 14: Canada Dried Blood Spot Card Market Volume (K Unit) Forecast, by Application 2019 & 2032
- Table 15: Mexico Dried Blood Spot Card Market Revenue (Million) Forecast, by Application 2019 & 2032
- Table 16: Mexico Dried Blood Spot Card Market Volume (K Unit) Forecast, by Application 2019 & 2032
- Table 17: Global Dried Blood Spot Card Market Revenue Million Forecast, by Country 2019 & 2032
- Table 18: Global Dried Blood Spot Card Market Volume K Unit Forecast, by Country 2019 & 2032
- Table 19: Germany Dried Blood Spot Card Market Revenue (Million) Forecast, by Application 2019 & 2032
- Table 20: Germany Dried Blood Spot Card Market Volume (K Unit) Forecast, by Application 2019 & 2032
- Table 21: United Kingdom Dried Blood Spot Card Market Revenue (Million) Forecast, by Application 2019 & 2032
- Table 22: United Kingdom Dried Blood Spot Card Market Volume (K Unit) Forecast, by Application 2019 & 2032
- Table 23: France Dried Blood Spot Card Market Revenue (Million) Forecast, by Application 2019 & 2032
- Table 24: France Dried Blood Spot Card Market Volume (K Unit) Forecast, by Application 2019 & 2032
- Table 25: Italy Dried Blood Spot Card Market Revenue (Million) Forecast, by Application 2019 & 2032
- Table 26: Italy Dried Blood Spot Card Market Volume (K Unit) Forecast, by Application 2019 & 2032
- Table 27: Spain Dried Blood Spot Card Market Revenue (Million) Forecast, by Application 2019 & 2032
- Table 28: Spain Dried Blood Spot Card Market Volume (K Unit) Forecast, by Application 2019 & 2032
- Table 29: Rest of Europe Dried Blood Spot Card Market Revenue (Million) Forecast, by Application 2019 & 2032
- Table 30: Rest of Europe Dried Blood Spot Card Market Volume (K Unit) Forecast, by Application 2019 & 2032
- Table 31: Global Dried Blood Spot Card Market Revenue Million Forecast, by Country 2019 & 2032
- Table 32: Global Dried Blood Spot Card Market Volume K Unit Forecast, by Country 2019 & 2032
- Table 33: China Dried Blood Spot Card Market Revenue (Million) Forecast, by Application 2019 & 2032
- Table 34: China Dried Blood Spot Card Market Volume (K Unit) Forecast, by Application 2019 & 2032
- Table 35: Japan Dried Blood Spot Card Market Revenue (Million) Forecast, by Application 2019 & 2032
- Table 36: Japan Dried Blood Spot Card Market Volume (K Unit) Forecast, by Application 2019 & 2032
- Table 37: India Dried Blood Spot Card Market Revenue (Million) Forecast, by Application 2019 & 2032
- Table 38: India Dried Blood Spot Card Market Volume (K Unit) Forecast, by Application 2019 & 2032
- Table 39: Australia Dried Blood Spot Card Market Revenue (Million) Forecast, by Application 2019 & 2032
- Table 40: Australia Dried Blood Spot Card Market Volume (K Unit) Forecast, by Application 2019 & 2032
- Table 41: South Korea Dried Blood Spot Card Market Revenue (Million) Forecast, by Application 2019 & 2032
- Table 42: South Korea Dried Blood Spot Card Market Volume (K Unit) Forecast, by Application 2019 & 2032
- Table 43: Rest of Asia Pacific Dried Blood Spot Card Market Revenue (Million) Forecast, by Application 2019 & 2032
- Table 44: Rest of Asia Pacific Dried Blood Spot Card Market Volume (K Unit) Forecast, by Application 2019 & 2032
- Table 45: Global Dried Blood Spot Card Market Revenue Million Forecast, by Country 2019 & 2032
- Table 46: Global Dried Blood Spot Card Market Volume K Unit Forecast, by Country 2019 & 2032
- Table 47: GCC Dried Blood Spot Card Market Revenue (Million) Forecast, by Application 2019 & 2032
- Table 48: GCC Dried Blood Spot Card Market Volume (K Unit) Forecast, by Application 2019 & 2032
- Table 49: South Africa Dried Blood Spot Card Market Revenue (Million) Forecast, by Application 2019 & 2032
- Table 50: South Africa Dried Blood Spot Card Market Volume (K Unit) Forecast, by Application 2019 & 2032
- Table 51: Rest of Middle East and Africa Dried Blood Spot Card Market Revenue (Million) Forecast, by Application 2019 & 2032
- Table 52: Rest of Middle East and Africa Dried Blood Spot Card Market Volume (K Unit) Forecast, by Application 2019 & 2032
- Table 53: Global Dried Blood Spot Card Market Revenue Million Forecast, by Country 2019 & 2032
- Table 54: Global Dried Blood Spot Card Market Volume K Unit Forecast, by Country 2019 & 2032
- Table 55: Brazil Dried Blood Spot Card Market Revenue (Million) Forecast, by Application 2019 & 2032
- Table 56: Brazil Dried Blood Spot Card Market Volume (K Unit) Forecast, by Application 2019 & 2032
- Table 57: Argentina Dried Blood Spot Card Market Revenue (Million) Forecast, by Application 2019 & 2032
- Table 58: Argentina Dried Blood Spot Card Market Volume (K Unit) Forecast, by Application 2019 & 2032
- Table 59: Rest of South America Dried Blood Spot Card Market Revenue (Million) Forecast, by Application 2019 & 2032
- Table 60: Rest of South America Dried Blood Spot Card Market Volume (K Unit) Forecast, by Application 2019 & 2032
- Table 61: Global Dried Blood Spot Card Market Revenue Million Forecast, by Card Type 2019 & 2032
- Table 62: Global Dried Blood Spot Card Market Volume K Unit Forecast, by Card Type 2019 & 2032
- Table 63: Global Dried Blood Spot Card Market Revenue Million Forecast, by Application 2019 & 2032
- Table 64: Global Dried Blood Spot Card Market Volume K Unit Forecast, by Application 2019 & 2032
- Table 65: Global Dried Blood Spot Card Market Revenue Million Forecast, by Country 2019 & 2032
- Table 66: Global Dried Blood Spot Card Market Volume K Unit Forecast, by Country 2019 & 2032
- Table 67: United States Dried Blood Spot Card Market Revenue (Million) Forecast, by Application 2019 & 2032
- Table 68: United States Dried Blood Spot Card Market Volume (K Unit) Forecast, by Application 2019 & 2032
- Table 69: Canada Dried Blood Spot Card Market Revenue (Million) Forecast, by Application 2019 & 2032
- Table 70: Canada Dried Blood Spot Card Market Volume (K Unit) Forecast, by Application 2019 & 2032
- Table 71: Mexico Dried Blood Spot Card Market Revenue (Million) Forecast, by Application 2019 & 2032
- Table 72: Mexico Dried Blood Spot Card Market Volume (K Unit) Forecast, by Application 2019 & 2032
- Table 73: Global Dried Blood Spot Card Market Revenue Million Forecast, by Card Type 2019 & 2032
- Table 74: Global Dried Blood Spot Card Market Volume K Unit Forecast, by Card Type 2019 & 2032
- Table 75: Global Dried Blood Spot Card Market Revenue Million Forecast, by Application 2019 & 2032
- Table 76: Global Dried Blood Spot Card Market Volume K Unit Forecast, by Application 2019 & 2032
- Table 77: Global Dried Blood Spot Card Market Revenue Million Forecast, by Country 2019 & 2032
- Table 78: Global Dried Blood Spot Card Market Volume K Unit Forecast, by Country 2019 & 2032
- Table 79: Germany Dried Blood Spot Card Market Revenue (Million) Forecast, by Application 2019 & 2032
- Table 80: Germany Dried Blood Spot Card Market Volume (K Unit) Forecast, by Application 2019 & 2032
- Table 81: United Kingdom Dried Blood Spot Card Market Revenue (Million) Forecast, by Application 2019 & 2032
- Table 82: United Kingdom Dried Blood Spot Card Market Volume (K Unit) Forecast, by Application 2019 & 2032
- Table 83: France Dried Blood Spot Card Market Revenue (Million) Forecast, by Application 2019 & 2032
- Table 84: France Dried Blood Spot Card Market Volume (K Unit) Forecast, by Application 2019 & 2032
- Table 85: Italy Dried Blood Spot Card Market Revenue (Million) Forecast, by Application 2019 & 2032
- Table 86: Italy Dried Blood Spot Card Market Volume (K Unit) Forecast, by Application 2019 & 2032
- Table 87: Spain Dried Blood Spot Card Market Revenue (Million) Forecast, by Application 2019 & 2032
- Table 88: Spain Dried Blood Spot Card Market Volume (K Unit) Forecast, by Application 2019 & 2032
- Table 89: Rest of Europe Dried Blood Spot Card Market Revenue (Million) Forecast, by Application 2019 & 2032
- Table 90: Rest of Europe Dried Blood Spot Card Market Volume (K Unit) Forecast, by Application 2019 & 2032
- Table 91: Global Dried Blood Spot Card Market Revenue Million Forecast, by Card Type 2019 & 2032
- Table 92: Global Dried Blood Spot Card Market Volume K Unit Forecast, by Card Type 2019 & 2032
- Table 93: Global Dried Blood Spot Card Market Revenue Million Forecast, by Application 2019 & 2032
- Table 94: Global Dried Blood Spot Card Market Volume K Unit Forecast, by Application 2019 & 2032
- Table 95: Global Dried Blood Spot Card Market Revenue Million Forecast, by Country 2019 & 2032
- Table 96: Global Dried Blood Spot Card Market Volume K Unit Forecast, by Country 2019 & 2032
- Table 97: China Dried Blood Spot Card Market Revenue (Million) Forecast, by Application 2019 & 2032
- Table 98: China Dried Blood Spot Card Market Volume (K Unit) Forecast, by Application 2019 & 2032
- Table 99: Japan Dried Blood Spot Card Market Revenue (Million) Forecast, by Application 2019 & 2032
- Table 100: Japan Dried Blood Spot Card Market Volume (K Unit) Forecast, by Application 2019 & 2032
- Table 101: India Dried Blood Spot Card Market Revenue (Million) Forecast, by Application 2019 & 2032
- Table 102: India Dried Blood Spot Card Market Volume (K Unit) Forecast, by Application 2019 & 2032
- Table 103: Australia Dried Blood Spot Card Market Revenue (Million) Forecast, by Application 2019 & 2032
- Table 104: Australia Dried Blood Spot Card Market Volume (K Unit) Forecast, by Application 2019 & 2032
- Table 105: South Korea Dried Blood Spot Card Market Revenue (Million) Forecast, by Application 2019 & 2032
- Table 106: South Korea Dried Blood Spot Card Market Volume (K Unit) Forecast, by Application 2019 & 2032
- Table 107: Rest of Asia Pacific Dried Blood Spot Card Market Revenue (Million) Forecast, by Application 2019 & 2032
- Table 108: Rest of Asia Pacific Dried Blood Spot Card Market Volume (K Unit) Forecast, by Application 2019 & 2032
- Table 109: Global Dried Blood Spot Card Market Revenue Million Forecast, by Card Type 2019 & 2032
- Table 110: Global Dried Blood Spot Card Market Volume K Unit Forecast, by Card Type 2019 & 2032
- Table 111: Global Dried Blood Spot Card Market Revenue Million Forecast, by Application 2019 & 2032
- Table 112: Global Dried Blood Spot Card Market Volume K Unit Forecast, by Application 2019 & 2032
- Table 113: Global Dried Blood Spot Card Market Revenue Million Forecast, by Country 2019 & 2032
- Table 114: Global Dried Blood Spot Card Market Volume K Unit Forecast, by Country 2019 & 2032
- Table 115: GCC Dried Blood Spot Card Market Revenue (Million) Forecast, by Application 2019 & 2032
- Table 116: GCC Dried Blood Spot Card Market Volume (K Unit) Forecast, by Application 2019 & 2032
- Table 117: South Africa Dried Blood Spot Card Market Revenue (Million) Forecast, by Application 2019 & 2032
- Table 118: South Africa Dried Blood Spot Card Market Volume (K Unit) Forecast, by Application 2019 & 2032
- Table 119: Rest of Middle East and Africa Dried Blood Spot Card Market Revenue (Million) Forecast, by Application 2019 & 2032
- Table 120: Rest of Middle East and Africa Dried Blood Spot Card Market Volume (K Unit) Forecast, by Application 2019 & 2032
- Table 121: Global Dried Blood Spot Card Market Revenue Million Forecast, by Card Type 2019 & 2032
- Table 122: Global Dried Blood Spot Card Market Volume K Unit Forecast, by Card Type 2019 & 2032
- Table 123: Global Dried Blood Spot Card Market Revenue Million Forecast, by Application 2019 & 2032
- Table 124: Global Dried Blood Spot Card Market Volume K Unit Forecast, by Application 2019 & 2032
- Table 125: Global Dried Blood Spot Card Market Revenue Million Forecast, by Country 2019 & 2032
- Table 126: Global Dried Blood Spot Card Market Volume K Unit Forecast, by Country 2019 & 2032
- Table 127: Brazil Dried Blood Spot Card Market Revenue (Million) Forecast, by Application 2019 & 2032
- Table 128: Brazil Dried Blood Spot Card Market Volume (K Unit) Forecast, by Application 2019 & 2032
- Table 129: Argentina Dried Blood Spot Card Market Revenue (Million) Forecast, by Application 2019 & 2032
- Table 130: Argentina Dried Blood Spot Card Market Volume (K Unit) Forecast, by Application 2019 & 2032
- Table 131: Rest of South America Dried Blood Spot Card Market Revenue (Million) Forecast, by Application 2019 & 2032
- Table 132: Rest of South America Dried Blood Spot Card Market Volume (K Unit) Forecast, by Application 2019 & 2032
Frequently Asked Questions
1. What is the projected Compound Annual Growth Rate (CAGR) of the Dried Blood Spot Card Market?
The projected CAGR is approximately 3.10%.
2. Which companies are prominent players in the Dried Blood Spot Card Market?
Key companies in the market include Shimadzu Scientific Instruments, Gentegra LLC, CENTOGENE N V, F Hoffmann-La Roche Ltd, Thomas Scientific, Hemaxis, Lipomic Healthcare, Eastern Business Forms Inc, ARCHIMEDlife, QIAGEN, PerkinElmer, Ahlstrom-Munksjö.
3. What are the main segments of the Dried Blood Spot Card Market?
The market segments include Card Type, Application.
4. Can you provide details about the market size?
The market size is estimated to be USD XX Million as of 2022.
5. What are some drivers contributing to market growth?
Increasing Use of DBS Cards in Diagnostic Testing; Rise of Forensic Toxicology Applications.
6. What are the notable trends driving market growth?
Newborn Screening Segment is Expected to Witness Considerable Growth Over the Forecast Period.
7. Are there any restraints impacting market growth?
Contamination Caused in DBS Collection Cards.
8. Can you provide examples of recent developments in the market?
In August 2022, Boston Heart Diagnostics Corporation launched a broad range of tests with a dried blood spot collection for a broad range of applications including cardiovascular risk factors, type 2 diabetes, and wellness assessments for cognitive, nutritional, women's, and men's health.
9. What pricing options are available for accessing the report?
Pricing options include single-user, multi-user, and enterprise licenses priced at USD 4750, USD 5250, and USD 8750 respectively.
10. Is the market size provided in terms of value or volume?
The market size is provided in terms of value, measured in Million and volume, measured in K Unit.
11. Are there any specific market keywords associated with the report?
Yes, the market keyword associated with the report is "Dried Blood Spot Card Market," which aids in identifying and referencing the specific market segment covered.
12. How do I determine which pricing option suits my needs best?
The pricing options vary based on user requirements and access needs. Individual users may opt for single-user licenses, while businesses requiring broader access may choose multi-user or enterprise licenses for cost-effective access to the report.
13. Are there any additional resources or data provided in the Dried Blood Spot Card Market report?
While the report offers comprehensive insights, it's advisable to review the specific contents or supplementary materials provided to ascertain if additional resources or data are available.
14. How can I stay updated on further developments or reports in the Dried Blood Spot Card Market?
To stay informed about further developments, trends, and reports in the Dried Blood Spot Card Market, consider subscribing to industry newsletters, following relevant companies and organizations, or regularly checking reputable industry news sources and publications.
Methodology
Step 1 - Identification of Relevant Samples Size from Population Database


Step 2 - Approaches for Defining Global Market Size (Value, Volume* & Price*)

Note*: In applicable scenarios
Step 3 - Data Sources
Primary Research
- Web Analytics
- Survey Reports
- Research Institute
- Latest Research Reports
- Opinion Leaders
Secondary Research
- Annual Reports
- White Paper
- Latest Press Release
- Industry Association
- Paid Database
- Investor Presentations

Step 4 - Data Triangulation
Involves using different sources of information in order to increase the validity of a study
These sources are likely to be stakeholders in a program - participants, other researchers, program staff, other community members, and so on.
Then we put all data in single framework & apply various statistical tools to find out the dynamic on the market.
During the analysis stage, feedback from the stakeholder groups would be compared to determine areas of agreement as well as areas of divergence


