
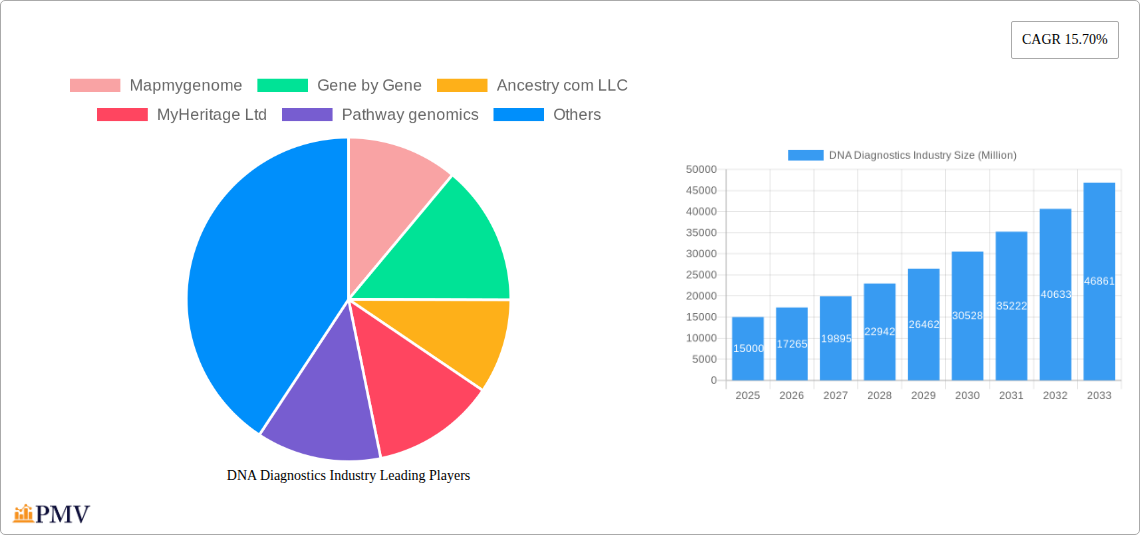
Key Insights
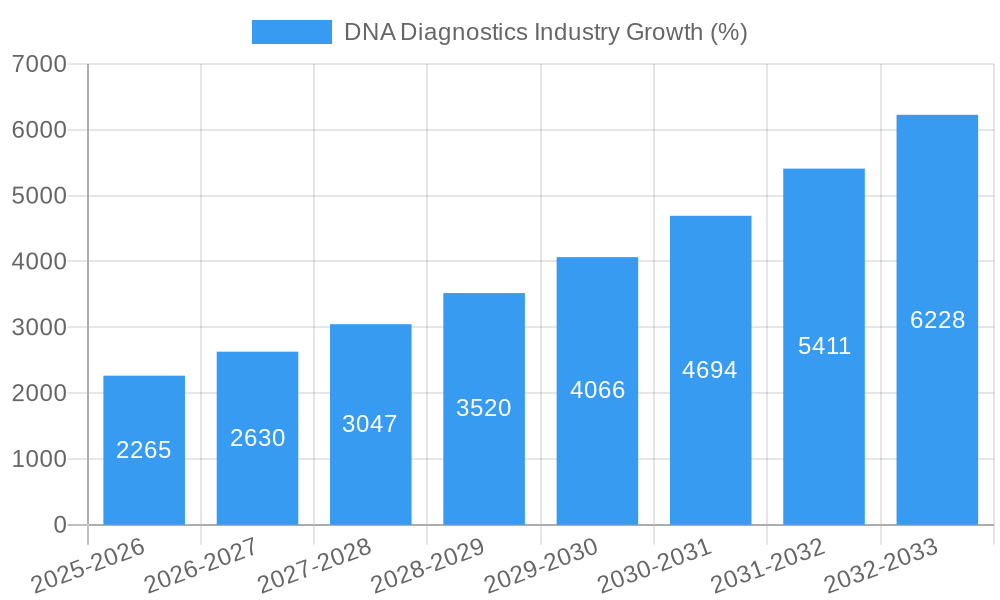
The global DNA diagnostics market is experiencing robust growth, driven by increasing awareness of genetic predispositions to diseases, advancements in genetic testing technologies, and the rising adoption of personalized medicine approaches. The market's Compound Annual Growth Rate (CAGR) of 15.70% from 2019 to 2024 suggests a significant expansion, which is projected to continue into the forecast period (2025-2033). This growth is fueled by several key factors. Firstly, the decreasing cost of sequencing and genotyping technologies makes DNA testing more accessible to a broader population. Secondly, the expanding applications of DNA diagnostics beyond ancestry testing, encompassing areas like health & fitness monitoring and pharmacogenomics, significantly broadens the market's potential. Finally, the increasing integration of DNA diagnostics into healthcare systems, coupled with supportive government initiatives promoting preventative healthcare, further accelerates market expansion. The market is segmented by sample type (saliva, cheek swab, etc.) and application (genetic relatedness, health & fitness, ancestry testing, other applications), with significant growth projected across all segments, particularly in the health and fitness sector driven by consumer demand for proactive health management. Major players such as 23andMe, Ancestry.com, and MyHeritage are driving innovation and market penetration, leveraging their established brands and technological expertise to capture market share.
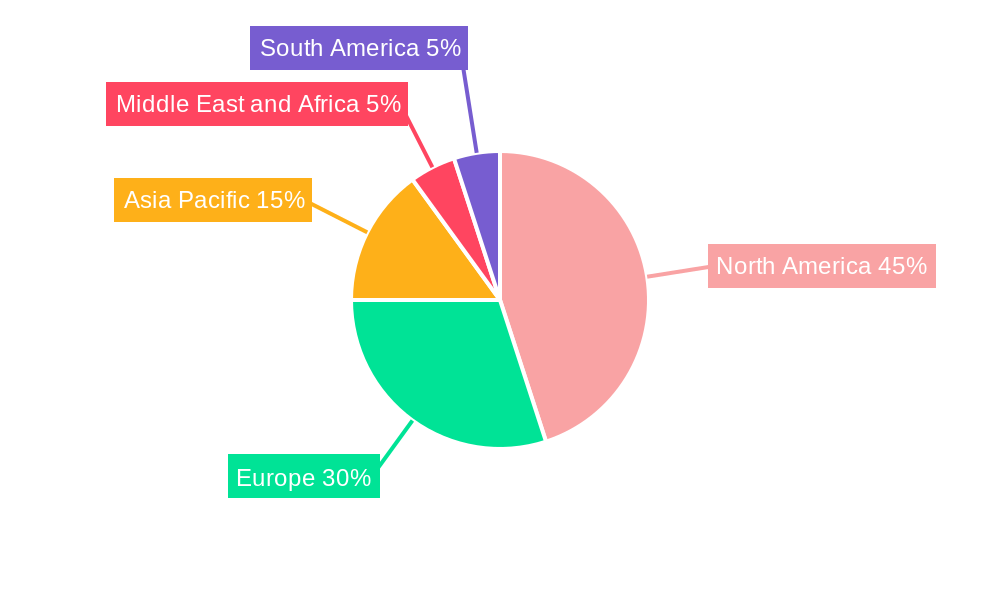
The geographic distribution of the DNA diagnostics market is largely concentrated in North America and Europe, due to higher disposable incomes, advanced healthcare infrastructure, and early adoption of these technologies. However, emerging economies in Asia-Pacific and other regions are witnessing rapid growth, propelled by rising healthcare expenditure and increasing awareness of genetic diseases. While some restraints exist, such as concerns surrounding data privacy and ethical considerations, the overall market outlook remains overwhelmingly positive. The continuous advancements in sequencing technologies, the expanding applications of DNA diagnostics, and the increasing accessibility of testing services are expected to drive sustained market growth throughout the forecast period. We project a continued high CAGR throughout the forecast period based on the strong current growth and the factors mentioned above.
DNA Diagnostics Industry: Market Report 2019-2033
This comprehensive report provides a detailed analysis of the DNA Diagnostics industry, encompassing market structure, competitive dynamics, growth drivers, challenges, and future outlook. The study period covers 2019-2033, with 2025 as the base and estimated year. The forecast period spans 2025-2033, and the historical period covers 2019-2024. The report segments the market by sample type (Saliva, Cheek Swab) and application (Genetic Relatedness, Health & Fitness, Ancestry Testing, Other Applications), offering granular insights into market size, growth projections, and competitive landscapes. The total market value is estimated at xx Million in 2025 and is projected to reach xx Million by 2033.
DNA Diagnostics Industry Market Structure & Competitive Dynamics
The DNA diagnostics market is characterized by a moderately concentrated structure, with several key players vying for market share. Market concentration is influenced by factors such as technological advancements, regulatory approvals, and consumer preferences. The industry's innovation ecosystem is dynamic, with continuous developments in sequencing technologies, data analytics, and interpretation methodologies. Regulatory frameworks vary across different geographies, impacting market access and product approvals. Substitutes for DNA diagnostics are limited; however, advancements in other diagnostic technologies may pose some competitive pressure. End-user trends, driven by increasing health awareness and accessibility of DTC tests, fuel market growth. M&A activities have played a role in shaping market dynamics, with deal values ranging from xx Million to xx Million in recent years.
- Market Share: The top 5 players hold an estimated xx% of the global market share in 2025.
- M&A Activity: A significant number of mergers and acquisitions have been observed in the historical period, with an average deal value of approximately xx Million. These activities reflect the strategic importance of market consolidation and expansion.
DNA Diagnostics Industry Industry Trends & Insights
The DNA diagnostics market exhibits robust growth, driven by multiple factors. Technological advancements, particularly in next-generation sequencing (NGS), have significantly lowered costs and increased throughput, making DNA testing more accessible. Increasing consumer awareness of genetic predispositions to diseases and the growing popularity of personalized medicine are key market growth drivers. The CAGR for the forecast period is estimated at xx%, indicating substantial market expansion. The market penetration rate, currently at xx%, is projected to rise to xx% by 2033. Consumer preferences are shifting towards convenient, at-home testing kits, driving the growth of the direct-to-consumer (DTC) segment. Competitive dynamics are marked by continuous innovation, strategic partnerships, and price competition among market players.
Dominant Markets & Segments in DNA Diagnostics Industry
The North American region holds a dominant position in the global DNA diagnostics market, driven by factors including high healthcare expenditure, robust technological infrastructure, and favorable regulatory policies. Within applications, ancestry testing is currently the largest segment, followed by health & fitness applications. Saliva samples dominate the sample type segment due to ease of collection and non-invasive nature.
- Key Drivers for North America:
- High disposable income and increased healthcare spending.
- Stringent regulatory frameworks that ensure quality and safety.
- Strong technological infrastructure and research capabilities.
- Saliva Sample Dominance: The convenience and non-invasive nature of saliva samples drives the segment's popularity.
- Ancestry Testing Market Leadership: Growing interest in genealogy and heritage fuels demand for ancestry testing services.
DNA Diagnostics Industry Product Innovations
Recent innovations include advancements in NGS technology, enabling faster, more accurate, and cost-effective DNA sequencing. The development of user-friendly at-home testing kits has enhanced accessibility and convenience for consumers. The integration of AI and machine learning into data analysis facilitates better interpretation and personalized reports, improving the overall value proposition. These developments are tailored to meet the growing demand for convenient, affordable, and informative genetic testing services.
Report Segmentation & Scope
Sample Type: The report segments the market based on sample type, including Saliva and Cheek Swab. Saliva samples are projected to maintain a larger market share due to their ease of collection and non-invasive nature. The Cheek Swab segment is expected to witness moderate growth, driven by its continued use in specific clinical settings.
Application: The report segments the market by application, including Genetic Relatedness, Health & Fitness, Ancestry Testing, and Other Applications. Ancestry testing currently dominates, but health and fitness applications are showing rapid growth due to the increasing focus on personalized healthcare.
Each segment’s market size, growth rate, and competitive dynamics are comprehensively analyzed in the report.
Key Drivers of DNA Diagnostics Industry Growth
Several factors drive the growth of the DNA diagnostics industry. These include technological advancements in DNA sequencing, falling costs, and increasing accessibility of DTC testing. Rising consumer awareness about genetic predispositions to diseases, coupled with the growing interest in personalized medicine, strongly influence market expansion. Furthermore, favorable regulatory environments in key markets accelerate adoption.
Challenges in the DNA Diagnostics Industry Sector
Challenges include the high cost of advanced technologies, regulatory hurdles related to data privacy and interpretation of results, potential supply chain disruptions, and fierce competition among established players and new entrants. The interpretation of genetic data and the potential for misinterpretation or miscommunication pose significant challenges. These hurdles impact the affordability and widespread accessibility of DNA diagnostic services.
Leading Players in the DNA Diagnostics Industry Market
- Mapmygenome
- Gene by Gene
- Ancestry.com LLC
- MyHeritage Ltd
- Pathway genomics
- Helix OpCo LLC
- Genesis Healthcare Co
- 23andMe
- Living DNA Ltd
- Veritas Genetics
- Futura Genetics
- Identigene (DNA Diagnostics Center)
Key Developments in DNA Diagnostics Industry Sector
- May 2021: South Korean telecommunications companies partnered with DTC genetic testing companies to deliver results directly to consumers' mobile devices.
- September 2021: MedGenome Labs launched a DTC genetic screening test brand, Genessense.
These developments highlight the increasing integration of technology and the expansion of DTC testing market access.
Strategic DNA Diagnostics Industry Market Outlook
The future of the DNA diagnostics industry is bright, with significant growth potential driven by continuous technological innovation, decreasing costs, and expanding applications. Strategic opportunities lie in developing user-friendly, cost-effective tests, focusing on personalized medicine, and strengthening data security and privacy protocols. Collaborations between technology companies and healthcare providers are likely to reshape the industry landscape. The expansion into emerging markets also offers considerable growth potential.
DNA Diagnostics Industry Segmentation
-
1. Sample Type
- 1.1. Saliva
- 1.2. Cheek Swab
-
2. Application
- 2.1. Genetic Relatedness
- 2.2. Health & Fitness
- 2.3. Ancestry Testing
- 2.4. Other Applications
DNA Diagnostics Industry Segmentation By Geography
-
1. North America
- 1.1. United States
- 1.2. Canada
- 1.3. Mexico
-
2. Europe
- 2.1. Germany
- 2.2. United Kingdom
- 2.3. France
- 2.4. Italy
- 2.5. Spain
- 2.6. Rest of Europe
-
3. Asia Pacific
- 3.1. China
- 3.2. Japan
- 3.3. India
- 3.4. Australia
- 3.5. South Korea
- 3.6. Rest of Asia Pacific
-
4. Middle East and Africa
- 4.1. GCC
- 4.2. South Africa
- 4.3. Rest of Middle East and Africa
-
5. South America
- 5.1. Brazil
- 5.2. Argentina
- 5.3. Rest of South America
DNA Diagnostics Industry REPORT HIGHLIGHTS
| Aspects | Details |
|---|---|
| Study Period | 2019-2033 |
| Base Year | 2024 |
| Estimated Year | 2025 |
| Forecast Period | 2025-2033 |
| Historical Period | 2019-2024 |
| Growth Rate | CAGR of 15.70% from 2019-2033 |
| Segmentation |
|
Table of Contents
- 1. Introduction
- 1.1. Research Scope
- 1.2. Market Segmentation
- 1.3. Research Methodology
- 1.4. Definitions and Assumptions
- 2. Executive Summary
- 2.1. Introduction
- 3. Market Dynamics
- 3.1. Introduction
- 3.2. Market Drivers
- 3.2.1. Increasing Demand for Paternity Testing & Increasing Number of Hereditary Diseases; Increasing Demand for Personalized DTC Genetic Services in Developed Countries
- 3.3. Market Restrains
- 3.3.1. Regulatory Challenges Pertaining to the Use of DTC Genetic Tests
- 3.4. Market Trends
- 3.4.1. Ancestry Testing Segment is Expected to Witness Growth Over the Forecast Period
- 4. Market Factor Analysis
- 4.1. Porters Five Forces
- 4.2. Supply/Value Chain
- 4.3. PESTEL analysis
- 4.4. Market Entropy
- 4.5. Patent/Trademark Analysis
- 5. Global DNA Diagnostics Industry Analysis, Insights and Forecast, 2019-2031
- 5.1. Market Analysis, Insights and Forecast - by Sample Type
- 5.1.1. Saliva
- 5.1.2. Cheek Swab
- 5.2. Market Analysis, Insights and Forecast - by Application
- 5.2.1. Genetic Relatedness
- 5.2.2. Health & Fitness
- 5.2.3. Ancestry Testing
- 5.2.4. Other Applications
- 5.3. Market Analysis, Insights and Forecast - by Region
- 5.3.1. North America
- 5.3.2. Europe
- 5.3.3. Asia Pacific
- 5.3.4. Middle East and Africa
- 5.3.5. South America
- 5.1. Market Analysis, Insights and Forecast - by Sample Type
- 6. North America DNA Diagnostics Industry Analysis, Insights and Forecast, 2019-2031
- 6.1. Market Analysis, Insights and Forecast - by Sample Type
- 6.1.1. Saliva
- 6.1.2. Cheek Swab
- 6.2. Market Analysis, Insights and Forecast - by Application
- 6.2.1. Genetic Relatedness
- 6.2.2. Health & Fitness
- 6.2.3. Ancestry Testing
- 6.2.4. Other Applications
- 6.1. Market Analysis, Insights and Forecast - by Sample Type
- 7. Europe DNA Diagnostics Industry Analysis, Insights and Forecast, 2019-2031
- 7.1. Market Analysis, Insights and Forecast - by Sample Type
- 7.1.1. Saliva
- 7.1.2. Cheek Swab
- 7.2. Market Analysis, Insights and Forecast - by Application
- 7.2.1. Genetic Relatedness
- 7.2.2. Health & Fitness
- 7.2.3. Ancestry Testing
- 7.2.4. Other Applications
- 7.1. Market Analysis, Insights and Forecast - by Sample Type
- 8. Asia Pacific DNA Diagnostics Industry Analysis, Insights and Forecast, 2019-2031
- 8.1. Market Analysis, Insights and Forecast - by Sample Type
- 8.1.1. Saliva
- 8.1.2. Cheek Swab
- 8.2. Market Analysis, Insights and Forecast - by Application
- 8.2.1. Genetic Relatedness
- 8.2.2. Health & Fitness
- 8.2.3. Ancestry Testing
- 8.2.4. Other Applications
- 8.1. Market Analysis, Insights and Forecast - by Sample Type
- 9. Middle East and Africa DNA Diagnostics Industry Analysis, Insights and Forecast, 2019-2031
- 9.1. Market Analysis, Insights and Forecast - by Sample Type
- 9.1.1. Saliva
- 9.1.2. Cheek Swab
- 9.2. Market Analysis, Insights and Forecast - by Application
- 9.2.1. Genetic Relatedness
- 9.2.2. Health & Fitness
- 9.2.3. Ancestry Testing
- 9.2.4. Other Applications
- 9.1. Market Analysis, Insights and Forecast - by Sample Type
- 10. South America DNA Diagnostics Industry Analysis, Insights and Forecast, 2019-2031
- 10.1. Market Analysis, Insights and Forecast - by Sample Type
- 10.1.1. Saliva
- 10.1.2. Cheek Swab
- 10.2. Market Analysis, Insights and Forecast - by Application
- 10.2.1. Genetic Relatedness
- 10.2.2. Health & Fitness
- 10.2.3. Ancestry Testing
- 10.2.4. Other Applications
- 10.1. Market Analysis, Insights and Forecast - by Sample Type
- 11. North America DNA Diagnostics Industry Analysis, Insights and Forecast, 2019-2031
- 11.1. Market Analysis, Insights and Forecast - By Country/Sub-region
- 11.1.1 United States
- 11.1.2 Canada
- 11.1.3 Mexico
- 12. Europe DNA Diagnostics Industry Analysis, Insights and Forecast, 2019-2031
- 12.1. Market Analysis, Insights and Forecast - By Country/Sub-region
- 12.1.1 Germany
- 12.1.2 United Kingdom
- 12.1.3 France
- 12.1.4 Italy
- 12.1.5 Spain
- 12.1.6 Rest of Europe
- 13. Asia Pacific DNA Diagnostics Industry Analysis, Insights and Forecast, 2019-2031
- 13.1. Market Analysis, Insights and Forecast - By Country/Sub-region
- 13.1.1 China
- 13.1.2 Japan
- 13.1.3 India
- 13.1.4 Australia
- 13.1.5 South Korea
- 13.1.6 Rest of Asia Pacific
- 14. Middle East and Africa DNA Diagnostics Industry Analysis, Insights and Forecast, 2019-2031
- 14.1. Market Analysis, Insights and Forecast - By Country/Sub-region
- 14.1.1 GCC
- 14.1.2 South Africa
- 14.1.3 Rest of Middle East and Africa
- 15. South America DNA Diagnostics Industry Analysis, Insights and Forecast, 2019-2031
- 15.1. Market Analysis, Insights and Forecast - By Country/Sub-region
- 15.1.1 Brazil
- 15.1.2 Argentina
- 15.1.3 Rest of South America
- 16. Competitive Analysis
- 16.1. Global Market Share Analysis 2024
- 16.2. Company Profiles
- 16.2.1 Mapmygenome
- 16.2.1.1. Overview
- 16.2.1.2. Products
- 16.2.1.3. SWOT Analysis
- 16.2.1.4. Recent Developments
- 16.2.1.5. Financials (Based on Availability)
- 16.2.2 Gene by Gene
- 16.2.2.1. Overview
- 16.2.2.2. Products
- 16.2.2.3. SWOT Analysis
- 16.2.2.4. Recent Developments
- 16.2.2.5. Financials (Based on Availability)
- 16.2.3 Ancestry com LLC
- 16.2.3.1. Overview
- 16.2.3.2. Products
- 16.2.3.3. SWOT Analysis
- 16.2.3.4. Recent Developments
- 16.2.3.5. Financials (Based on Availability)
- 16.2.4 MyHeritage Ltd
- 16.2.4.1. Overview
- 16.2.4.2. Products
- 16.2.4.3. SWOT Analysis
- 16.2.4.4. Recent Developments
- 16.2.4.5. Financials (Based on Availability)
- 16.2.5 Pathway genomics
- 16.2.5.1. Overview
- 16.2.5.2. Products
- 16.2.5.3. SWOT Analysis
- 16.2.5.4. Recent Developments
- 16.2.5.5. Financials (Based on Availability)
- 16.2.6 Helix OpCo LLC
- 16.2.6.1. Overview
- 16.2.6.2. Products
- 16.2.6.3. SWOT Analysis
- 16.2.6.4. Recent Developments
- 16.2.6.5. Financials (Based on Availability)
- 16.2.7 Genesis Healthcare Co
- 16.2.7.1. Overview
- 16.2.7.2. Products
- 16.2.7.3. SWOT Analysis
- 16.2.7.4. Recent Developments
- 16.2.7.5. Financials (Based on Availability)
- 16.2.8 23andMe
- 16.2.8.1. Overview
- 16.2.8.2. Products
- 16.2.8.3. SWOT Analysis
- 16.2.8.4. Recent Developments
- 16.2.8.5. Financials (Based on Availability)
- 16.2.9 Living DNA Ltd
- 16.2.9.1. Overview
- 16.2.9.2. Products
- 16.2.9.3. SWOT Analysis
- 16.2.9.4. Recent Developments
- 16.2.9.5. Financials (Based on Availability)
- 16.2.10 Veritas Genetics
- 16.2.10.1. Overview
- 16.2.10.2. Products
- 16.2.10.3. SWOT Analysis
- 16.2.10.4. Recent Developments
- 16.2.10.5. Financials (Based on Availability)
- 16.2.11 Futura Genetics
- 16.2.11.1. Overview
- 16.2.11.2. Products
- 16.2.11.3. SWOT Analysis
- 16.2.11.4. Recent Developments
- 16.2.11.5. Financials (Based on Availability)
- 16.2.12 Identigene (DNA Diagnostics Center)
- 16.2.12.1. Overview
- 16.2.12.2. Products
- 16.2.12.3. SWOT Analysis
- 16.2.12.4. Recent Developments
- 16.2.12.5. Financials (Based on Availability)
- 16.2.1 Mapmygenome
List of Figures
- Figure 1: Global DNA Diagnostics Industry Revenue Breakdown (Million, %) by Region 2024 & 2032
- Figure 2: Global DNA Diagnostics Industry Volume Breakdown (K Unit, %) by Region 2024 & 2032
- Figure 3: North America DNA Diagnostics Industry Revenue (Million), by Country 2024 & 2032
- Figure 4: North America DNA Diagnostics Industry Volume (K Unit), by Country 2024 & 2032
- Figure 5: North America DNA Diagnostics Industry Revenue Share (%), by Country 2024 & 2032
- Figure 6: North America DNA Diagnostics Industry Volume Share (%), by Country 2024 & 2032
- Figure 7: Europe DNA Diagnostics Industry Revenue (Million), by Country 2024 & 2032
- Figure 8: Europe DNA Diagnostics Industry Volume (K Unit), by Country 2024 & 2032
- Figure 9: Europe DNA Diagnostics Industry Revenue Share (%), by Country 2024 & 2032
- Figure 10: Europe DNA Diagnostics Industry Volume Share (%), by Country 2024 & 2032
- Figure 11: Asia Pacific DNA Diagnostics Industry Revenue (Million), by Country 2024 & 2032
- Figure 12: Asia Pacific DNA Diagnostics Industry Volume (K Unit), by Country 2024 & 2032
- Figure 13: Asia Pacific DNA Diagnostics Industry Revenue Share (%), by Country 2024 & 2032
- Figure 14: Asia Pacific DNA Diagnostics Industry Volume Share (%), by Country 2024 & 2032
- Figure 15: Middle East and Africa DNA Diagnostics Industry Revenue (Million), by Country 2024 & 2032
- Figure 16: Middle East and Africa DNA Diagnostics Industry Volume (K Unit), by Country 2024 & 2032
- Figure 17: Middle East and Africa DNA Diagnostics Industry Revenue Share (%), by Country 2024 & 2032
- Figure 18: Middle East and Africa DNA Diagnostics Industry Volume Share (%), by Country 2024 & 2032
- Figure 19: South America DNA Diagnostics Industry Revenue (Million), by Country 2024 & 2032
- Figure 20: South America DNA Diagnostics Industry Volume (K Unit), by Country 2024 & 2032
- Figure 21: South America DNA Diagnostics Industry Revenue Share (%), by Country 2024 & 2032
- Figure 22: South America DNA Diagnostics Industry Volume Share (%), by Country 2024 & 2032
- Figure 23: North America DNA Diagnostics Industry Revenue (Million), by Sample Type 2024 & 2032
- Figure 24: North America DNA Diagnostics Industry Volume (K Unit), by Sample Type 2024 & 2032
- Figure 25: North America DNA Diagnostics Industry Revenue Share (%), by Sample Type 2024 & 2032
- Figure 26: North America DNA Diagnostics Industry Volume Share (%), by Sample Type 2024 & 2032
- Figure 27: North America DNA Diagnostics Industry Revenue (Million), by Application 2024 & 2032
- Figure 28: North America DNA Diagnostics Industry Volume (K Unit), by Application 2024 & 2032
- Figure 29: North America DNA Diagnostics Industry Revenue Share (%), by Application 2024 & 2032
- Figure 30: North America DNA Diagnostics Industry Volume Share (%), by Application 2024 & 2032
- Figure 31: North America DNA Diagnostics Industry Revenue (Million), by Country 2024 & 2032
- Figure 32: North America DNA Diagnostics Industry Volume (K Unit), by Country 2024 & 2032
- Figure 33: North America DNA Diagnostics Industry Revenue Share (%), by Country 2024 & 2032
- Figure 34: North America DNA Diagnostics Industry Volume Share (%), by Country 2024 & 2032
- Figure 35: Europe DNA Diagnostics Industry Revenue (Million), by Sample Type 2024 & 2032
- Figure 36: Europe DNA Diagnostics Industry Volume (K Unit), by Sample Type 2024 & 2032
- Figure 37: Europe DNA Diagnostics Industry Revenue Share (%), by Sample Type 2024 & 2032
- Figure 38: Europe DNA Diagnostics Industry Volume Share (%), by Sample Type 2024 & 2032
- Figure 39: Europe DNA Diagnostics Industry Revenue (Million), by Application 2024 & 2032
- Figure 40: Europe DNA Diagnostics Industry Volume (K Unit), by Application 2024 & 2032
- Figure 41: Europe DNA Diagnostics Industry Revenue Share (%), by Application 2024 & 2032
- Figure 42: Europe DNA Diagnostics Industry Volume Share (%), by Application 2024 & 2032
- Figure 43: Europe DNA Diagnostics Industry Revenue (Million), by Country 2024 & 2032
- Figure 44: Europe DNA Diagnostics Industry Volume (K Unit), by Country 2024 & 2032
- Figure 45: Europe DNA Diagnostics Industry Revenue Share (%), by Country 2024 & 2032
- Figure 46: Europe DNA Diagnostics Industry Volume Share (%), by Country 2024 & 2032
- Figure 47: Asia Pacific DNA Diagnostics Industry Revenue (Million), by Sample Type 2024 & 2032
- Figure 48: Asia Pacific DNA Diagnostics Industry Volume (K Unit), by Sample Type 2024 & 2032
- Figure 49: Asia Pacific DNA Diagnostics Industry Revenue Share (%), by Sample Type 2024 & 2032
- Figure 50: Asia Pacific DNA Diagnostics Industry Volume Share (%), by Sample Type 2024 & 2032
- Figure 51: Asia Pacific DNA Diagnostics Industry Revenue (Million), by Application 2024 & 2032
- Figure 52: Asia Pacific DNA Diagnostics Industry Volume (K Unit), by Application 2024 & 2032
- Figure 53: Asia Pacific DNA Diagnostics Industry Revenue Share (%), by Application 2024 & 2032
- Figure 54: Asia Pacific DNA Diagnostics Industry Volume Share (%), by Application 2024 & 2032
- Figure 55: Asia Pacific DNA Diagnostics Industry Revenue (Million), by Country 2024 & 2032
- Figure 56: Asia Pacific DNA Diagnostics Industry Volume (K Unit), by Country 2024 & 2032
- Figure 57: Asia Pacific DNA Diagnostics Industry Revenue Share (%), by Country 2024 & 2032
- Figure 58: Asia Pacific DNA Diagnostics Industry Volume Share (%), by Country 2024 & 2032
- Figure 59: Middle East and Africa DNA Diagnostics Industry Revenue (Million), by Sample Type 2024 & 2032
- Figure 60: Middle East and Africa DNA Diagnostics Industry Volume (K Unit), by Sample Type 2024 & 2032
- Figure 61: Middle East and Africa DNA Diagnostics Industry Revenue Share (%), by Sample Type 2024 & 2032
- Figure 62: Middle East and Africa DNA Diagnostics Industry Volume Share (%), by Sample Type 2024 & 2032
- Figure 63: Middle East and Africa DNA Diagnostics Industry Revenue (Million), by Application 2024 & 2032
- Figure 64: Middle East and Africa DNA Diagnostics Industry Volume (K Unit), by Application 2024 & 2032
- Figure 65: Middle East and Africa DNA Diagnostics Industry Revenue Share (%), by Application 2024 & 2032
- Figure 66: Middle East and Africa DNA Diagnostics Industry Volume Share (%), by Application 2024 & 2032
- Figure 67: Middle East and Africa DNA Diagnostics Industry Revenue (Million), by Country 2024 & 2032
- Figure 68: Middle East and Africa DNA Diagnostics Industry Volume (K Unit), by Country 2024 & 2032
- Figure 69: Middle East and Africa DNA Diagnostics Industry Revenue Share (%), by Country 2024 & 2032
- Figure 70: Middle East and Africa DNA Diagnostics Industry Volume Share (%), by Country 2024 & 2032
- Figure 71: South America DNA Diagnostics Industry Revenue (Million), by Sample Type 2024 & 2032
- Figure 72: South America DNA Diagnostics Industry Volume (K Unit), by Sample Type 2024 & 2032
- Figure 73: South America DNA Diagnostics Industry Revenue Share (%), by Sample Type 2024 & 2032
- Figure 74: South America DNA Diagnostics Industry Volume Share (%), by Sample Type 2024 & 2032
- Figure 75: South America DNA Diagnostics Industry Revenue (Million), by Application 2024 & 2032
- Figure 76: South America DNA Diagnostics Industry Volume (K Unit), by Application 2024 & 2032
- Figure 77: South America DNA Diagnostics Industry Revenue Share (%), by Application 2024 & 2032
- Figure 78: South America DNA Diagnostics Industry Volume Share (%), by Application 2024 & 2032
- Figure 79: South America DNA Diagnostics Industry Revenue (Million), by Country 2024 & 2032
- Figure 80: South America DNA Diagnostics Industry Volume (K Unit), by Country 2024 & 2032
- Figure 81: South America DNA Diagnostics Industry Revenue Share (%), by Country 2024 & 2032
- Figure 82: South America DNA Diagnostics Industry Volume Share (%), by Country 2024 & 2032
List of Tables
- Table 1: Global DNA Diagnostics Industry Revenue Million Forecast, by Region 2019 & 2032
- Table 2: Global DNA Diagnostics Industry Volume K Unit Forecast, by Region 2019 & 2032
- Table 3: Global DNA Diagnostics Industry Revenue Million Forecast, by Sample Type 2019 & 2032
- Table 4: Global DNA Diagnostics Industry Volume K Unit Forecast, by Sample Type 2019 & 2032
- Table 5: Global DNA Diagnostics Industry Revenue Million Forecast, by Application 2019 & 2032
- Table 6: Global DNA Diagnostics Industry Volume K Unit Forecast, by Application 2019 & 2032
- Table 7: Global DNA Diagnostics Industry Revenue Million Forecast, by Region 2019 & 2032
- Table 8: Global DNA Diagnostics Industry Volume K Unit Forecast, by Region 2019 & 2032
- Table 9: Global DNA Diagnostics Industry Revenue Million Forecast, by Country 2019 & 2032
- Table 10: Global DNA Diagnostics Industry Volume K Unit Forecast, by Country 2019 & 2032
- Table 11: United States DNA Diagnostics Industry Revenue (Million) Forecast, by Application 2019 & 2032
- Table 12: United States DNA Diagnostics Industry Volume (K Unit) Forecast, by Application 2019 & 2032
- Table 13: Canada DNA Diagnostics Industry Revenue (Million) Forecast, by Application 2019 & 2032
- Table 14: Canada DNA Diagnostics Industry Volume (K Unit) Forecast, by Application 2019 & 2032
- Table 15: Mexico DNA Diagnostics Industry Revenue (Million) Forecast, by Application 2019 & 2032
- Table 16: Mexico DNA Diagnostics Industry Volume (K Unit) Forecast, by Application 2019 & 2032
- Table 17: Global DNA Diagnostics Industry Revenue Million Forecast, by Country 2019 & 2032
- Table 18: Global DNA Diagnostics Industry Volume K Unit Forecast, by Country 2019 & 2032
- Table 19: Germany DNA Diagnostics Industry Revenue (Million) Forecast, by Application 2019 & 2032
- Table 20: Germany DNA Diagnostics Industry Volume (K Unit) Forecast, by Application 2019 & 2032
- Table 21: United Kingdom DNA Diagnostics Industry Revenue (Million) Forecast, by Application 2019 & 2032
- Table 22: United Kingdom DNA Diagnostics Industry Volume (K Unit) Forecast, by Application 2019 & 2032
- Table 23: France DNA Diagnostics Industry Revenue (Million) Forecast, by Application 2019 & 2032
- Table 24: France DNA Diagnostics Industry Volume (K Unit) Forecast, by Application 2019 & 2032
- Table 25: Italy DNA Diagnostics Industry Revenue (Million) Forecast, by Application 2019 & 2032
- Table 26: Italy DNA Diagnostics Industry Volume (K Unit) Forecast, by Application 2019 & 2032
- Table 27: Spain DNA Diagnostics Industry Revenue (Million) Forecast, by Application 2019 & 2032
- Table 28: Spain DNA Diagnostics Industry Volume (K Unit) Forecast, by Application 2019 & 2032
- Table 29: Rest of Europe DNA Diagnostics Industry Revenue (Million) Forecast, by Application 2019 & 2032
- Table 30: Rest of Europe DNA Diagnostics Industry Volume (K Unit) Forecast, by Application 2019 & 2032
- Table 31: Global DNA Diagnostics Industry Revenue Million Forecast, by Country 2019 & 2032
- Table 32: Global DNA Diagnostics Industry Volume K Unit Forecast, by Country 2019 & 2032
- Table 33: China DNA Diagnostics Industry Revenue (Million) Forecast, by Application 2019 & 2032
- Table 34: China DNA Diagnostics Industry Volume (K Unit) Forecast, by Application 2019 & 2032
- Table 35: Japan DNA Diagnostics Industry Revenue (Million) Forecast, by Application 2019 & 2032
- Table 36: Japan DNA Diagnostics Industry Volume (K Unit) Forecast, by Application 2019 & 2032
- Table 37: India DNA Diagnostics Industry Revenue (Million) Forecast, by Application 2019 & 2032
- Table 38: India DNA Diagnostics Industry Volume (K Unit) Forecast, by Application 2019 & 2032
- Table 39: Australia DNA Diagnostics Industry Revenue (Million) Forecast, by Application 2019 & 2032
- Table 40: Australia DNA Diagnostics Industry Volume (K Unit) Forecast, by Application 2019 & 2032
- Table 41: South Korea DNA Diagnostics Industry Revenue (Million) Forecast, by Application 2019 & 2032
- Table 42: South Korea DNA Diagnostics Industry Volume (K Unit) Forecast, by Application 2019 & 2032
- Table 43: Rest of Asia Pacific DNA Diagnostics Industry Revenue (Million) Forecast, by Application 2019 & 2032
- Table 44: Rest of Asia Pacific DNA Diagnostics Industry Volume (K Unit) Forecast, by Application 2019 & 2032
- Table 45: Global DNA Diagnostics Industry Revenue Million Forecast, by Country 2019 & 2032
- Table 46: Global DNA Diagnostics Industry Volume K Unit Forecast, by Country 2019 & 2032
- Table 47: GCC DNA Diagnostics Industry Revenue (Million) Forecast, by Application 2019 & 2032
- Table 48: GCC DNA Diagnostics Industry Volume (K Unit) Forecast, by Application 2019 & 2032
- Table 49: South Africa DNA Diagnostics Industry Revenue (Million) Forecast, by Application 2019 & 2032
- Table 50: South Africa DNA Diagnostics Industry Volume (K Unit) Forecast, by Application 2019 & 2032
- Table 51: Rest of Middle East and Africa DNA Diagnostics Industry Revenue (Million) Forecast, by Application 2019 & 2032
- Table 52: Rest of Middle East and Africa DNA Diagnostics Industry Volume (K Unit) Forecast, by Application 2019 & 2032
- Table 53: Global DNA Diagnostics Industry Revenue Million Forecast, by Country 2019 & 2032
- Table 54: Global DNA Diagnostics Industry Volume K Unit Forecast, by Country 2019 & 2032
- Table 55: Brazil DNA Diagnostics Industry Revenue (Million) Forecast, by Application 2019 & 2032
- Table 56: Brazil DNA Diagnostics Industry Volume (K Unit) Forecast, by Application 2019 & 2032
- Table 57: Argentina DNA Diagnostics Industry Revenue (Million) Forecast, by Application 2019 & 2032
- Table 58: Argentina DNA Diagnostics Industry Volume (K Unit) Forecast, by Application 2019 & 2032
- Table 59: Rest of South America DNA Diagnostics Industry Revenue (Million) Forecast, by Application 2019 & 2032
- Table 60: Rest of South America DNA Diagnostics Industry Volume (K Unit) Forecast, by Application 2019 & 2032
- Table 61: Global DNA Diagnostics Industry Revenue Million Forecast, by Sample Type 2019 & 2032
- Table 62: Global DNA Diagnostics Industry Volume K Unit Forecast, by Sample Type 2019 & 2032
- Table 63: Global DNA Diagnostics Industry Revenue Million Forecast, by Application 2019 & 2032
- Table 64: Global DNA Diagnostics Industry Volume K Unit Forecast, by Application 2019 & 2032
- Table 65: Global DNA Diagnostics Industry Revenue Million Forecast, by Country 2019 & 2032
- Table 66: Global DNA Diagnostics Industry Volume K Unit Forecast, by Country 2019 & 2032
- Table 67: United States DNA Diagnostics Industry Revenue (Million) Forecast, by Application 2019 & 2032
- Table 68: United States DNA Diagnostics Industry Volume (K Unit) Forecast, by Application 2019 & 2032
- Table 69: Canada DNA Diagnostics Industry Revenue (Million) Forecast, by Application 2019 & 2032
- Table 70: Canada DNA Diagnostics Industry Volume (K Unit) Forecast, by Application 2019 & 2032
- Table 71: Mexico DNA Diagnostics Industry Revenue (Million) Forecast, by Application 2019 & 2032
- Table 72: Mexico DNA Diagnostics Industry Volume (K Unit) Forecast, by Application 2019 & 2032
- Table 73: Global DNA Diagnostics Industry Revenue Million Forecast, by Sample Type 2019 & 2032
- Table 74: Global DNA Diagnostics Industry Volume K Unit Forecast, by Sample Type 2019 & 2032
- Table 75: Global DNA Diagnostics Industry Revenue Million Forecast, by Application 2019 & 2032
- Table 76: Global DNA Diagnostics Industry Volume K Unit Forecast, by Application 2019 & 2032
- Table 77: Global DNA Diagnostics Industry Revenue Million Forecast, by Country 2019 & 2032
- Table 78: Global DNA Diagnostics Industry Volume K Unit Forecast, by Country 2019 & 2032
- Table 79: Germany DNA Diagnostics Industry Revenue (Million) Forecast, by Application 2019 & 2032
- Table 80: Germany DNA Diagnostics Industry Volume (K Unit) Forecast, by Application 2019 & 2032
- Table 81: United Kingdom DNA Diagnostics Industry Revenue (Million) Forecast, by Application 2019 & 2032
- Table 82: United Kingdom DNA Diagnostics Industry Volume (K Unit) Forecast, by Application 2019 & 2032
- Table 83: France DNA Diagnostics Industry Revenue (Million) Forecast, by Application 2019 & 2032
- Table 84: France DNA Diagnostics Industry Volume (K Unit) Forecast, by Application 2019 & 2032
- Table 85: Italy DNA Diagnostics Industry Revenue (Million) Forecast, by Application 2019 & 2032
- Table 86: Italy DNA Diagnostics Industry Volume (K Unit) Forecast, by Application 2019 & 2032
- Table 87: Spain DNA Diagnostics Industry Revenue (Million) Forecast, by Application 2019 & 2032
- Table 88: Spain DNA Diagnostics Industry Volume (K Unit) Forecast, by Application 2019 & 2032
- Table 89: Rest of Europe DNA Diagnostics Industry Revenue (Million) Forecast, by Application 2019 & 2032
- Table 90: Rest of Europe DNA Diagnostics Industry Volume (K Unit) Forecast, by Application 2019 & 2032
- Table 91: Global DNA Diagnostics Industry Revenue Million Forecast, by Sample Type 2019 & 2032
- Table 92: Global DNA Diagnostics Industry Volume K Unit Forecast, by Sample Type 2019 & 2032
- Table 93: Global DNA Diagnostics Industry Revenue Million Forecast, by Application 2019 & 2032
- Table 94: Global DNA Diagnostics Industry Volume K Unit Forecast, by Application 2019 & 2032
- Table 95: Global DNA Diagnostics Industry Revenue Million Forecast, by Country 2019 & 2032
- Table 96: Global DNA Diagnostics Industry Volume K Unit Forecast, by Country 2019 & 2032
- Table 97: China DNA Diagnostics Industry Revenue (Million) Forecast, by Application 2019 & 2032
- Table 98: China DNA Diagnostics Industry Volume (K Unit) Forecast, by Application 2019 & 2032
- Table 99: Japan DNA Diagnostics Industry Revenue (Million) Forecast, by Application 2019 & 2032
- Table 100: Japan DNA Diagnostics Industry Volume (K Unit) Forecast, by Application 2019 & 2032
- Table 101: India DNA Diagnostics Industry Revenue (Million) Forecast, by Application 2019 & 2032
- Table 102: India DNA Diagnostics Industry Volume (K Unit) Forecast, by Application 2019 & 2032
- Table 103: Australia DNA Diagnostics Industry Revenue (Million) Forecast, by Application 2019 & 2032
- Table 104: Australia DNA Diagnostics Industry Volume (K Unit) Forecast, by Application 2019 & 2032
- Table 105: South Korea DNA Diagnostics Industry Revenue (Million) Forecast, by Application 2019 & 2032
- Table 106: South Korea DNA Diagnostics Industry Volume (K Unit) Forecast, by Application 2019 & 2032
- Table 107: Rest of Asia Pacific DNA Diagnostics Industry Revenue (Million) Forecast, by Application 2019 & 2032
- Table 108: Rest of Asia Pacific DNA Diagnostics Industry Volume (K Unit) Forecast, by Application 2019 & 2032
- Table 109: Global DNA Diagnostics Industry Revenue Million Forecast, by Sample Type 2019 & 2032
- Table 110: Global DNA Diagnostics Industry Volume K Unit Forecast, by Sample Type 2019 & 2032
- Table 111: Global DNA Diagnostics Industry Revenue Million Forecast, by Application 2019 & 2032
- Table 112: Global DNA Diagnostics Industry Volume K Unit Forecast, by Application 2019 & 2032
- Table 113: Global DNA Diagnostics Industry Revenue Million Forecast, by Country 2019 & 2032
- Table 114: Global DNA Diagnostics Industry Volume K Unit Forecast, by Country 2019 & 2032
- Table 115: GCC DNA Diagnostics Industry Revenue (Million) Forecast, by Application 2019 & 2032
- Table 116: GCC DNA Diagnostics Industry Volume (K Unit) Forecast, by Application 2019 & 2032
- Table 117: South Africa DNA Diagnostics Industry Revenue (Million) Forecast, by Application 2019 & 2032
- Table 118: South Africa DNA Diagnostics Industry Volume (K Unit) Forecast, by Application 2019 & 2032
- Table 119: Rest of Middle East and Africa DNA Diagnostics Industry Revenue (Million) Forecast, by Application 2019 & 2032
- Table 120: Rest of Middle East and Africa DNA Diagnostics Industry Volume (K Unit) Forecast, by Application 2019 & 2032
- Table 121: Global DNA Diagnostics Industry Revenue Million Forecast, by Sample Type 2019 & 2032
- Table 122: Global DNA Diagnostics Industry Volume K Unit Forecast, by Sample Type 2019 & 2032
- Table 123: Global DNA Diagnostics Industry Revenue Million Forecast, by Application 2019 & 2032
- Table 124: Global DNA Diagnostics Industry Volume K Unit Forecast, by Application 2019 & 2032
- Table 125: Global DNA Diagnostics Industry Revenue Million Forecast, by Country 2019 & 2032
- Table 126: Global DNA Diagnostics Industry Volume K Unit Forecast, by Country 2019 & 2032
- Table 127: Brazil DNA Diagnostics Industry Revenue (Million) Forecast, by Application 2019 & 2032
- Table 128: Brazil DNA Diagnostics Industry Volume (K Unit) Forecast, by Application 2019 & 2032
- Table 129: Argentina DNA Diagnostics Industry Revenue (Million) Forecast, by Application 2019 & 2032
- Table 130: Argentina DNA Diagnostics Industry Volume (K Unit) Forecast, by Application 2019 & 2032
- Table 131: Rest of South America DNA Diagnostics Industry Revenue (Million) Forecast, by Application 2019 & 2032
- Table 132: Rest of South America DNA Diagnostics Industry Volume (K Unit) Forecast, by Application 2019 & 2032
Frequently Asked Questions
1. What is the projected Compound Annual Growth Rate (CAGR) of the DNA Diagnostics Industry?
The projected CAGR is approximately 15.70%.
2. Which companies are prominent players in the DNA Diagnostics Industry?
Key companies in the market include Mapmygenome, Gene by Gene, Ancestry com LLC, MyHeritage Ltd, Pathway genomics, Helix OpCo LLC, Genesis Healthcare Co, 23andMe, Living DNA Ltd, Veritas Genetics, Futura Genetics, Identigene (DNA Diagnostics Center).
3. What are the main segments of the DNA Diagnostics Industry?
The market segments include Sample Type, Application.
4. Can you provide details about the market size?
The market size is estimated to be USD XX Million as of 2022.
5. What are some drivers contributing to market growth?
Increasing Demand for Paternity Testing & Increasing Number of Hereditary Diseases; Increasing Demand for Personalized DTC Genetic Services in Developed Countries.
6. What are the notable trends driving market growth?
Ancestry Testing Segment is Expected to Witness Growth Over the Forecast Period.
7. Are there any restraints impacting market growth?
Regulatory Challenges Pertaining to the Use of DTC Genetic Tests.
8. Can you provide examples of recent developments in the market?
In May 2021, South Korean Telecommunications partnered with Direct-to-Consumer genetic testing companies to send test results to consumers' mobile devices. DTC genetic testing organizations and telecommunications companies in South Korea are collaborating with each other with an aim to help consumers by informing them about their health status by sending lab test results directly to their mobile devices without involving healthcare professionals.
9. What pricing options are available for accessing the report?
Pricing options include single-user, multi-user, and enterprise licenses priced at USD 4750, USD 5250, and USD 8750 respectively.
10. Is the market size provided in terms of value or volume?
The market size is provided in terms of value, measured in Million and volume, measured in K Unit.
11. Are there any specific market keywords associated with the report?
Yes, the market keyword associated with the report is "DNA Diagnostics Industry," which aids in identifying and referencing the specific market segment covered.
12. How do I determine which pricing option suits my needs best?
The pricing options vary based on user requirements and access needs. Individual users may opt for single-user licenses, while businesses requiring broader access may choose multi-user or enterprise licenses for cost-effective access to the report.
13. Are there any additional resources or data provided in the DNA Diagnostics Industry report?
While the report offers comprehensive insights, it's advisable to review the specific contents or supplementary materials provided to ascertain if additional resources or data are available.
14. How can I stay updated on further developments or reports in the DNA Diagnostics Industry?
To stay informed about further developments, trends, and reports in the DNA Diagnostics Industry, consider subscribing to industry newsletters, following relevant companies and organizations, or regularly checking reputable industry news sources and publications.
Methodology
Step 1 - Identification of Relevant Samples Size from Population Database


Step 2 - Approaches for Defining Global Market Size (Value, Volume* & Price*)

Note*: In applicable scenarios
Step 3 - Data Sources
Primary Research
- Web Analytics
- Survey Reports
- Research Institute
- Latest Research Reports
- Opinion Leaders
Secondary Research
- Annual Reports
- White Paper
- Latest Press Release
- Industry Association
- Paid Database
- Investor Presentations

Step 4 - Data Triangulation
Involves using different sources of information in order to increase the validity of a study
These sources are likely to be stakeholders in a program - participants, other researchers, program staff, other community members, and so on.
Then we put all data in single framework & apply various statistical tools to find out the dynamic on the market.
During the analysis stage, feedback from the stakeholder groups would be compared to determine areas of agreement as well as areas of divergence


