

Key Insights
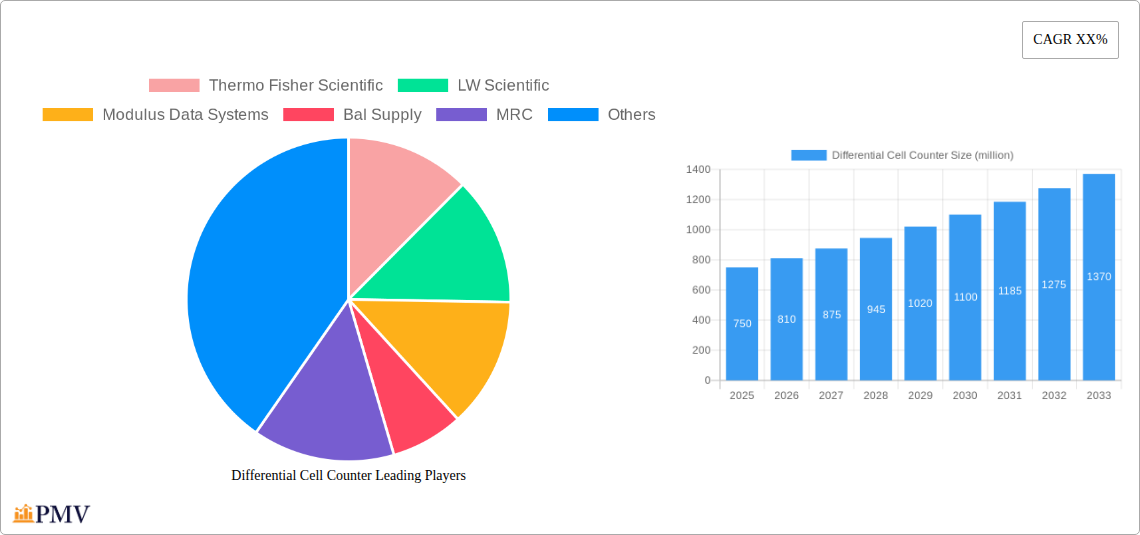
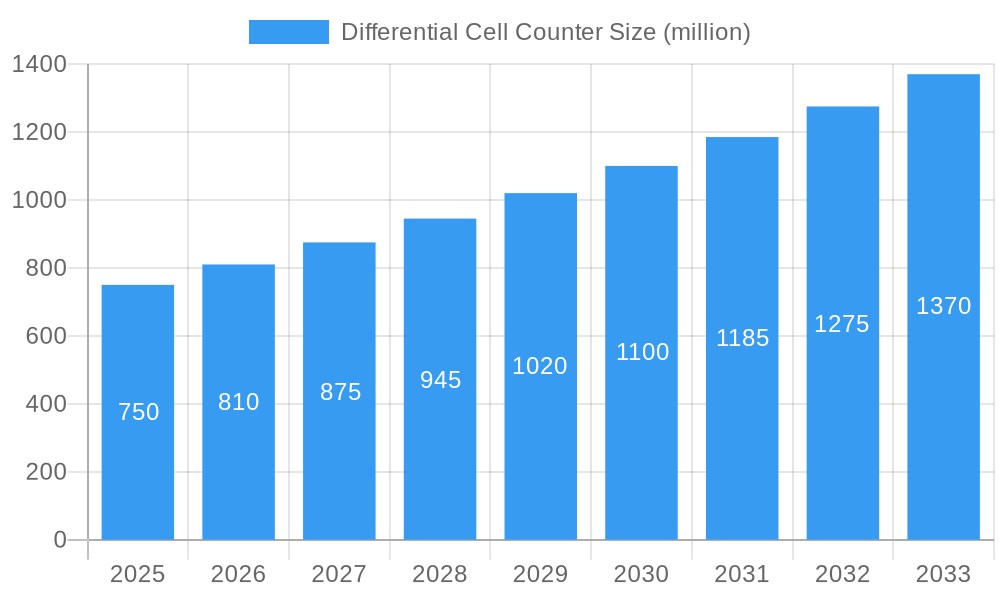
The global Differential Cell Counter market is poised for significant expansion, projected to reach a substantial market size of approximately $750 million by 2025, with a compelling Compound Annual Growth Rate (CAGR) of around 8%. This robust growth is primarily fueled by the increasing incidence of blood-related disorders, a rising demand for accurate and rapid diagnostic solutions, and the continuous advancements in hematology instrumentation. The healthcare sector, particularly hospitals and diagnostic laboratories, represents the largest application segment, driven by the need for efficient and precise cell counting in routine blood tests and disease diagnosis. Furthermore, the pharmaceutical and biotechnology sectors are also contributing to market growth, utilizing differential cell counters for preclinical research, drug development, and quality control processes.
Differential Cell Counter Market Size (In Million)
The market dynamics are further shaped by a shift towards automated differential cell counters, offering enhanced throughput, reduced human error, and improved standardization compared to manual instruments. This trend is supported by ongoing technological innovations, including the integration of artificial intelligence (AI) and machine learning (ML) for more sophisticated analysis and interpretation of blood cell differentials. While the market exhibits strong growth potential, certain restraints such as the high initial cost of advanced automated systems and the availability of alternative diagnostic methods in resource-limited settings may pose challenges. However, the expanding healthcare infrastructure, particularly in emerging economies, and the increasing focus on personalized medicine are expected to offset these limitations, driving sustained market penetration and growth.
Differential Cell Counter Company Market Share
Unlock critical insights into the global Differential Cell Counter market with this in-depth report. Spanning a study period of 2019–2033, with a base year of 2025 and a forecast period from 2025–2033, this analysis provides a detailed examination of market structure, trends, segmentation, key players, and future outlook.
Differential Cell Counter Market Structure & Competitive Dynamics
The global differential cell counter market exhibits a moderately concentrated structure, with key players such as Thermo Fisher Scientific, LW Scientific, and Digisystem Laboratory Instruments holding significant market share. Innovation is driven by an increasing demand for automated and advanced cell counting solutions, fostering an ecosystem of continuous product development and technological integration. Regulatory frameworks, primarily governed by bodies like the FDA and EMA, are crucial for market entry and product approval, impacting the pace of innovation and market access. Product substitutes, including manual microscopy, offer a lower-cost alternative but lack the speed and accuracy of automated differential cell counters. End-user trends are leaning towards higher throughput, improved precision, and integrated data management systems, particularly within hospitals and diagnostic laboratories. Mergers and acquisitions (M&A) activity, estimated to be in the hundreds of millions of dollars, is observed as established players seek to expand their product portfolios and geographical reach. For instance, strategic acquisitions by leading manufacturers aim to consolidate market positions and leverage synergistic capabilities.
Differential Cell Counter Industry Trends & Insights
The differential cell counter industry is poised for robust growth, propelled by several key market growth drivers. An increasing global prevalence of hematological disorders and infectious diseases, necessitating precise blood cell analysis, significantly fuels demand for these instruments. Furthermore, the expanding healthcare infrastructure in emerging economies, coupled with rising healthcare expenditure, contributes substantially to market penetration. Technological disruptions, such as the integration of artificial intelligence (AI) and machine learning (ML) for automated cell identification and classification, are revolutionizing the industry by enhancing accuracy and reducing analysis time. The growing adoption of point-of-care diagnostics also presents a significant opportunity for portable and user-friendly differential cell counters. Consumer preferences are shifting towards automated systems that offer higher throughput, improved accuracy, and reduced human error. The competitive dynamics are characterized by intense innovation, with companies striving to differentiate their offerings through advanced features, user interface design, and cost-effectiveness. The Compound Annual Growth Rate (CAGR) for the forecast period is estimated to be approximately 7.5%, reflecting a strong and sustained upward trajectory. Market penetration is expected to accelerate as healthcare providers recognize the efficiency and diagnostic advantages offered by modern differential cell counters.
Dominant Markets & Segments in Differential Cell Counter
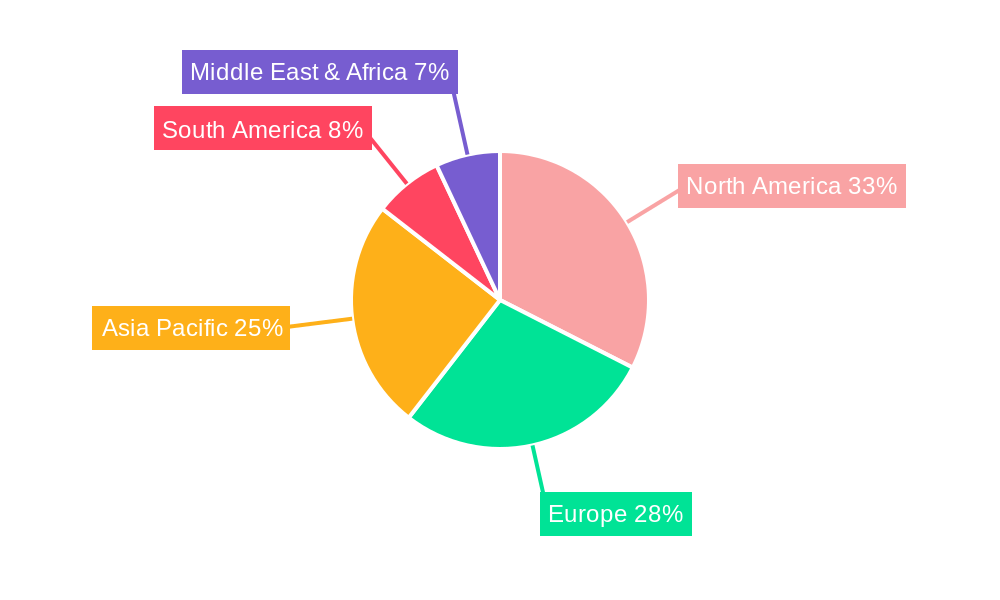
The Hospitals & Diagnostic Laboratories segment is the dominant force in the global differential cell counter market, driven by the high volume of blood tests performed daily for disease diagnosis, patient monitoring, and treatment efficacy assessment. The increasing incidence of chronic diseases and the continuous need for accurate patient prognoses underscore the indispensability of these instruments in clinical settings. Economic policies supporting healthcare infrastructure development and increased public and private investment in diagnostic capabilities further bolster this segment's dominance. In terms of geographical dominance, North America stands out as a leading market, attributed to its advanced healthcare system, high per capita healthcare spending, and early adoption of cutting-edge diagnostic technologies.
Key Drivers for Hospitals & Diagnostic Laboratories:
- Growing volume of diagnostic blood tests for routine health check-ups and disease management.
- Demand for rapid and accurate results to expedite patient treatment decisions.
- Increasing prevalence of hematological disorders, anemias, and infectious diseases.
- Government initiatives and reimbursement policies that favor advanced diagnostic tools.
Key Drivers for North America:
- High density of hospitals, specialized clinics, and independent diagnostic laboratories.
- Significant research and development investments in hematology and oncology.
- Strong emphasis on quality control and accreditation in healthcare services.
- Favorable regulatory environment for medical devices.
The Automatic Instrument type segment is also experiencing significant growth and dominance, driven by the need for efficiency, reduced labor costs, and enhanced precision compared to manual methods. These instruments offer higher throughput, minimize subjective interpretation, and integrate seamlessly with laboratory information systems (LIS).
Differential Cell Counter Product Innovations
Product innovations in the differential cell counter market are predominantly focused on enhancing automation, improving accuracy through advanced imaging and AI-driven algorithms, and developing more compact and portable devices for point-of-care applications. Companies are investing in smart features such as cloud connectivity for data management and remote diagnostics. These advancements offer competitive advantages by providing faster, more reliable, and user-friendly cell analysis solutions that cater to the evolving needs of healthcare professionals, from large hospital networks to smaller research facilities.
Report Segmentation & Scope
This report meticulously segments the global differential cell counter market by Application and Type.
Application Segmentation:
- Hospitals & Diagnostic Laboratories: This segment, projected to hold a market size of over $800 million in 2025, is characterized by high volume testing and a demand for robust, automated systems.
- Pharmaceutical & Biotechnology: Expected to reach over $300 million in 2025, this segment utilizes differential cell counters for drug discovery, development, and quality control.
- Research Institutes: Forecasting a market size of over $250 million in 2025, these institutions rely on differential cell counters for fundamental research in hematology and related fields.
- Other: This segment, estimated at over $100 million in 2025, includes veterinary diagnostics and other niche applications.
Type Segmentation:
- Manual Instrument: While declining in market share, this segment is still relevant for smaller labs with budget constraints, projected at over $150 million in 2025.
- Automatic Instrument: This segment is experiencing rapid growth, projected to exceed $1.3 billion in 2025, driven by efficiency and accuracy demands.
Key Drivers of Differential Cell Counter Growth
Several pivotal factors are accelerating the growth of the differential cell counter market. The escalating global burden of blood-related diseases, including leukemia, lymphoma, and various anemias, directly drives the demand for accurate diagnostic tools. Technological advancements, such as the integration of AI for improved cell differentiation accuracy and speed, are transforming the market. Government initiatives promoting early disease detection and improved healthcare access, particularly in emerging economies, also contribute significantly. Furthermore, the increasing focus on personalized medicine, which relies on precise patient data, fuels the need for sophisticated hematological analysis.
Challenges in the Differential Cell Counter Sector
Despite its growth trajectory, the differential cell counter sector faces several significant challenges. High initial investment costs for advanced automated systems can be a barrier for smaller laboratories and healthcare facilities, especially in price-sensitive markets. Stringent regulatory approval processes in various regions can delay product launches and increase development expenses. Furthermore, intense competition among manufacturers can lead to price erosion and pressure on profit margins. Supply chain disruptions, as evidenced by recent global events, can impact the availability of critical components and raw materials, affecting production timelines and costs.
Leading Players in the Differential Cell Counter Market
- Thermo Fisher Scientific
- LW Scientific
- Modulus Data Systems
- Bal Supply
- MRC
- Digisystem Laboratory Instruments
- Heathrow Scientific
- Woodley
- Medicus Health
- Desco Medical
- Hwashin Tech
- KPG Products
- UNICO
- Redbank Group
- Labline Equipment
Key Developments in Differential Cell Counter Sector
- 2023 March: Thermo Fisher Scientific launched its new automated differential cell counter with AI-powered flagging for rare cell types, enhancing diagnostic accuracy in hematology.
- 2023 September: LW Scientific introduced a cost-effective manual differential cell counter with enhanced ergonomic features for improved user comfort and efficiency.
- 2022 November: Digisystem Laboratory Instruments expanded its product line with a compact, benchtop automated differential cell counter designed for smaller clinics and satellite laboratories.
- 2022 December: Modulus Data Systems announced a strategic partnership to integrate its AI-driven cell analysis software with leading hematology analyzers, aiming to improve workflow automation.
Strategic Differential Cell Counter Market Outlook
The strategic outlook for the differential cell counter market remains highly positive, fueled by an unyielding demand for accurate and efficient blood cell analysis. Growth accelerators include the ongoing digitalization of healthcare, the increasing integration of AI and machine learning in diagnostic devices, and the expanding need for point-of-care testing solutions. Manufacturers focusing on developing user-friendly, cost-effective, and highly accurate instruments with robust data management capabilities will be best positioned to capitalize on future market potential. Strategic collaborations and targeted product development for specific clinical applications will be crucial for sustained success in this dynamic and evolving sector.
Differential Cell Counter Segmentation
-
1. Application
- 1.1. Hospitals & Diagnostic Laboratories
- 1.2. Pharmaceutical & Biotechnology
- 1.3. Research Institutes
- 1.4. Other
-
2. Types
- 2.1. Manual Instrument
- 2.2. Automatic Instrument
Differential Cell Counter Segmentation By Geography
-
1. North America
- 1.1. United States
- 1.2. Canada
- 1.3. Mexico
-
2. South America
- 2.1. Brazil
- 2.2. Argentina
- 2.3. Rest of South America
-
3. Europe
- 3.1. United Kingdom
- 3.2. Germany
- 3.3. France
- 3.4. Italy
- 3.5. Spain
- 3.6. Russia
- 3.7. Benelux
- 3.8. Nordics
- 3.9. Rest of Europe
-
4. Middle East & Africa
- 4.1. Turkey
- 4.2. Israel
- 4.3. GCC
- 4.4. North Africa
- 4.5. South Africa
- 4.6. Rest of Middle East & Africa
-
5. Asia Pacific
- 5.1. China
- 5.2. India
- 5.3. Japan
- 5.4. South Korea
- 5.5. ASEAN
- 5.6. Oceania
- 5.7. Rest of Asia Pacific
Differential Cell Counter Regional Market Share
Geographic Coverage of Differential Cell Counter
Differential Cell Counter REPORT HIGHLIGHTS
| Aspects | Details |
|---|---|
| Study Period | 2020-2034 |
| Base Year | 2025 |
| Estimated Year | 2026 |
| Forecast Period | 2026-2034 |
| Historical Period | 2020-2025 |
| Growth Rate | CAGR of XX% from 2020-2034 |
| Segmentation |
|
Table of Contents
- 1. Introduction
- 1.1. Research Scope
- 1.2. Market Segmentation
- 1.3. Research Objective
- 1.4. Definitions and Assumptions
- 2. Executive Summary
- 2.1. Market Snapshot
- 3. Market Dynamics
- 3.1. Market Drivers
- 3.2. Market Restrains
- 3.3. Market Trends
- 3.4. Market Opportunities
- 4. Market Factor Analysis
- 4.1. Porters Five Forces
- 4.1.1. Bargaining Power of Suppliers
- 4.1.2. Bargaining Power of Buyers
- 4.1.3. Threat of New Entrants
- 4.1.4. Threat of Substitutes
- 4.1.5. Competitive Rivalry
- 4.2. PESTEL analysis
- 4.3. BCG Analysis
- 4.3.1. Stars (High Growth, High Market Share)
- 4.3.2. Cash Cows (Low Growth, High Market Share)
- 4.3.3. Question Mark (High Growth, Low Market Share)
- 4.3.4. Dogs (Low Growth, Low Market Share)
- 4.4. Ansoff Matrix Analysis
- 4.5. Supply Chain Analysis
- 4.6. Regulatory Landscape
- 4.7. Current Market Potential and Opportunity Assessment (TAM–SAM–SOM Framework)
- 4.8. PMV Analyst Note
- 4.1. Porters Five Forces
- 5. Market Analysis, Insights and Forecast 2021-2033
- 5.1. Market Analysis, Insights and Forecast - by Application
- 5.1.1. Hospitals & Diagnostic Laboratories
- 5.1.2. Pharmaceutical & Biotechnology
- 5.1.3. Research Institutes
- 5.1.4. Other
- 5.2. Market Analysis, Insights and Forecast - by Types
- 5.2.1. Manual Instrument
- 5.2.2. Automatic Instrument
- 5.3. Market Analysis, Insights and Forecast - by Region
- 5.3.1. North America
- 5.3.2. South America
- 5.3.3. Europe
- 5.3.4. Middle East & Africa
- 5.3.5. Asia Pacific
- 5.1. Market Analysis, Insights and Forecast - by Application
- 6. Global Differential Cell Counter Analysis, Insights and Forecast, 2021-2033
- 6.1. Market Analysis, Insights and Forecast - by Application
- 6.1.1. Hospitals & Diagnostic Laboratories
- 6.1.2. Pharmaceutical & Biotechnology
- 6.1.3. Research Institutes
- 6.1.4. Other
- 6.2. Market Analysis, Insights and Forecast - by Types
- 6.2.1. Manual Instrument
- 6.2.2. Automatic Instrument
- 6.1. Market Analysis, Insights and Forecast - by Application
- 7. North America Differential Cell Counter Analysis, Insights and Forecast, 2020-2032
- 7.1. Market Analysis, Insights and Forecast - by Application
- 7.1.1. Hospitals & Diagnostic Laboratories
- 7.1.2. Pharmaceutical & Biotechnology
- 7.1.3. Research Institutes
- 7.1.4. Other
- 7.2. Market Analysis, Insights and Forecast - by Types
- 7.2.1. Manual Instrument
- 7.2.2. Automatic Instrument
- 7.1. Market Analysis, Insights and Forecast - by Application
- 8. South America Differential Cell Counter Analysis, Insights and Forecast, 2020-2032
- 8.1. Market Analysis, Insights and Forecast - by Application
- 8.1.1. Hospitals & Diagnostic Laboratories
- 8.1.2. Pharmaceutical & Biotechnology
- 8.1.3. Research Institutes
- 8.1.4. Other
- 8.2. Market Analysis, Insights and Forecast - by Types
- 8.2.1. Manual Instrument
- 8.2.2. Automatic Instrument
- 8.1. Market Analysis, Insights and Forecast - by Application
- 9. Europe Differential Cell Counter Analysis, Insights and Forecast, 2020-2032
- 9.1. Market Analysis, Insights and Forecast - by Application
- 9.1.1. Hospitals & Diagnostic Laboratories
- 9.1.2. Pharmaceutical & Biotechnology
- 9.1.3. Research Institutes
- 9.1.4. Other
- 9.2. Market Analysis, Insights and Forecast - by Types
- 9.2.1. Manual Instrument
- 9.2.2. Automatic Instrument
- 9.1. Market Analysis, Insights and Forecast - by Application
- 10. Middle East & Africa Differential Cell Counter Analysis, Insights and Forecast, 2020-2032
- 10.1. Market Analysis, Insights and Forecast - by Application
- 10.1.1. Hospitals & Diagnostic Laboratories
- 10.1.2. Pharmaceutical & Biotechnology
- 10.1.3. Research Institutes
- 10.1.4. Other
- 10.2. Market Analysis, Insights and Forecast - by Types
- 10.2.1. Manual Instrument
- 10.2.2. Automatic Instrument
- 10.1. Market Analysis, Insights and Forecast - by Application
- 11. Asia Pacific Differential Cell Counter Analysis, Insights and Forecast, 2020-2032
- 11.1. Market Analysis, Insights and Forecast - by Application
- 11.1.1. Hospitals & Diagnostic Laboratories
- 11.1.2. Pharmaceutical & Biotechnology
- 11.1.3. Research Institutes
- 11.1.4. Other
- 11.2. Market Analysis, Insights and Forecast - by Types
- 11.2.1. Manual Instrument
- 11.2.2. Automatic Instrument
- 11.1. Market Analysis, Insights and Forecast - by Application
- 12. Competitive Analysis
- 12.1. Company Profiles
- 12.1.1 Thermo Fisher Scientific
- 12.1.1.1. Company Overview
- 12.1.1.2. Products
- 12.1.1.3. Company Financials
- 12.1.1.4. SWOT Analysis
- 12.1.2 LW Scientific
- 12.1.2.1. Company Overview
- 12.1.2.2. Products
- 12.1.2.3. Company Financials
- 12.1.2.4. SWOT Analysis
- 12.1.3 Modulus Data Systems
- 12.1.3.1. Company Overview
- 12.1.3.2. Products
- 12.1.3.3. Company Financials
- 12.1.3.4. SWOT Analysis
- 12.1.4 Bal Supply
- 12.1.4.1. Company Overview
- 12.1.4.2. Products
- 12.1.4.3. Company Financials
- 12.1.4.4. SWOT Analysis
- 12.1.5 MRC
- 12.1.5.1. Company Overview
- 12.1.5.2. Products
- 12.1.5.3. Company Financials
- 12.1.5.4. SWOT Analysis
- 12.1.6 Digisystem Laboratory Instruments
- 12.1.6.1. Company Overview
- 12.1.6.2. Products
- 12.1.6.3. Company Financials
- 12.1.6.4. SWOT Analysis
- 12.1.7 Heathrow Scientific
- 12.1.7.1. Company Overview
- 12.1.7.2. Products
- 12.1.7.3. Company Financials
- 12.1.7.4. SWOT Analysis
- 12.1.8 Woodley
- 12.1.8.1. Company Overview
- 12.1.8.2. Products
- 12.1.8.3. Company Financials
- 12.1.8.4. SWOT Analysis
- 12.1.9 Medicus Health
- 12.1.9.1. Company Overview
- 12.1.9.2. Products
- 12.1.9.3. Company Financials
- 12.1.9.4. SWOT Analysis
- 12.1.10 Desco Medical
- 12.1.10.1. Company Overview
- 12.1.10.2. Products
- 12.1.10.3. Company Financials
- 12.1.10.4. SWOT Analysis
- 12.1.11 Hwashin Tech
- 12.1.11.1. Company Overview
- 12.1.11.2. Products
- 12.1.11.3. Company Financials
- 12.1.11.4. SWOT Analysis
- 12.1.12 KPG Products
- 12.1.12.1. Company Overview
- 12.1.12.2. Products
- 12.1.12.3. Company Financials
- 12.1.12.4. SWOT Analysis
- 12.1.13 UNICO
- 12.1.13.1. Company Overview
- 12.1.13.2. Products
- 12.1.13.3. Company Financials
- 12.1.13.4. SWOT Analysis
- 12.1.14 Redbank Group
- 12.1.14.1. Company Overview
- 12.1.14.2. Products
- 12.1.14.3. Company Financials
- 12.1.14.4. SWOT Analysis
- 12.1.15 Labline Equipment
- 12.1.15.1. Company Overview
- 12.1.15.2. Products
- 12.1.15.3. Company Financials
- 12.1.15.4. SWOT Analysis
- 12.1.1 Thermo Fisher Scientific
- 12.2. Market Entropy
- 12.2.1 Company's Key Areas Served
- 12.2.2 Recent Developments
- 12.3. Company Market Share Analysis 2025
- 12.3.1 Top 5 Companies Market Share Analysis
- 12.3.2 Top 3 Companies Market Share Analysis
- 12.4. List of Potential Customers
- 13. Research Methodology
List of Figures
- Figure 1: Global Differential Cell Counter Revenue Breakdown (million, %) by Region 2025 & 2033
- Figure 2: North America Differential Cell Counter Revenue (million), by Application 2025 & 2033
- Figure 3: North America Differential Cell Counter Revenue Share (%), by Application 2025 & 2033
- Figure 4: North America Differential Cell Counter Revenue (million), by Types 2025 & 2033
- Figure 5: North America Differential Cell Counter Revenue Share (%), by Types 2025 & 2033
- Figure 6: North America Differential Cell Counter Revenue (million), by Country 2025 & 2033
- Figure 7: North America Differential Cell Counter Revenue Share (%), by Country 2025 & 2033
- Figure 8: South America Differential Cell Counter Revenue (million), by Application 2025 & 2033
- Figure 9: South America Differential Cell Counter Revenue Share (%), by Application 2025 & 2033
- Figure 10: South America Differential Cell Counter Revenue (million), by Types 2025 & 2033
- Figure 11: South America Differential Cell Counter Revenue Share (%), by Types 2025 & 2033
- Figure 12: South America Differential Cell Counter Revenue (million), by Country 2025 & 2033
- Figure 13: South America Differential Cell Counter Revenue Share (%), by Country 2025 & 2033
- Figure 14: Europe Differential Cell Counter Revenue (million), by Application 2025 & 2033
- Figure 15: Europe Differential Cell Counter Revenue Share (%), by Application 2025 & 2033
- Figure 16: Europe Differential Cell Counter Revenue (million), by Types 2025 & 2033
- Figure 17: Europe Differential Cell Counter Revenue Share (%), by Types 2025 & 2033
- Figure 18: Europe Differential Cell Counter Revenue (million), by Country 2025 & 2033
- Figure 19: Europe Differential Cell Counter Revenue Share (%), by Country 2025 & 2033
- Figure 20: Middle East & Africa Differential Cell Counter Revenue (million), by Application 2025 & 2033
- Figure 21: Middle East & Africa Differential Cell Counter Revenue Share (%), by Application 2025 & 2033
- Figure 22: Middle East & Africa Differential Cell Counter Revenue (million), by Types 2025 & 2033
- Figure 23: Middle East & Africa Differential Cell Counter Revenue Share (%), by Types 2025 & 2033
- Figure 24: Middle East & Africa Differential Cell Counter Revenue (million), by Country 2025 & 2033
- Figure 25: Middle East & Africa Differential Cell Counter Revenue Share (%), by Country 2025 & 2033
- Figure 26: Asia Pacific Differential Cell Counter Revenue (million), by Application 2025 & 2033
- Figure 27: Asia Pacific Differential Cell Counter Revenue Share (%), by Application 2025 & 2033
- Figure 28: Asia Pacific Differential Cell Counter Revenue (million), by Types 2025 & 2033
- Figure 29: Asia Pacific Differential Cell Counter Revenue Share (%), by Types 2025 & 2033
- Figure 30: Asia Pacific Differential Cell Counter Revenue (million), by Country 2025 & 2033
- Figure 31: Asia Pacific Differential Cell Counter Revenue Share (%), by Country 2025 & 2033
List of Tables
- Table 1: Global Differential Cell Counter Revenue million Forecast, by Application 2020 & 2033
- Table 2: Global Differential Cell Counter Revenue million Forecast, by Types 2020 & 2033
- Table 3: Global Differential Cell Counter Revenue million Forecast, by Region 2020 & 2033
- Table 4: Global Differential Cell Counter Revenue million Forecast, by Application 2020 & 2033
- Table 5: Global Differential Cell Counter Revenue million Forecast, by Types 2020 & 2033
- Table 6: Global Differential Cell Counter Revenue million Forecast, by Country 2020 & 2033
- Table 7: United States Differential Cell Counter Revenue (million) Forecast, by Application 2020 & 2033
- Table 8: Canada Differential Cell Counter Revenue (million) Forecast, by Application 2020 & 2033
- Table 9: Mexico Differential Cell Counter Revenue (million) Forecast, by Application 2020 & 2033
- Table 10: Global Differential Cell Counter Revenue million Forecast, by Application 2020 & 2033
- Table 11: Global Differential Cell Counter Revenue million Forecast, by Types 2020 & 2033
- Table 12: Global Differential Cell Counter Revenue million Forecast, by Country 2020 & 2033
- Table 13: Brazil Differential Cell Counter Revenue (million) Forecast, by Application 2020 & 2033
- Table 14: Argentina Differential Cell Counter Revenue (million) Forecast, by Application 2020 & 2033
- Table 15: Rest of South America Differential Cell Counter Revenue (million) Forecast, by Application 2020 & 2033
- Table 16: Global Differential Cell Counter Revenue million Forecast, by Application 2020 & 2033
- Table 17: Global Differential Cell Counter Revenue million Forecast, by Types 2020 & 2033
- Table 18: Global Differential Cell Counter Revenue million Forecast, by Country 2020 & 2033
- Table 19: United Kingdom Differential Cell Counter Revenue (million) Forecast, by Application 2020 & 2033
- Table 20: Germany Differential Cell Counter Revenue (million) Forecast, by Application 2020 & 2033
- Table 21: France Differential Cell Counter Revenue (million) Forecast, by Application 2020 & 2033
- Table 22: Italy Differential Cell Counter Revenue (million) Forecast, by Application 2020 & 2033
- Table 23: Spain Differential Cell Counter Revenue (million) Forecast, by Application 2020 & 2033
- Table 24: Russia Differential Cell Counter Revenue (million) Forecast, by Application 2020 & 2033
- Table 25: Benelux Differential Cell Counter Revenue (million) Forecast, by Application 2020 & 2033
- Table 26: Nordics Differential Cell Counter Revenue (million) Forecast, by Application 2020 & 2033
- Table 27: Rest of Europe Differential Cell Counter Revenue (million) Forecast, by Application 2020 & 2033
- Table 28: Global Differential Cell Counter Revenue million Forecast, by Application 2020 & 2033
- Table 29: Global Differential Cell Counter Revenue million Forecast, by Types 2020 & 2033
- Table 30: Global Differential Cell Counter Revenue million Forecast, by Country 2020 & 2033
- Table 31: Turkey Differential Cell Counter Revenue (million) Forecast, by Application 2020 & 2033
- Table 32: Israel Differential Cell Counter Revenue (million) Forecast, by Application 2020 & 2033
- Table 33: GCC Differential Cell Counter Revenue (million) Forecast, by Application 2020 & 2033
- Table 34: North Africa Differential Cell Counter Revenue (million) Forecast, by Application 2020 & 2033
- Table 35: South Africa Differential Cell Counter Revenue (million) Forecast, by Application 2020 & 2033
- Table 36: Rest of Middle East & Africa Differential Cell Counter Revenue (million) Forecast, by Application 2020 & 2033
- Table 37: Global Differential Cell Counter Revenue million Forecast, by Application 2020 & 2033
- Table 38: Global Differential Cell Counter Revenue million Forecast, by Types 2020 & 2033
- Table 39: Global Differential Cell Counter Revenue million Forecast, by Country 2020 & 2033
- Table 40: China Differential Cell Counter Revenue (million) Forecast, by Application 2020 & 2033
- Table 41: India Differential Cell Counter Revenue (million) Forecast, by Application 2020 & 2033
- Table 42: Japan Differential Cell Counter Revenue (million) Forecast, by Application 2020 & 2033
- Table 43: South Korea Differential Cell Counter Revenue (million) Forecast, by Application 2020 & 2033
- Table 44: ASEAN Differential Cell Counter Revenue (million) Forecast, by Application 2020 & 2033
- Table 45: Oceania Differential Cell Counter Revenue (million) Forecast, by Application 2020 & 2033
- Table 46: Rest of Asia Pacific Differential Cell Counter Revenue (million) Forecast, by Application 2020 & 2033
Frequently Asked Questions
1. What is the projected Compound Annual Growth Rate (CAGR) of the Differential Cell Counter?
The projected CAGR is approximately XX%.
2. Which companies are prominent players in the Differential Cell Counter?
Key companies in the market include Thermo Fisher Scientific, LW Scientific, Modulus Data Systems, Bal Supply, MRC, Digisystem Laboratory Instruments, Heathrow Scientific, Woodley, Medicus Health, Desco Medical, Hwashin Tech, KPG Products, UNICO, Redbank Group, Labline Equipment.
3. What are the main segments of the Differential Cell Counter?
The market segments include Application, Types.
4. Can you provide details about the market size?
The market size is estimated to be USD XXX million as of 2022.
5. What are some drivers contributing to market growth?
N/A
6. What are the notable trends driving market growth?
N/A
7. Are there any restraints impacting market growth?
N/A
8. Can you provide examples of recent developments in the market?
N/A
9. What pricing options are available for accessing the report?
Pricing options include single-user, multi-user, and enterprise licenses priced at USD 2900.00, USD 4350.00, and USD 5800.00 respectively.
10. Is the market size provided in terms of value or volume?
The market size is provided in terms of value, measured in million.
11. Are there any specific market keywords associated with the report?
Yes, the market keyword associated with the report is "Differential Cell Counter," which aids in identifying and referencing the specific market segment covered.
12. How do I determine which pricing option suits my needs best?
The pricing options vary based on user requirements and access needs. Individual users may opt for single-user licenses, while businesses requiring broader access may choose multi-user or enterprise licenses for cost-effective access to the report.
13. Are there any additional resources or data provided in the Differential Cell Counter report?
While the report offers comprehensive insights, it's advisable to review the specific contents or supplementary materials provided to ascertain if additional resources or data are available.
14. How can I stay updated on further developments or reports in the Differential Cell Counter?
To stay informed about further developments, trends, and reports in the Differential Cell Counter, consider subscribing to industry newsletters, following relevant companies and organizations, or regularly checking reputable industry news sources and publications.
Methodology
Step 1 - Identification of Relevant Samples Size from Population Database


Step 2 - Approaches for Defining Global Market Size (Value, Volume* & Price*)

Note*: In applicable scenarios
Step 3 - Data Sources
Primary Research
- Web Analytics
- Survey Reports
- Research Institute
- Latest Research Reports
- Opinion Leaders
Secondary Research
- Annual Reports
- White Paper
- Latest Press Release
- Industry Association
- Paid Database
- Investor Presentations

Step 4 - Data Triangulation
Involves using different sources of information in order to increase the validity of a study
These sources are likely to be stakeholders in a program - participants, other researchers, program staff, other community members, and so on.
Then we put all data in single framework & apply various statistical tools to find out the dynamic on the market.
During the analysis stage, feedback from the stakeholder groups would be compared to determine areas of agreement as well as areas of divergence