
Key Insights
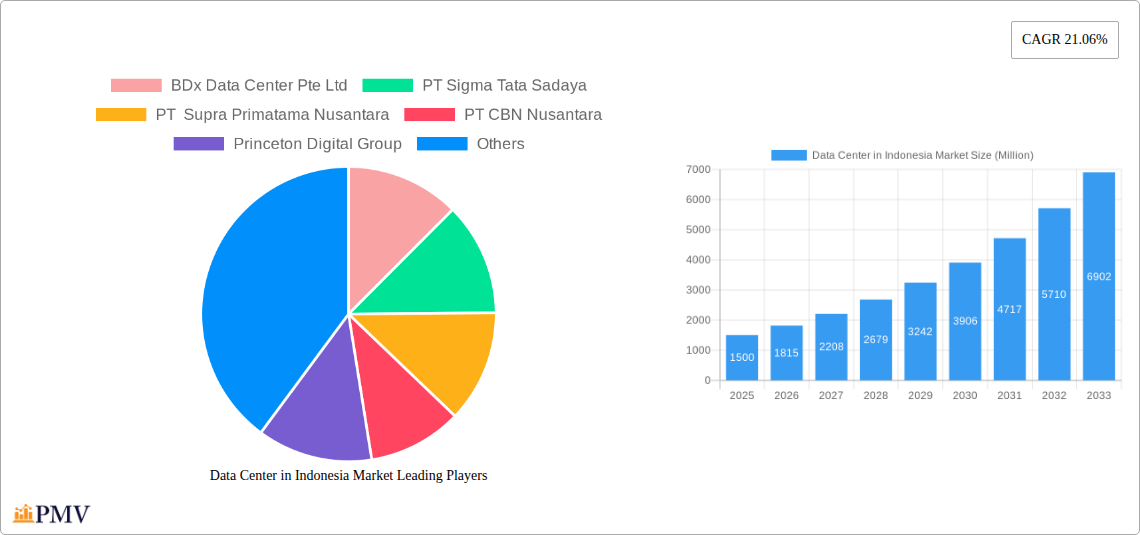
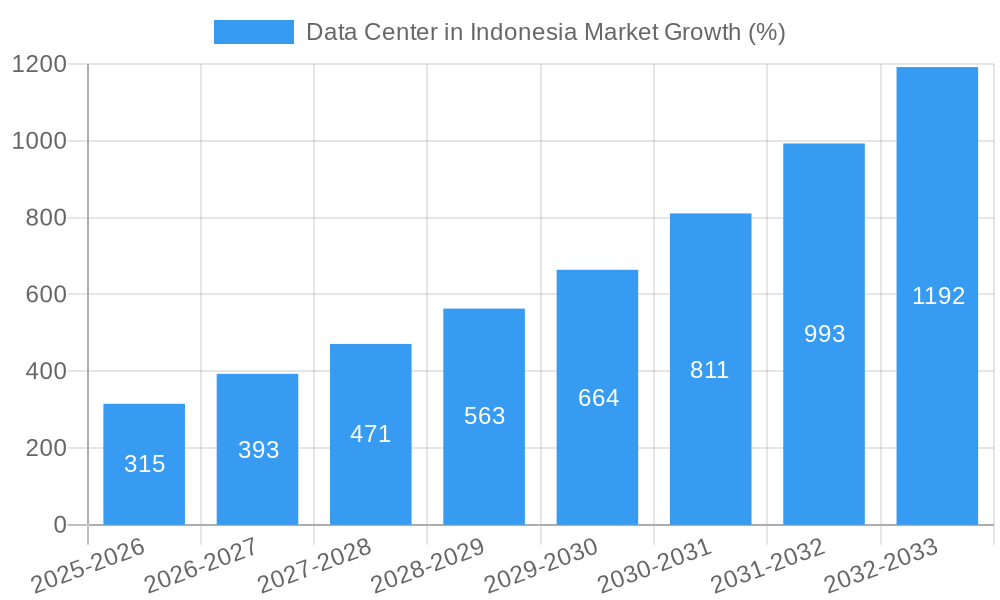
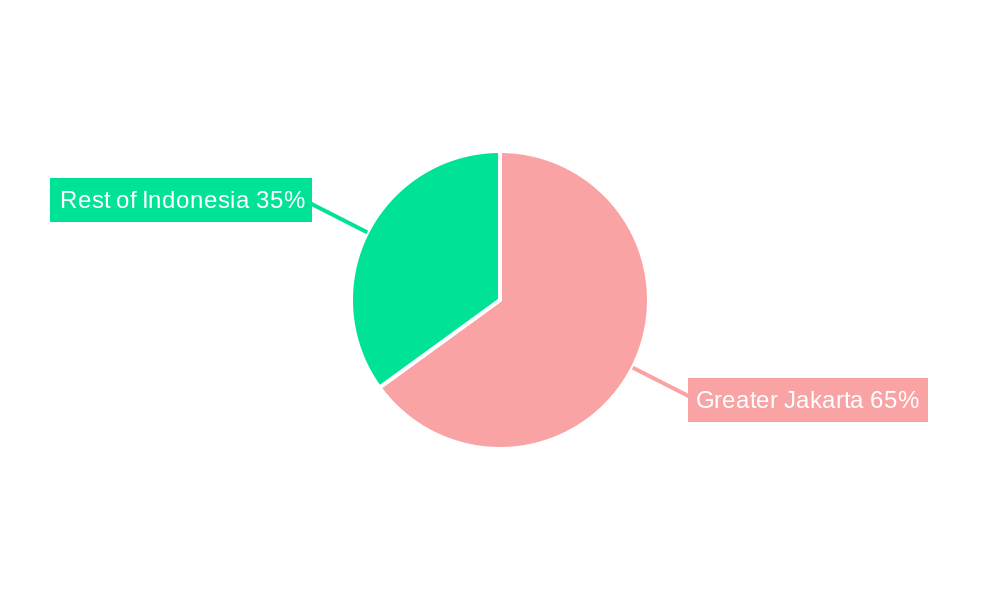
The Indonesian data center market is experiencing robust growth, driven by increasing digitalization, e-commerce expansion, and government initiatives promoting digital infrastructure development. With a CAGR of 21.06% from 2019-2024, the market demonstrates significant potential. The market size in 2025 is estimated to be substantial, considering the high CAGR and the ongoing investments in digital infrastructure within the country. Greater Jakarta serves as the primary hotspot, housing a significant concentration of data centers, reflecting the region's robust economic activity and dense population. However, growth is expected across the country as demand expands beyond major urban areas. Market segmentation reveals a mix of data center sizes, ranging from small to massive facilities, catering to diverse customer needs. The utilized absorption segment, representing data centers with high occupancy, is likely the most lucrative, reflecting the strong demand for data center capacity. Key players such as BDx Data Center Pte Ltd, PT Sigma Tata Sadaya, and PT DCI Indonesia Tbk are actively shaping the market landscape through strategic investments and expansions. The market's growth is further fueled by the increasing adoption of cloud computing, the rise of 5G networks, and the growing importance of data security and resilience.
The continued expansion of e-commerce, digital banking, and other data-intensive industries will further propel market growth in the forecast period (2025-2033). While challenges such as infrastructure limitations and energy costs exist, government initiatives aimed at improving digital infrastructure and attracting foreign investment are mitigating these restraints. The competitive landscape is characterized by a mix of domestic and international players, leading to increased innovation and service diversification. Future growth will likely be driven by the expansion of hyperscale data centers, the increasing adoption of edge computing, and the growth of specialized data center services catering to specific industry needs. The Indonesian data center market presents a compelling investment opportunity for both domestic and international players, given its significant growth potential and supportive regulatory environment.
This in-depth report provides a detailed analysis of the burgeoning data center market in Indonesia, offering invaluable insights for investors, industry professionals, and strategic decision-makers. The report covers the period from 2019 to 2033, with a focus on the base year 2025 and a forecast period extending to 2033. This comprehensive study analyzes market structure, competitive dynamics, industry trends, and key growth drivers, offering actionable intelligence for navigating this rapidly evolving landscape. The report's analysis incorporates detailed segmentations across Tier type, absorption, end-user, hotspot location, and data center size, providing a granular understanding of market opportunities. The study incorporates data on key players including BDx Data Center Pte Ltd, PT Sigma Tata Sadaya, PT Supra Primatama Nusantara, PT CBN Nusantara, Princeton Digital Group, EdgeConneX Inc, PT Faasri Utama Sakti, Digital Edge (Singapore) Holdings Pte Ltd, PT DCI Indonesia Tbk, Space DC Pte Ltd, NTT Ltd, and Nusantara Data Center. Projected market values are presented in Millions.
Data Center in Indonesia Market Market Structure & Competitive Dynamics
The Indonesian data center market exhibits a dynamic interplay of established players and emerging entrants, resulting in a moderately concentrated market structure. While a few large players hold significant market share, numerous smaller companies contribute to the overall competitive landscape. Innovation ecosystems are developing, fueled by government initiatives and increased private investment. The regulatory framework is evolving, aiming to balance the promotion of digital growth with data security and privacy concerns. Product substitution is minimal, with the primary competition focusing on aspects such as service level agreements (SLAs), pricing, and geographic reach. The market witnesses significant end-user shifts towards cloud-based services and increasing demand from hyperscale providers.
Mergers and acquisitions (M&A) activities have been notable, such as the August 2022 transfer of Telkomsigma's data center business to PT Telkom Data Ekosistem (TDE) for IDR 2.01 Trillion (approximately USD xx Million). These M&A activities demonstrate the consolidation trends within the market and the pursuit of economies of scale. The market share distribution is currently estimated as follows (2025): Top 3 players: xx%, Next 5 players: xx%, Remaining players: xx%. Further M&A activity valued at approximately USD xx Million is anticipated within the next five years.
Data Center in Indonesia Market Industry Trends & Insights
The Indonesian data center market is experiencing robust growth, driven by the exponential rise in digital adoption across various sectors. This is fuelled by increasing internet penetration, government initiatives promoting digitalization, and the burgeoning e-commerce and fintech sectors. Technological disruptions, such as the increasing adoption of edge computing and AI-powered solutions, further contribute to market expansion. Consumer preference for seamless digital experiences drives demand for high-capacity, low-latency data centers. The competitive dynamics are shaped by capacity expansion, infrastructure investments, and the ongoing pursuit of operational efficiency. The market CAGR from 2025 to 2033 is estimated at xx%, resulting in a market size of USD xx Million by 2033. Market penetration, measured by data center capacity per capita, is projected to increase from xx to xx by 2033.
Dominant Markets & Segments in Data Center in Indonesia Market
- Leading Region: Greater Jakarta dominates the Indonesian data center market due to its concentration of businesses, strong digital infrastructure, and skilled workforce.
- Dominant Tier Type: Tier III and Tier IV data centers are experiencing the highest growth due to the demand for high reliability and availability.
- Key Absorption Segment: Utilized capacity currently dominates; however, non-utilized capacity is expected to shrink as demand increases.
- Largest End-User Segment: Other end-users (a broad category encompassing various industries) currently account for the largest share of the market, with financial services and cloud providers demonstrating rapid growth.
- Data Center Size: The demand for large and mega data centers is significantly outpacing smaller sizes, driven by the needs of hyperscalers.
Greater Jakarta's dominance stems from factors including its established digital infrastructure, proximity to key economic hubs, and access to a larger talent pool. The growth of other regions hinges on infrastructure development and policy support. The expansion of high-capacity, high-availability data centers is a direct response to the rising demand from hyperscale providers and the need for business continuity and disaster recovery. The "Other End-User" segment's broad base contributes to consistent demand across various business cycles.
Data Center in Indonesia Market Product Innovations
Recent product innovations in the Indonesian data center market focus on enhancing energy efficiency, improving resilience through redundant infrastructure, and expanding capacity to accommodate the increasing demand for high-power density applications. Hyperscale-ready facilities with advanced cooling systems and robust security features are gaining traction, aligning with the preferences of major cloud providers and large enterprises. These innovations are crucial for attracting investments and meeting the evolving needs of businesses operating in a rapidly transforming digital economy.
Report Segmentation & Scope
This report segments the Indonesian data center market in multiple dimensions:
Tier Type: Tier I & II, Tier III, Tier IV (with growth projections and market sizes for each). Competitive dynamics vary based on the level of redundancy and resilience offered.
Absorption: Utilized and Non-Utilized Capacity (with analysis of capacity utilization rates and projections for future absorption).
End-User: Hyperscale Providers, Cloud Providers, Financial Services, Telecommunications, and Other End-Users (market size and growth projections for each segment).
Hotspot: Greater Jakarta and Rest of Indonesia (detailed regional analysis including infrastructure development and government initiatives).
Data Center Size: Small, Medium, Mega, Large, Massive (market share and growth projections for each size category).
Key Drivers of Data Center in Indonesia Market Growth
The Indonesian data center market is driven by strong technological advancements, a rapidly expanding digital economy, and supportive government policies. The proliferation of cloud computing, the expansion of 5G networks, and the increasing adoption of artificial intelligence are key technological drivers. Economically, the surge in e-commerce, fintech, and digital services fuels demand for robust data center infrastructure. Government initiatives focusing on digital transformation and infrastructure development provide the necessary regulatory and financial support. The recent USD 300 Million investment by BDx in Indonesia exemplifies this growth.
Challenges in the Data Center in Indonesia Market Sector
The Indonesian data center market faces challenges, including securing sufficient power supply, managing land acquisition complexities, and maintaining skilled workforce availability. Regulatory hurdles related to data sovereignty and cybersecurity remain. Supply chain disruptions can impact the timely delivery of equipment. Intense competition from both domestic and international players necessitates a continuous focus on cost optimization and operational efficiency.
Leading Players in the Data Center in Indonesia Market Market
- BDx Data Center Pte Ltd
- PT Sigma Tata Sadaya
- PT Supra Primatama Nusantara
- PT CBN Nusantara
- Princeton Digital Group
- EdgeConneX Inc
- PT Faasri Utama Sakti
- Digital Edge (Singapore) Holdings Pte Ltd
- PT DCI Indonesia Tbk
- Space DC Pte Ltd
- NTT Ltd
- Nusantara Data Center
Key Developments in Data Center in Indonesia Market Sector
- September 2022: Commencement of construction of a 23MW data center in Jakarta by a major player, signifying significant investment and capacity expansion in the market.
- August 2022: Transfer of Telkomsigma's data center business to TDE for IDR 2.01 Trillion (approximately USD xx Million), reflecting market consolidation.
- June 2022: Launch of BDx Indonesia via a USD 300 Million joint venture, showcasing strong foreign investment confidence.
These developments highlight the ongoing growth, consolidation, and foreign investment in the Indonesian data center sector.
Strategic Data Center in Indonesia Market Market Outlook
The Indonesian data center market presents a highly promising outlook, driven by continued digital transformation across various sectors and sustained foreign investment. The expansion of digital infrastructure, supportive government policies, and increasing demand for cloud services will fuel further growth. Strategic opportunities exist in developing energy-efficient data centers, leveraging edge computing technologies, and catering to the specific needs of hyperscale providers. The focus on digital inclusion and national infrastructure development will continue to be a strong catalyst for future expansion.
Data Center in Indonesia Market Segmentation
-
1. Hotspot
- 1.1. Greater Jakarta
- 1.2. Rest of Indonesia
-
2. Data Center Size
- 2.1. Large
- 2.2. Massive
- 2.3. Medium
- 2.4. Mega
- 2.5. Small
-
3. Tier Type
- 3.1. Tier 1 and 2
- 3.2. Tier 3
- 3.3. Tier 4
-
4. Absorption
- 4.1. Non-Utilized
-
5. Colocation Type
- 5.1. Hyperscale
- 5.2. Retail
- 5.3. Wholesale
-
6. End User
- 6.1. BFSI
- 6.2. Cloud
- 6.3. E-Commerce
- 6.4. Government
- 6.5. Manufacturing
- 6.6. Media & Entertainment
- 6.7. Telecom
- 6.8. Other End User
Data Center in Indonesia Market Segmentation By Geography
-
1. North America
- 1.1. United States
- 1.2. Canada
- 1.3. Mexico
-
2. South America
- 2.1. Brazil
- 2.2. Argentina
- 2.3. Rest of South America
-
3. Europe
- 3.1. United Kingdom
- 3.2. Germany
- 3.3. France
- 3.4. Italy
- 3.5. Spain
- 3.6. Russia
- 3.7. Benelux
- 3.8. Nordics
- 3.9. Rest of Europe
-
4. Middle East & Africa
- 4.1. Turkey
- 4.2. Israel
- 4.3. GCC
- 4.4. North Africa
- 4.5. South Africa
- 4.6. Rest of Middle East & Africa
-
5. Asia Pacific
- 5.1. China
- 5.2. India
- 5.3. Japan
- 5.4. South Korea
- 5.5. ASEAN
- 5.6. Oceania
- 5.7. Rest of Asia Pacific
Data Center in Indonesia Market REPORT HIGHLIGHTS
| Aspects | Details |
|---|---|
| Study Period | 2019-2033 |
| Base Year | 2024 |
| Estimated Year | 2025 |
| Forecast Period | 2025-2033 |
| Historical Period | 2019-2024 |
| Growth Rate | CAGR of 21.06% from 2019-2033 |
| Segmentation |
|
Table of Contents
- 1. Introduction
- 1.1. Research Scope
- 1.2. Market Segmentation
- 1.3. Research Methodology
- 1.4. Definitions and Assumptions
- 2. Executive Summary
- 2.1. Introduction
- 3. Market Dynamics
- 3.1. Introduction
- 3.2. Market Drivers
- 3.2.1. Rise of E-Commerce; Flourishing Startup Culture
- 3.3. Market Restrains
- 3.3.1. Slow Penetration Rate in Developing Countries
- 3.4. Market Trends
- 3.4.1. OTHER KEY INDUSTRY TRENDS COVERED IN THE REPORT
- 4. Market Factor Analysis
- 4.1. Porters Five Forces
- 4.2. Supply/Value Chain
- 4.3. PESTEL analysis
- 4.4. Market Entropy
- 4.5. Patent/Trademark Analysis
- 5. Global Data Center in Indonesia Market Analysis, Insights and Forecast, 2019-2031
- 5.1. Market Analysis, Insights and Forecast - by Hotspot
- 5.1.1. Greater Jakarta
- 5.1.2. Rest of Indonesia
- 5.2. Market Analysis, Insights and Forecast - by Data Center Size
- 5.2.1. Large
- 5.2.2. Massive
- 5.2.3. Medium
- 5.2.4. Mega
- 5.2.5. Small
- 5.3. Market Analysis, Insights and Forecast - by Tier Type
- 5.3.1. Tier 1 and 2
- 5.3.2. Tier 3
- 5.3.3. Tier 4
- 5.4. Market Analysis, Insights and Forecast - by Absorption
- 5.4.1. Non-Utilized
- 5.5. Market Analysis, Insights and Forecast - by Colocation Type
- 5.5.1. Hyperscale
- 5.5.2. Retail
- 5.5.3. Wholesale
- 5.6. Market Analysis, Insights and Forecast - by End User
- 5.6.1. BFSI
- 5.6.2. Cloud
- 5.6.3. E-Commerce
- 5.6.4. Government
- 5.6.5. Manufacturing
- 5.6.6. Media & Entertainment
- 5.6.7. Telecom
- 5.6.8. Other End User
- 5.7. Market Analysis, Insights and Forecast - by Region
- 5.7.1. North America
- 5.7.2. South America
- 5.7.3. Europe
- 5.7.4. Middle East & Africa
- 5.7.5. Asia Pacific
- 5.1. Market Analysis, Insights and Forecast - by Hotspot
- 6. North America Data Center in Indonesia Market Analysis, Insights and Forecast, 2019-2031
- 6.1. Market Analysis, Insights and Forecast - by Hotspot
- 6.1.1. Greater Jakarta
- 6.1.2. Rest of Indonesia
- 6.2. Market Analysis, Insights and Forecast - by Data Center Size
- 6.2.1. Large
- 6.2.2. Massive
- 6.2.3. Medium
- 6.2.4. Mega
- 6.2.5. Small
- 6.3. Market Analysis, Insights and Forecast - by Tier Type
- 6.3.1. Tier 1 and 2
- 6.3.2. Tier 3
- 6.3.3. Tier 4
- 6.4. Market Analysis, Insights and Forecast - by Absorption
- 6.4.1. Non-Utilized
- 6.5. Market Analysis, Insights and Forecast - by Colocation Type
- 6.5.1. Hyperscale
- 6.5.2. Retail
- 6.5.3. Wholesale
- 6.6. Market Analysis, Insights and Forecast - by End User
- 6.6.1. BFSI
- 6.6.2. Cloud
- 6.6.3. E-Commerce
- 6.6.4. Government
- 6.6.5. Manufacturing
- 6.6.6. Media & Entertainment
- 6.6.7. Telecom
- 6.6.8. Other End User
- 6.1. Market Analysis, Insights and Forecast - by Hotspot
- 7. South America Data Center in Indonesia Market Analysis, Insights and Forecast, 2019-2031
- 7.1. Market Analysis, Insights and Forecast - by Hotspot
- 7.1.1. Greater Jakarta
- 7.1.2. Rest of Indonesia
- 7.2. Market Analysis, Insights and Forecast - by Data Center Size
- 7.2.1. Large
- 7.2.2. Massive
- 7.2.3. Medium
- 7.2.4. Mega
- 7.2.5. Small
- 7.3. Market Analysis, Insights and Forecast - by Tier Type
- 7.3.1. Tier 1 and 2
- 7.3.2. Tier 3
- 7.3.3. Tier 4
- 7.4. Market Analysis, Insights and Forecast - by Absorption
- 7.4.1. Non-Utilized
- 7.5. Market Analysis, Insights and Forecast - by Colocation Type
- 7.5.1. Hyperscale
- 7.5.2. Retail
- 7.5.3. Wholesale
- 7.6. Market Analysis, Insights and Forecast - by End User
- 7.6.1. BFSI
- 7.6.2. Cloud
- 7.6.3. E-Commerce
- 7.6.4. Government
- 7.6.5. Manufacturing
- 7.6.6. Media & Entertainment
- 7.6.7. Telecom
- 7.6.8. Other End User
- 7.1. Market Analysis, Insights and Forecast - by Hotspot
- 8. Europe Data Center in Indonesia Market Analysis, Insights and Forecast, 2019-2031
- 8.1. Market Analysis, Insights and Forecast - by Hotspot
- 8.1.1. Greater Jakarta
- 8.1.2. Rest of Indonesia
- 8.2. Market Analysis, Insights and Forecast - by Data Center Size
- 8.2.1. Large
- 8.2.2. Massive
- 8.2.3. Medium
- 8.2.4. Mega
- 8.2.5. Small
- 8.3. Market Analysis, Insights and Forecast - by Tier Type
- 8.3.1. Tier 1 and 2
- 8.3.2. Tier 3
- 8.3.3. Tier 4
- 8.4. Market Analysis, Insights and Forecast - by Absorption
- 8.4.1. Non-Utilized
- 8.5. Market Analysis, Insights and Forecast - by Colocation Type
- 8.5.1. Hyperscale
- 8.5.2. Retail
- 8.5.3. Wholesale
- 8.6. Market Analysis, Insights and Forecast - by End User
- 8.6.1. BFSI
- 8.6.2. Cloud
- 8.6.3. E-Commerce
- 8.6.4. Government
- 8.6.5. Manufacturing
- 8.6.6. Media & Entertainment
- 8.6.7. Telecom
- 8.6.8. Other End User
- 8.1. Market Analysis, Insights and Forecast - by Hotspot
- 9. Middle East & Africa Data Center in Indonesia Market Analysis, Insights and Forecast, 2019-2031
- 9.1. Market Analysis, Insights and Forecast - by Hotspot
- 9.1.1. Greater Jakarta
- 9.1.2. Rest of Indonesia
- 9.2. Market Analysis, Insights and Forecast - by Data Center Size
- 9.2.1. Large
- 9.2.2. Massive
- 9.2.3. Medium
- 9.2.4. Mega
- 9.2.5. Small
- 9.3. Market Analysis, Insights and Forecast - by Tier Type
- 9.3.1. Tier 1 and 2
- 9.3.2. Tier 3
- 9.3.3. Tier 4
- 9.4. Market Analysis, Insights and Forecast - by Absorption
- 9.4.1. Non-Utilized
- 9.5. Market Analysis, Insights and Forecast - by Colocation Type
- 9.5.1. Hyperscale
- 9.5.2. Retail
- 9.5.3. Wholesale
- 9.6. Market Analysis, Insights and Forecast - by End User
- 9.6.1. BFSI
- 9.6.2. Cloud
- 9.6.3. E-Commerce
- 9.6.4. Government
- 9.6.5. Manufacturing
- 9.6.6. Media & Entertainment
- 9.6.7. Telecom
- 9.6.8. Other End User
- 9.1. Market Analysis, Insights and Forecast - by Hotspot
- 10. Asia Pacific Data Center in Indonesia Market Analysis, Insights and Forecast, 2019-2031
- 10.1. Market Analysis, Insights and Forecast - by Hotspot
- 10.1.1. Greater Jakarta
- 10.1.2. Rest of Indonesia
- 10.2. Market Analysis, Insights and Forecast - by Data Center Size
- 10.2.1. Large
- 10.2.2. Massive
- 10.2.3. Medium
- 10.2.4. Mega
- 10.2.5. Small
- 10.3. Market Analysis, Insights and Forecast - by Tier Type
- 10.3.1. Tier 1 and 2
- 10.3.2. Tier 3
- 10.3.3. Tier 4
- 10.4. Market Analysis, Insights and Forecast - by Absorption
- 10.4.1. Non-Utilized
- 10.5. Market Analysis, Insights and Forecast - by Colocation Type
- 10.5.1. Hyperscale
- 10.5.2. Retail
- 10.5.3. Wholesale
- 10.6. Market Analysis, Insights and Forecast - by End User
- 10.6.1. BFSI
- 10.6.2. Cloud
- 10.6.3. E-Commerce
- 10.6.4. Government
- 10.6.5. Manufacturing
- 10.6.6. Media & Entertainment
- 10.6.7. Telecom
- 10.6.8. Other End User
- 10.1. Market Analysis, Insights and Forecast - by Hotspot
- 11. Competitive Analysis
- 11.1. Global Market Share Analysis 2024
- 11.2. Company Profiles
- 11.2.1 BDx Data Center Pte Ltd
- 11.2.1.1. Overview
- 11.2.1.2. Products
- 11.2.1.3. SWOT Analysis
- 11.2.1.4. Recent Developments
- 11.2.1.5. Financials (Based on Availability)
- 11.2.2 PT Sigma Tata Sadaya
- 11.2.2.1. Overview
- 11.2.2.2. Products
- 11.2.2.3. SWOT Analysis
- 11.2.2.4. Recent Developments
- 11.2.2.5. Financials (Based on Availability)
- 11.2.3 PT Supra Primatama Nusantara
- 11.2.3.1. Overview
- 11.2.3.2. Products
- 11.2.3.3. SWOT Analysis
- 11.2.3.4. Recent Developments
- 11.2.3.5. Financials (Based on Availability)
- 11.2.4 PT CBN Nusantara
- 11.2.4.1. Overview
- 11.2.4.2. Products
- 11.2.4.3. SWOT Analysis
- 11.2.4.4. Recent Developments
- 11.2.4.5. Financials (Based on Availability)
- 11.2.5 Princeton Digital Group
- 11.2.5.1. Overview
- 11.2.5.2. Products
- 11.2.5.3. SWOT Analysis
- 11.2.5.4. Recent Developments
- 11.2.5.5. Financials (Based on Availability)
- 11.2.6 EdgeConneX Inc
- 11.2.6.1. Overview
- 11.2.6.2. Products
- 11.2.6.3. SWOT Analysis
- 11.2.6.4. Recent Developments
- 11.2.6.5. Financials (Based on Availability)
- 11.2.7 PT Faasri Utama Sakti
- 11.2.7.1. Overview
- 11.2.7.2. Products
- 11.2.7.3. SWOT Analysis
- 11.2.7.4. Recent Developments
- 11.2.7.5. Financials (Based on Availability)
- 11.2.8 Digital Edge (Singapore) Holdings Pte Ltd
- 11.2.8.1. Overview
- 11.2.8.2. Products
- 11.2.8.3. SWOT Analysis
- 11.2.8.4. Recent Developments
- 11.2.8.5. Financials (Based on Availability)
- 11.2.9 PT DCI Indonesia Tbk
- 11.2.9.1. Overview
- 11.2.9.2. Products
- 11.2.9.3. SWOT Analysis
- 11.2.9.4. Recent Developments
- 11.2.9.5. Financials (Based on Availability)
- 11.2.10 Space DC Pte Ltd5 4 LIST OF COMPANIES STUDIE
- 11.2.10.1. Overview
- 11.2.10.2. Products
- 11.2.10.3. SWOT Analysis
- 11.2.10.4. Recent Developments
- 11.2.10.5. Financials (Based on Availability)
- 11.2.11 NTT Ltd
- 11.2.11.1. Overview
- 11.2.11.2. Products
- 11.2.11.3. SWOT Analysis
- 11.2.11.4. Recent Developments
- 11.2.11.5. Financials (Based on Availability)
- 11.2.12 Nusantara Data Center
- 11.2.12.1. Overview
- 11.2.12.2. Products
- 11.2.12.3. SWOT Analysis
- 11.2.12.4. Recent Developments
- 11.2.12.5. Financials (Based on Availability)
- 11.2.1 BDx Data Center Pte Ltd
List of Figures
- Figure 1: Global Data Center in Indonesia Market Revenue Breakdown (Million, %) by Region 2024 & 2032
- Figure 2: Indonesia Data Center in Indonesia Market Revenue (Million), by Country 2024 & 2032
- Figure 3: Indonesia Data Center in Indonesia Market Revenue Share (%), by Country 2024 & 2032
- Figure 4: North America Data Center in Indonesia Market Revenue (Million), by Hotspot 2024 & 2032
- Figure 5: North America Data Center in Indonesia Market Revenue Share (%), by Hotspot 2024 & 2032
- Figure 6: North America Data Center in Indonesia Market Revenue (Million), by Data Center Size 2024 & 2032
- Figure 7: North America Data Center in Indonesia Market Revenue Share (%), by Data Center Size 2024 & 2032
- Figure 8: North America Data Center in Indonesia Market Revenue (Million), by Tier Type 2024 & 2032
- Figure 9: North America Data Center in Indonesia Market Revenue Share (%), by Tier Type 2024 & 2032
- Figure 10: North America Data Center in Indonesia Market Revenue (Million), by Absorption 2024 & 2032
- Figure 11: North America Data Center in Indonesia Market Revenue Share (%), by Absorption 2024 & 2032
- Figure 12: North America Data Center in Indonesia Market Revenue (Million), by Colocation Type 2024 & 2032
- Figure 13: North America Data Center in Indonesia Market Revenue Share (%), by Colocation Type 2024 & 2032
- Figure 14: North America Data Center in Indonesia Market Revenue (Million), by End User 2024 & 2032
- Figure 15: North America Data Center in Indonesia Market Revenue Share (%), by End User 2024 & 2032
- Figure 16: North America Data Center in Indonesia Market Revenue (Million), by Country 2024 & 2032
- Figure 17: North America Data Center in Indonesia Market Revenue Share (%), by Country 2024 & 2032
- Figure 18: South America Data Center in Indonesia Market Revenue (Million), by Hotspot 2024 & 2032
- Figure 19: South America Data Center in Indonesia Market Revenue Share (%), by Hotspot 2024 & 2032
- Figure 20: South America Data Center in Indonesia Market Revenue (Million), by Data Center Size 2024 & 2032
- Figure 21: South America Data Center in Indonesia Market Revenue Share (%), by Data Center Size 2024 & 2032
- Figure 22: South America Data Center in Indonesia Market Revenue (Million), by Tier Type 2024 & 2032
- Figure 23: South America Data Center in Indonesia Market Revenue Share (%), by Tier Type 2024 & 2032
- Figure 24: South America Data Center in Indonesia Market Revenue (Million), by Absorption 2024 & 2032
- Figure 25: South America Data Center in Indonesia Market Revenue Share (%), by Absorption 2024 & 2032
- Figure 26: South America Data Center in Indonesia Market Revenue (Million), by Colocation Type 2024 & 2032
- Figure 27: South America Data Center in Indonesia Market Revenue Share (%), by Colocation Type 2024 & 2032
- Figure 28: South America Data Center in Indonesia Market Revenue (Million), by End User 2024 & 2032
- Figure 29: South America Data Center in Indonesia Market Revenue Share (%), by End User 2024 & 2032
- Figure 30: South America Data Center in Indonesia Market Revenue (Million), by Country 2024 & 2032
- Figure 31: South America Data Center in Indonesia Market Revenue Share (%), by Country 2024 & 2032
- Figure 32: Europe Data Center in Indonesia Market Revenue (Million), by Hotspot 2024 & 2032
- Figure 33: Europe Data Center in Indonesia Market Revenue Share (%), by Hotspot 2024 & 2032
- Figure 34: Europe Data Center in Indonesia Market Revenue (Million), by Data Center Size 2024 & 2032
- Figure 35: Europe Data Center in Indonesia Market Revenue Share (%), by Data Center Size 2024 & 2032
- Figure 36: Europe Data Center in Indonesia Market Revenue (Million), by Tier Type 2024 & 2032
- Figure 37: Europe Data Center in Indonesia Market Revenue Share (%), by Tier Type 2024 & 2032
- Figure 38: Europe Data Center in Indonesia Market Revenue (Million), by Absorption 2024 & 2032
- Figure 39: Europe Data Center in Indonesia Market Revenue Share (%), by Absorption 2024 & 2032
- Figure 40: Europe Data Center in Indonesia Market Revenue (Million), by Colocation Type 2024 & 2032
- Figure 41: Europe Data Center in Indonesia Market Revenue Share (%), by Colocation Type 2024 & 2032
- Figure 42: Europe Data Center in Indonesia Market Revenue (Million), by End User 2024 & 2032
- Figure 43: Europe Data Center in Indonesia Market Revenue Share (%), by End User 2024 & 2032
- Figure 44: Europe Data Center in Indonesia Market Revenue (Million), by Country 2024 & 2032
- Figure 45: Europe Data Center in Indonesia Market Revenue Share (%), by Country 2024 & 2032
- Figure 46: Middle East & Africa Data Center in Indonesia Market Revenue (Million), by Hotspot 2024 & 2032
- Figure 47: Middle East & Africa Data Center in Indonesia Market Revenue Share (%), by Hotspot 2024 & 2032
- Figure 48: Middle East & Africa Data Center in Indonesia Market Revenue (Million), by Data Center Size 2024 & 2032
- Figure 49: Middle East & Africa Data Center in Indonesia Market Revenue Share (%), by Data Center Size 2024 & 2032
- Figure 50: Middle East & Africa Data Center in Indonesia Market Revenue (Million), by Tier Type 2024 & 2032
- Figure 51: Middle East & Africa Data Center in Indonesia Market Revenue Share (%), by Tier Type 2024 & 2032
- Figure 52: Middle East & Africa Data Center in Indonesia Market Revenue (Million), by Absorption 2024 & 2032
- Figure 53: Middle East & Africa Data Center in Indonesia Market Revenue Share (%), by Absorption 2024 & 2032
- Figure 54: Middle East & Africa Data Center in Indonesia Market Revenue (Million), by Colocation Type 2024 & 2032
- Figure 55: Middle East & Africa Data Center in Indonesia Market Revenue Share (%), by Colocation Type 2024 & 2032
- Figure 56: Middle East & Africa Data Center in Indonesia Market Revenue (Million), by End User 2024 & 2032
- Figure 57: Middle East & Africa Data Center in Indonesia Market Revenue Share (%), by End User 2024 & 2032
- Figure 58: Middle East & Africa Data Center in Indonesia Market Revenue (Million), by Country 2024 & 2032
- Figure 59: Middle East & Africa Data Center in Indonesia Market Revenue Share (%), by Country 2024 & 2032
- Figure 60: Asia Pacific Data Center in Indonesia Market Revenue (Million), by Hotspot 2024 & 2032
- Figure 61: Asia Pacific Data Center in Indonesia Market Revenue Share (%), by Hotspot 2024 & 2032
- Figure 62: Asia Pacific Data Center in Indonesia Market Revenue (Million), by Data Center Size 2024 & 2032
- Figure 63: Asia Pacific Data Center in Indonesia Market Revenue Share (%), by Data Center Size 2024 & 2032
- Figure 64: Asia Pacific Data Center in Indonesia Market Revenue (Million), by Tier Type 2024 & 2032
- Figure 65: Asia Pacific Data Center in Indonesia Market Revenue Share (%), by Tier Type 2024 & 2032
- Figure 66: Asia Pacific Data Center in Indonesia Market Revenue (Million), by Absorption 2024 & 2032
- Figure 67: Asia Pacific Data Center in Indonesia Market Revenue Share (%), by Absorption 2024 & 2032
- Figure 68: Asia Pacific Data Center in Indonesia Market Revenue (Million), by Colocation Type 2024 & 2032
- Figure 69: Asia Pacific Data Center in Indonesia Market Revenue Share (%), by Colocation Type 2024 & 2032
- Figure 70: Asia Pacific Data Center in Indonesia Market Revenue (Million), by End User 2024 & 2032
- Figure 71: Asia Pacific Data Center in Indonesia Market Revenue Share (%), by End User 2024 & 2032
- Figure 72: Asia Pacific Data Center in Indonesia Market Revenue (Million), by Country 2024 & 2032
- Figure 73: Asia Pacific Data Center in Indonesia Market Revenue Share (%), by Country 2024 & 2032
List of Tables
- Table 1: Global Data Center in Indonesia Market Revenue Million Forecast, by Region 2019 & 2032
- Table 2: Global Data Center in Indonesia Market Revenue Million Forecast, by Hotspot 2019 & 2032
- Table 3: Global Data Center in Indonesia Market Revenue Million Forecast, by Data Center Size 2019 & 2032
- Table 4: Global Data Center in Indonesia Market Revenue Million Forecast, by Tier Type 2019 & 2032
- Table 5: Global Data Center in Indonesia Market Revenue Million Forecast, by Absorption 2019 & 2032
- Table 6: Global Data Center in Indonesia Market Revenue Million Forecast, by Colocation Type 2019 & 2032
- Table 7: Global Data Center in Indonesia Market Revenue Million Forecast, by End User 2019 & 2032
- Table 8: Global Data Center in Indonesia Market Revenue Million Forecast, by Region 2019 & 2032
- Table 9: Global Data Center in Indonesia Market Revenue Million Forecast, by Country 2019 & 2032
- Table 10: Global Data Center in Indonesia Market Revenue Million Forecast, by Hotspot 2019 & 2032
- Table 11: Global Data Center in Indonesia Market Revenue Million Forecast, by Data Center Size 2019 & 2032
- Table 12: Global Data Center in Indonesia Market Revenue Million Forecast, by Tier Type 2019 & 2032
- Table 13: Global Data Center in Indonesia Market Revenue Million Forecast, by Absorption 2019 & 2032
- Table 14: Global Data Center in Indonesia Market Revenue Million Forecast, by Colocation Type 2019 & 2032
- Table 15: Global Data Center in Indonesia Market Revenue Million Forecast, by End User 2019 & 2032
- Table 16: Global Data Center in Indonesia Market Revenue Million Forecast, by Country 2019 & 2032
- Table 17: United States Data Center in Indonesia Market Revenue (Million) Forecast, by Application 2019 & 2032
- Table 18: Canada Data Center in Indonesia Market Revenue (Million) Forecast, by Application 2019 & 2032
- Table 19: Mexico Data Center in Indonesia Market Revenue (Million) Forecast, by Application 2019 & 2032
- Table 20: Global Data Center in Indonesia Market Revenue Million Forecast, by Hotspot 2019 & 2032
- Table 21: Global Data Center in Indonesia Market Revenue Million Forecast, by Data Center Size 2019 & 2032
- Table 22: Global Data Center in Indonesia Market Revenue Million Forecast, by Tier Type 2019 & 2032
- Table 23: Global Data Center in Indonesia Market Revenue Million Forecast, by Absorption 2019 & 2032
- Table 24: Global Data Center in Indonesia Market Revenue Million Forecast, by Colocation Type 2019 & 2032
- Table 25: Global Data Center in Indonesia Market Revenue Million Forecast, by End User 2019 & 2032
- Table 26: Global Data Center in Indonesia Market Revenue Million Forecast, by Country 2019 & 2032
- Table 27: Brazil Data Center in Indonesia Market Revenue (Million) Forecast, by Application 2019 & 2032
- Table 28: Argentina Data Center in Indonesia Market Revenue (Million) Forecast, by Application 2019 & 2032
- Table 29: Rest of South America Data Center in Indonesia Market Revenue (Million) Forecast, by Application 2019 & 2032
- Table 30: Global Data Center in Indonesia Market Revenue Million Forecast, by Hotspot 2019 & 2032
- Table 31: Global Data Center in Indonesia Market Revenue Million Forecast, by Data Center Size 2019 & 2032
- Table 32: Global Data Center in Indonesia Market Revenue Million Forecast, by Tier Type 2019 & 2032
- Table 33: Global Data Center in Indonesia Market Revenue Million Forecast, by Absorption 2019 & 2032
- Table 34: Global Data Center in Indonesia Market Revenue Million Forecast, by Colocation Type 2019 & 2032
- Table 35: Global Data Center in Indonesia Market Revenue Million Forecast, by End User 2019 & 2032
- Table 36: Global Data Center in Indonesia Market Revenue Million Forecast, by Country 2019 & 2032
- Table 37: United Kingdom Data Center in Indonesia Market Revenue (Million) Forecast, by Application 2019 & 2032
- Table 38: Germany Data Center in Indonesia Market Revenue (Million) Forecast, by Application 2019 & 2032
- Table 39: France Data Center in Indonesia Market Revenue (Million) Forecast, by Application 2019 & 2032
- Table 40: Italy Data Center in Indonesia Market Revenue (Million) Forecast, by Application 2019 & 2032
- Table 41: Spain Data Center in Indonesia Market Revenue (Million) Forecast, by Application 2019 & 2032
- Table 42: Russia Data Center in Indonesia Market Revenue (Million) Forecast, by Application 2019 & 2032
- Table 43: Benelux Data Center in Indonesia Market Revenue (Million) Forecast, by Application 2019 & 2032
- Table 44: Nordics Data Center in Indonesia Market Revenue (Million) Forecast, by Application 2019 & 2032
- Table 45: Rest of Europe Data Center in Indonesia Market Revenue (Million) Forecast, by Application 2019 & 2032
- Table 46: Global Data Center in Indonesia Market Revenue Million Forecast, by Hotspot 2019 & 2032
- Table 47: Global Data Center in Indonesia Market Revenue Million Forecast, by Data Center Size 2019 & 2032
- Table 48: Global Data Center in Indonesia Market Revenue Million Forecast, by Tier Type 2019 & 2032
- Table 49: Global Data Center in Indonesia Market Revenue Million Forecast, by Absorption 2019 & 2032
- Table 50: Global Data Center in Indonesia Market Revenue Million Forecast, by Colocation Type 2019 & 2032
- Table 51: Global Data Center in Indonesia Market Revenue Million Forecast, by End User 2019 & 2032
- Table 52: Global Data Center in Indonesia Market Revenue Million Forecast, by Country 2019 & 2032
- Table 53: Turkey Data Center in Indonesia Market Revenue (Million) Forecast, by Application 2019 & 2032
- Table 54: Israel Data Center in Indonesia Market Revenue (Million) Forecast, by Application 2019 & 2032
- Table 55: GCC Data Center in Indonesia Market Revenue (Million) Forecast, by Application 2019 & 2032
- Table 56: North Africa Data Center in Indonesia Market Revenue (Million) Forecast, by Application 2019 & 2032
- Table 57: South Africa Data Center in Indonesia Market Revenue (Million) Forecast, by Application 2019 & 2032
- Table 58: Rest of Middle East & Africa Data Center in Indonesia Market Revenue (Million) Forecast, by Application 2019 & 2032
- Table 59: Global Data Center in Indonesia Market Revenue Million Forecast, by Hotspot 2019 & 2032
- Table 60: Global Data Center in Indonesia Market Revenue Million Forecast, by Data Center Size 2019 & 2032
- Table 61: Global Data Center in Indonesia Market Revenue Million Forecast, by Tier Type 2019 & 2032
- Table 62: Global Data Center in Indonesia Market Revenue Million Forecast, by Absorption 2019 & 2032
- Table 63: Global Data Center in Indonesia Market Revenue Million Forecast, by Colocation Type 2019 & 2032
- Table 64: Global Data Center in Indonesia Market Revenue Million Forecast, by End User 2019 & 2032
- Table 65: Global Data Center in Indonesia Market Revenue Million Forecast, by Country 2019 & 2032
- Table 66: China Data Center in Indonesia Market Revenue (Million) Forecast, by Application 2019 & 2032
- Table 67: India Data Center in Indonesia Market Revenue (Million) Forecast, by Application 2019 & 2032
- Table 68: Japan Data Center in Indonesia Market Revenue (Million) Forecast, by Application 2019 & 2032
- Table 69: South Korea Data Center in Indonesia Market Revenue (Million) Forecast, by Application 2019 & 2032
- Table 70: ASEAN Data Center in Indonesia Market Revenue (Million) Forecast, by Application 2019 & 2032
- Table 71: Oceania Data Center in Indonesia Market Revenue (Million) Forecast, by Application 2019 & 2032
- Table 72: Rest of Asia Pacific Data Center in Indonesia Market Revenue (Million) Forecast, by Application 2019 & 2032
Frequently Asked Questions
1. What is the projected Compound Annual Growth Rate (CAGR) of the Data Center in Indonesia Market?
The projected CAGR is approximately 21.06%.
2. Which companies are prominent players in the Data Center in Indonesia Market?
Key companies in the market include BDx Data Center Pte Ltd, PT Sigma Tata Sadaya, PT Supra Primatama Nusantara, PT CBN Nusantara, Princeton Digital Group, EdgeConneX Inc, PT Faasri Utama Sakti, Digital Edge (Singapore) Holdings Pte Ltd, PT DCI Indonesia Tbk, Space DC Pte Ltd5 4 LIST OF COMPANIES STUDIE, NTT Ltd, Nusantara Data Center.
3. What are the main segments of the Data Center in Indonesia Market?
The market segments include Hotspot, Data Center Size, Tier Type, Absorption, Colocation Type, End User.
4. Can you provide details about the market size?
The market size is estimated to be USD XX Million as of 2022.
5. What are some drivers contributing to market growth?
Rise of E-Commerce; Flourishing Startup Culture.
6. What are the notable trends driving market growth?
OTHER KEY INDUSTRY TRENDS COVERED IN THE REPORT.
7. Are there any restraints impacting market growth?
Slow Penetration Rate in Developing Countries.
8. Can you provide examples of recent developments in the market?
September 2022: The company commenced construction on a 23MW data center in Jakarta, Indonesia, marking the company’s third site in South East Asia as it capitalizes on the region’s rapid digital transformation in the wake of the global pandemic.The new facility will offer 3,430 cabinets and an IT load of 23MW and is designed to cater for the growing demand for high power density applications from cloud-driven hyperscale deployments, local and international network and financial service providers. It is expected to complete by Q4 2023.August 2022: PT Sigma Cipta Caraka (SCA), also known as telkomsigma, transfers its data centre business to PT Telkom Data Ekosistem (TDE), which is worth a total of IDR 2.01 trillion. The parent company PT Telkom Indonesia (Persero) Tbk (TLKM), claimed that this transfer of the data centre business line is related to the business restructuring program held by Telkom Group.June 2022: The company announced the launch of BDx Indonesia, following the completion of a USD 300 million joint venture agreement with PT Indosat Tbk (Indosat Ooredoo Hutchison or IOH) and PT Aplikanusa Lintasarta, Big Data Exchange (BDx).
9. What pricing options are available for accessing the report?
Pricing options include single-user, multi-user, and enterprise licenses priced at USD 3800, USD 4500, and USD 5800 respectively.
10. Is the market size provided in terms of value or volume?
The market size is provided in terms of value, measured in Million.
11. Are there any specific market keywords associated with the report?
Yes, the market keyword associated with the report is "Data Center in Indonesia Market," which aids in identifying and referencing the specific market segment covered.
12. How do I determine which pricing option suits my needs best?
The pricing options vary based on user requirements and access needs. Individual users may opt for single-user licenses, while businesses requiring broader access may choose multi-user or enterprise licenses for cost-effective access to the report.
13. Are there any additional resources or data provided in the Data Center in Indonesia Market report?
While the report offers comprehensive insights, it's advisable to review the specific contents or supplementary materials provided to ascertain if additional resources or data are available.
14. How can I stay updated on further developments or reports in the Data Center in Indonesia Market?
To stay informed about further developments, trends, and reports in the Data Center in Indonesia Market, consider subscribing to industry newsletters, following relevant companies and organizations, or regularly checking reputable industry news sources and publications.
Methodology
Step 1 - Identification of Relevant Samples Size from Population Database


Step 2 - Approaches for Defining Global Market Size (Value, Volume* & Price*)

Note*: In applicable scenarios
Step 3 - Data Sources
Primary Research
- Web Analytics
- Survey Reports
- Research Institute
- Latest Research Reports
- Opinion Leaders
Secondary Research
- Annual Reports
- White Paper
- Latest Press Release
- Industry Association
- Paid Database
- Investor Presentations

Step 4 - Data Triangulation
Involves using different sources of information in order to increase the validity of a study
These sources are likely to be stakeholders in a program - participants, other researchers, program staff, other community members, and so on.
Then we put all data in single framework & apply various statistical tools to find out the dynamic on the market.
During the analysis stage, feedback from the stakeholder groups would be compared to determine areas of agreement as well as areas of divergence


