
Key Insights
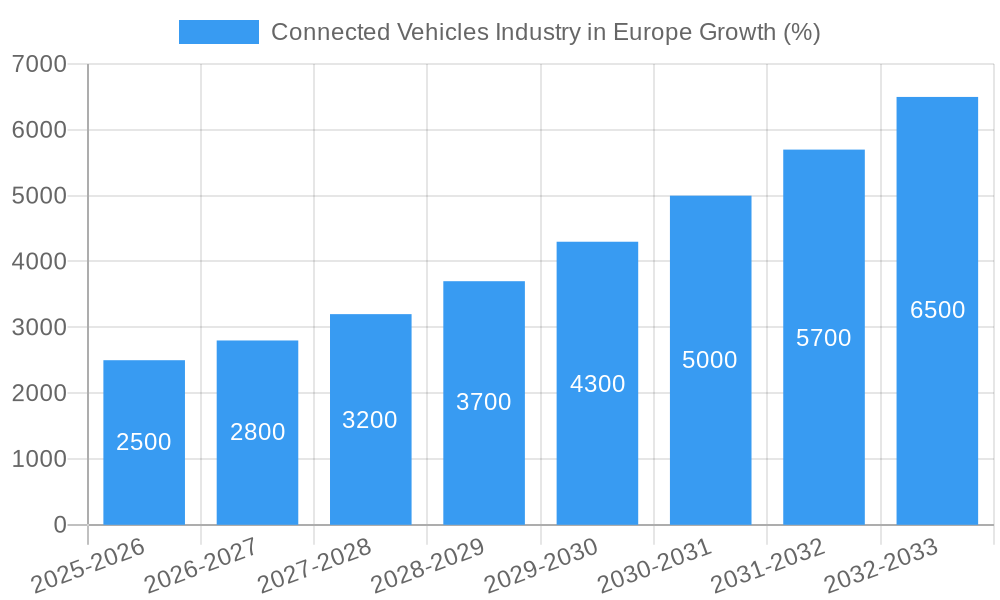
The European connected vehicles market is experiencing robust growth, driven by increasing vehicle production, rising consumer demand for advanced safety and infotainment features, and supportive government regulations promoting intelligent transportation systems. The market's Compound Annual Growth Rate (CAGR) of 16.90% from 2019 to 2024 indicates significant expansion, projected to continue into the forecast period (2025-2033). Key segments driving this growth include advanced driver-assistance systems (ADAS), integrated navigation and entertainment systems, and V2X (Vehicle-to-Everything) communication technologies. Germany, France, and the United Kingdom represent the largest national markets, fueled by high vehicle ownership rates and early adoption of connected car technologies. The aftermarket segment is poised for substantial growth as consumers upgrade their existing vehicles with aftermarket connectivity solutions. The prevalence of integrated connectivity solutions is also on the rise, reflecting a shift towards seamless integration of various functionalities within the vehicle. However, challenges such as data security concerns, high initial investment costs, and the need for robust infrastructure development could potentially restrain market growth.
Technological advancements, including 5G deployment and the development of more sophisticated AI-powered features, will further propel market expansion. Competition among established automotive manufacturers and technology providers like Denso, Delphi, Harman, and Bosch, is intensifying, leading to continuous innovation and price optimization. The increasing adoption of electric and autonomous vehicles will further stimulate demand for advanced connectivity features. The market segmentation, encompassing various end-user types, countries, technologies, connectivity types, and vehicle connectivity types, provides a granular view of the market dynamics, allowing for targeted investment strategies and product development. A detailed understanding of these factors is crucial for players aiming to capitalize on the growth opportunities within the European connected vehicles market.
Connected Vehicles Industry in Europe: A Comprehensive Market Report (2019-2033)
This in-depth report provides a comprehensive analysis of the Connected Vehicles industry in Europe, covering market size, segmentation, competitive landscape, and future growth prospects. The study period spans from 2019 to 2033, with 2025 as the base and estimated year. The report offers actionable insights for industry stakeholders, including OEMs, Tier-1 suppliers, technology providers, and investors. Expect detailed analysis of key trends, challenges, and opportunities shaping this rapidly evolving market.
Connected Vehicles Industry in Europe Market Structure & Competitive Dynamics
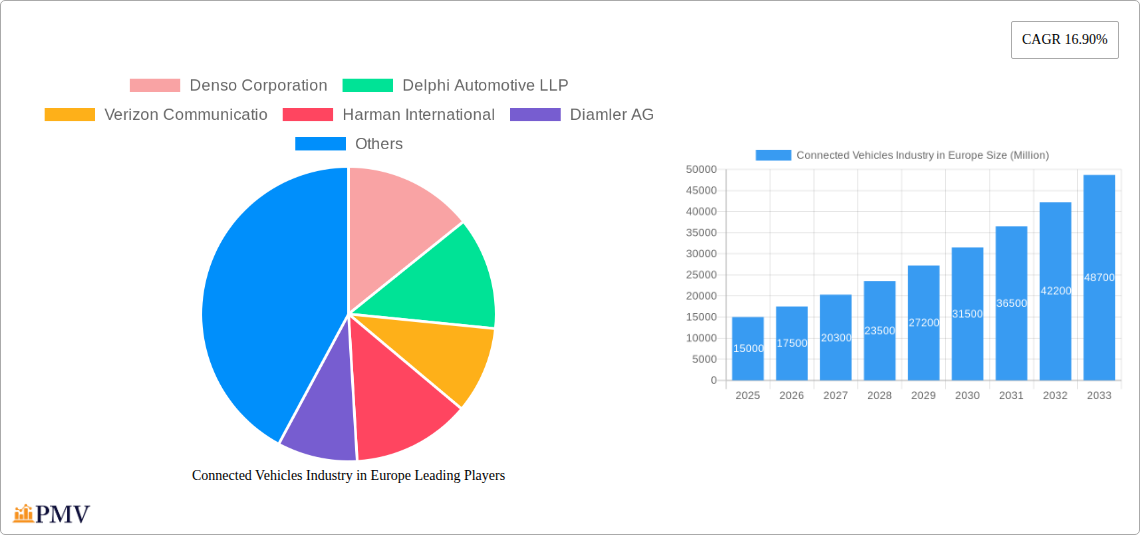
The European connected vehicles market exhibits a moderately concentrated structure, with several major players holding significant market share. Key players like Robert Bosch GmbH, Continental AG, Denso Corporation, Daimler AG, and BMW Group dominate various segments based on technology, connectivity, and vehicle type. The market is characterized by intense competition, fueled by continuous innovation in vehicle-to-everything (V2X) communication, advanced driver-assistance systems (ADAS), and infotainment systems.
The regulatory landscape is evolving rapidly, with the European Union implementing stringent safety and data privacy regulations impacting market dynamics. This pushes companies towards compliance and collaborative innovation. The high cost of implementing advanced connected vehicle technologies acts as a barrier to entry for smaller players. Mergers and acquisitions (M&A) are prevalent, reflecting strategic consolidation and technology acquisition. For example, the xx Million deal between xx and xx significantly altered market share in 2023. Total M&A deal value for the historical period (2019-2024) is estimated at xx Million, indicating significant consolidation activity. Key trends include increased partnerships between automotive manufacturers and technology companies to leverage expertise in software and data analytics.
- Market Concentration: Moderate, dominated by several key players.
- Innovation Ecosystems: Active collaborations between automotive companies and technology firms.
- Regulatory Framework: Stringent regulations drive innovation and compliance.
- M&A Activities: Significant activity with a total deal value of approximately xx Million between 2019 and 2024.
- End-User Trends: Growing demand for enhanced safety, infotainment, and autonomous driving features.
Connected Vehicles Industry in Europe Industry Trends & Insights
The European connected vehicles market is experiencing robust growth, driven by factors such as increasing vehicle production, rising consumer demand for advanced features, and supportive government initiatives promoting intelligent transportation systems. The market's Compound Annual Growth Rate (CAGR) during the forecast period (2025-2033) is projected to be xx%, reaching a market value of xx Million by 2033. Technological advancements, particularly in 5G connectivity and artificial intelligence (AI), are significantly impacting market dynamics. The penetration rate of connected vehicles is steadily increasing, driven by the affordability of connected features and consumer inclination towards technology-integrated vehicles.
Consumer preferences are shifting towards vehicles offering seamless connectivity, personalized experiences, and advanced safety features. The competitive landscape remains highly dynamic, characterized by strategic partnerships, technological collaborations, and continuous product innovation. Key automotive OEMs are investing heavily in developing their own connected car platforms and services, while Tier-1 suppliers are focusing on providing innovative components and solutions. The market is also witnessing the emergence of new players offering specialized solutions and services, further intensifying competition.
Dominant Markets & Segments in Connected Vehicles Industry in Europe
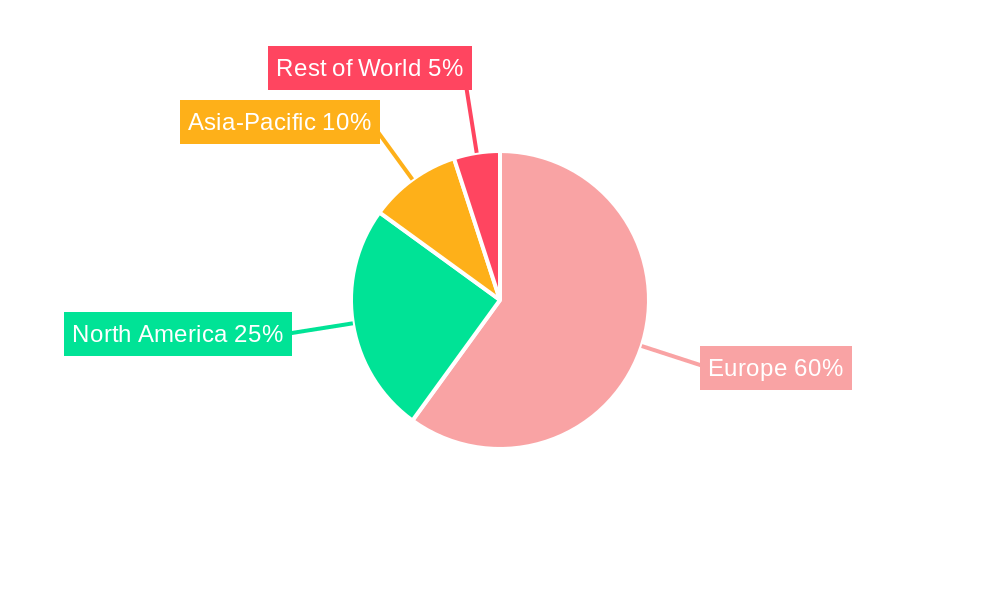
Germany holds the leading position in the European connected vehicles market, driven by strong automotive manufacturing presence, well-developed infrastructure, and supportive government policies. The UK and France follow, presenting significant opportunities for market expansion.
By End-User Type: The OEM segment dominates, accounting for xx% of the market in 2025, owing to high vehicle production and integration of connected features in new models. The aftermarket segment is experiencing moderate growth, propelled by rising demand for aftermarket upgrades and retrofitting solutions.
By Country: Germany, with its strong automotive industry, leads, followed by the UK and France. The Rest of Europe exhibits considerable growth potential. Key drivers include robust economies, expanding infrastructure, and supportive government regulations.
By Technology Type: Safety technologies, including ADAS and autonomous driving features, hold the largest market share, driven by stringent safety regulations and growing consumer demand. Navigation systems also contribute significantly, driven by growing demand for real-time traffic updates and route optimization. The entertainment segment exhibits solid growth due to increasing demand for in-car entertainment and infotainment systems.
By Connectivity Type: Integrated connectivity solutions dominate, reflecting OEM preference for factory-fitted systems. Embedded and tethered connectivity are also gaining traction.
By Vehicle Connectivity Type: V2X communication, enabling vehicles to communicate with each other and infrastructure, is gaining significant traction, driven by technological advancements and increased safety regulations. V2Vehicle and V2Infrastructure remain essential segments.
Connected Vehicles Industry in Europe Product Innovations
Recent innovations include advanced driver-assistance systems (ADAS) like lane keeping assist, adaptive cruise control, and automatic emergency braking, all enhancing vehicle safety. Infotainment systems are becoming increasingly sophisticated, integrating features like voice control, augmented reality navigation, and over-the-air (OTA) software updates. The emergence of V2X communication technologies is a key development, enabling improved traffic management and enhanced safety. These innovations are gaining traction due to their ability to improve driver experience and safety, in alignment with market demand for technology integration and intelligent transportation systems.
Report Segmentation & Scope
This report segments the European connected vehicles market by end-user type (OEM, Aftermarket), country (Germany, France, UK, Rest of Europe), technology type (Navigation, Entertainment, Safety, Vehicle Management, Other), connectivity type (Integrated, Embedded, Tethered), and vehicle connectivity type (V2Vehicle, V2Infrastructure, V2X). Each segment is analyzed in detail, providing market size, growth projections, and competitive dynamics. Market size for each segment is detailed within the full report, projecting steady growth across all areas. Competitive dynamics vary considerably by segment with some showing high consolidation and others exhibiting more fragmented competition.
Key Drivers of Connected Vehicles Industry in Europe Growth
Several factors fuel the growth of the European connected vehicles market. Technological advancements, particularly in 5G, AI, and V2X communication, are significantly driving innovation. Government policies incentivizing the adoption of connected and autonomous vehicles further enhance growth. The growing demand for enhanced safety features and improved driver experience among consumers significantly contributes to market expansion. Investment in smart city infrastructure further supports the development of connected vehicles technology.
Challenges in the Connected Vehicles Industry in Europe Sector
The connected vehicles industry faces challenges such as the high cost of implementation, cybersecurity concerns, and data privacy regulations. Supply chain disruptions and the shortage of semiconductor chips impact production timelines and overall market growth. The lack of standardized communication protocols across different systems further complicates integration. Addressing these challenges requires collaboration between stakeholders across the industry. It is estimated that supply chain issues alone caused a xx Million reduction in market value in 2022.
Leading Players in the Connected Vehicles Industry in Europe Market
- Denso Corporation
- Delphi Automotive LLP
- Verizon Communications
- Harman International
- Daimler AG
- Continental AG
- Autoliv Inc
- Robert Bosch GmbH
- BMW Group
- Audi AG
Key Developments in Connected Vehicles Industry in Europe Sector
May 2022: Volkswagen Group and SEAT SA announced a EUR 10 Billion investment in electrifying Europe, including battery plant construction and collaborations with 62 companies. This significantly boosts the connected vehicles market, as electrification and connectivity are intertwined.
February 2021: Robert Bosch partnered with Microsoft to develop a vehicle development platform, streamlining connected vehicle component production by integrating Bosch's technology with Microsoft's cloud services. This collaboration accelerates innovation and product development.
February 2021: Harman acquired Savari Inc. to develop V2X communication technology using 5G, strengthening its position in the connected car market. This acquisition signifies the growing importance of V2X technology.
Strategic Connected Vehicles Industry in Europe Market Outlook
The European connected vehicles market exhibits significant future growth potential, driven by technological advancements, supportive government policies, and increasing consumer demand. Strategic opportunities lie in developing innovative solutions addressing cybersecurity, data privacy, and seamless integration across different systems. Companies focusing on V2X technologies, advanced driver-assistance systems, and personalized in-car experiences are poised to capitalize on the expanding market. Further growth will depend on addressing the current challenges and fostering collaboration across the industry value chain.
Connected Vehicles Industry in Europe Segmentation
-
1. Technology Type
- 1.1. Navigation
- 1.2. Entertainment
- 1.3. Safety
- 1.4. Vehicle Management
- 1.5. Other Technology Types
-
2. Connectivity Type
- 2.1. Integrated
- 2.2. Embedded
- 2.3. Tethered
-
3. Vehicle Connectivity Type
- 3.1. V2Vehicle
- 3.2. V2Infrastructure
- 3.3. V2X
-
4. End-User Type
- 4.1. OEM
- 4.2. Aftermarket
Connected Vehicles Industry in Europe Segmentation By Geography
-
1. North America
- 1.1. United States
- 1.2. Canada
- 1.3. Mexico
-
2. South America
- 2.1. Brazil
- 2.2. Argentina
- 2.3. Rest of South America
-
3. Europe
- 3.1. United Kingdom
- 3.2. Germany
- 3.3. France
- 3.4. Italy
- 3.5. Spain
- 3.6. Russia
- 3.7. Benelux
- 3.8. Nordics
- 3.9. Rest of Europe
-
4. Middle East & Africa
- 4.1. Turkey
- 4.2. Israel
- 4.3. GCC
- 4.4. North Africa
- 4.5. South Africa
- 4.6. Rest of Middle East & Africa
-
5. Asia Pacific
- 5.1. China
- 5.2. India
- 5.3. Japan
- 5.4. South Korea
- 5.5. ASEAN
- 5.6. Oceania
- 5.7. Rest of Asia Pacific
Connected Vehicles Industry in Europe REPORT HIGHLIGHTS
| Aspects | Details |
|---|---|
| Study Period | 2019-2033 |
| Base Year | 2024 |
| Estimated Year | 2025 |
| Forecast Period | 2025-2033 |
| Historical Period | 2019-2024 |
| Growth Rate | CAGR of 16.90% from 2019-2033 |
| Segmentation |
|
Table of Contents
- 1. Introduction
- 1.1. Research Scope
- 1.2. Market Segmentation
- 1.3. Research Methodology
- 1.4. Definitions and Assumptions
- 2. Executive Summary
- 2.1. Introduction
- 3. Market Dynamics
- 3.1. Introduction
- 3.2. Market Drivers
- 3.2.1. Integration With Telematics And Fleet Management Systems; Others
- 3.3. Market Restrains
- 3.3.1. The Initial Costs Associated With Purchasing And Installing ELD Systems is High; Others
- 3.4. Market Trends
- 3.4.1. Introduction of 5G Network and Increased Use of IoT Applications
- 4. Market Factor Analysis
- 4.1. Porters Five Forces
- 4.2. Supply/Value Chain
- 4.3. PESTEL analysis
- 4.4. Market Entropy
- 4.5. Patent/Trademark Analysis
- 5. Global Connected Vehicles Industry in Europe Analysis, Insights and Forecast, 2019-2031
- 5.1. Market Analysis, Insights and Forecast - by Technology Type
- 5.1.1. Navigation
- 5.1.2. Entertainment
- 5.1.3. Safety
- 5.1.4. Vehicle Management
- 5.1.5. Other Technology Types
- 5.2. Market Analysis, Insights and Forecast - by Connectivity Type
- 5.2.1. Integrated
- 5.2.2. Embedded
- 5.2.3. Tethered
- 5.3. Market Analysis, Insights and Forecast - by Vehicle Connectivity Type
- 5.3.1. V2Vehicle
- 5.3.2. V2Infrastructure
- 5.3.3. V2X
- 5.4. Market Analysis, Insights and Forecast - by End-User Type
- 5.4.1. OEM
- 5.4.2. Aftermarket
- 5.5. Market Analysis, Insights and Forecast - by Region
- 5.5.1. North America
- 5.5.2. South America
- 5.5.3. Europe
- 5.5.4. Middle East & Africa
- 5.5.5. Asia Pacific
- 5.1. Market Analysis, Insights and Forecast - by Technology Type
- 6. North America Connected Vehicles Industry in Europe Analysis, Insights and Forecast, 2019-2031
- 6.1. Market Analysis, Insights and Forecast - by Technology Type
- 6.1.1. Navigation
- 6.1.2. Entertainment
- 6.1.3. Safety
- 6.1.4. Vehicle Management
- 6.1.5. Other Technology Types
- 6.2. Market Analysis, Insights and Forecast - by Connectivity Type
- 6.2.1. Integrated
- 6.2.2. Embedded
- 6.2.3. Tethered
- 6.3. Market Analysis, Insights and Forecast - by Vehicle Connectivity Type
- 6.3.1. V2Vehicle
- 6.3.2. V2Infrastructure
- 6.3.3. V2X
- 6.4. Market Analysis, Insights and Forecast - by End-User Type
- 6.4.1. OEM
- 6.4.2. Aftermarket
- 6.1. Market Analysis, Insights and Forecast - by Technology Type
- 7. South America Connected Vehicles Industry in Europe Analysis, Insights and Forecast, 2019-2031
- 7.1. Market Analysis, Insights and Forecast - by Technology Type
- 7.1.1. Navigation
- 7.1.2. Entertainment
- 7.1.3. Safety
- 7.1.4. Vehicle Management
- 7.1.5. Other Technology Types
- 7.2. Market Analysis, Insights and Forecast - by Connectivity Type
- 7.2.1. Integrated
- 7.2.2. Embedded
- 7.2.3. Tethered
- 7.3. Market Analysis, Insights and Forecast - by Vehicle Connectivity Type
- 7.3.1. V2Vehicle
- 7.3.2. V2Infrastructure
- 7.3.3. V2X
- 7.4. Market Analysis, Insights and Forecast - by End-User Type
- 7.4.1. OEM
- 7.4.2. Aftermarket
- 7.1. Market Analysis, Insights and Forecast - by Technology Type
- 8. Europe Connected Vehicles Industry in Europe Analysis, Insights and Forecast, 2019-2031
- 8.1. Market Analysis, Insights and Forecast - by Technology Type
- 8.1.1. Navigation
- 8.1.2. Entertainment
- 8.1.3. Safety
- 8.1.4. Vehicle Management
- 8.1.5. Other Technology Types
- 8.2. Market Analysis, Insights and Forecast - by Connectivity Type
- 8.2.1. Integrated
- 8.2.2. Embedded
- 8.2.3. Tethered
- 8.3. Market Analysis, Insights and Forecast - by Vehicle Connectivity Type
- 8.3.1. V2Vehicle
- 8.3.2. V2Infrastructure
- 8.3.3. V2X
- 8.4. Market Analysis, Insights and Forecast - by End-User Type
- 8.4.1. OEM
- 8.4.2. Aftermarket
- 8.1. Market Analysis, Insights and Forecast - by Technology Type
- 9. Middle East & Africa Connected Vehicles Industry in Europe Analysis, Insights and Forecast, 2019-2031
- 9.1. Market Analysis, Insights and Forecast - by Technology Type
- 9.1.1. Navigation
- 9.1.2. Entertainment
- 9.1.3. Safety
- 9.1.4. Vehicle Management
- 9.1.5. Other Technology Types
- 9.2. Market Analysis, Insights and Forecast - by Connectivity Type
- 9.2.1. Integrated
- 9.2.2. Embedded
- 9.2.3. Tethered
- 9.3. Market Analysis, Insights and Forecast - by Vehicle Connectivity Type
- 9.3.1. V2Vehicle
- 9.3.2. V2Infrastructure
- 9.3.3. V2X
- 9.4. Market Analysis, Insights and Forecast - by End-User Type
- 9.4.1. OEM
- 9.4.2. Aftermarket
- 9.1. Market Analysis, Insights and Forecast - by Technology Type
- 10. Asia Pacific Connected Vehicles Industry in Europe Analysis, Insights and Forecast, 2019-2031
- 10.1. Market Analysis, Insights and Forecast - by Technology Type
- 10.1.1. Navigation
- 10.1.2. Entertainment
- 10.1.3. Safety
- 10.1.4. Vehicle Management
- 10.1.5. Other Technology Types
- 10.2. Market Analysis, Insights and Forecast - by Connectivity Type
- 10.2.1. Integrated
- 10.2.2. Embedded
- 10.2.3. Tethered
- 10.3. Market Analysis, Insights and Forecast - by Vehicle Connectivity Type
- 10.3.1. V2Vehicle
- 10.3.2. V2Infrastructure
- 10.3.3. V2X
- 10.4. Market Analysis, Insights and Forecast - by End-User Type
- 10.4.1. OEM
- 10.4.2. Aftermarket
- 10.1. Market Analysis, Insights and Forecast - by Technology Type
- 11. Germany Connected Vehicles Industry in Europe Analysis, Insights and Forecast, 2019-2031
- 12. France Connected Vehicles Industry in Europe Analysis, Insights and Forecast, 2019-2031
- 13. Italy Connected Vehicles Industry in Europe Analysis, Insights and Forecast, 2019-2031
- 14. United Kingdom Connected Vehicles Industry in Europe Analysis, Insights and Forecast, 2019-2031
- 15. Netherlands Connected Vehicles Industry in Europe Analysis, Insights and Forecast, 2019-2031
- 16. Sweden Connected Vehicles Industry in Europe Analysis, Insights and Forecast, 2019-2031
- 17. Rest of Europe Connected Vehicles Industry in Europe Analysis, Insights and Forecast, 2019-2031
- 18. Competitive Analysis
- 18.1. Global Market Share Analysis 2024
- 18.2. Company Profiles
- 18.2.1 Denso Corporation
- 18.2.1.1. Overview
- 18.2.1.2. Products
- 18.2.1.3. SWOT Analysis
- 18.2.1.4. Recent Developments
- 18.2.1.5. Financials (Based on Availability)
- 18.2.2 Delphi Automotive LLP
- 18.2.2.1. Overview
- 18.2.2.2. Products
- 18.2.2.3. SWOT Analysis
- 18.2.2.4. Recent Developments
- 18.2.2.5. Financials (Based on Availability)
- 18.2.3 Verizon Communicatio
- 18.2.3.1. Overview
- 18.2.3.2. Products
- 18.2.3.3. SWOT Analysis
- 18.2.3.4. Recent Developments
- 18.2.3.5. Financials (Based on Availability)
- 18.2.4 Harman International
- 18.2.4.1. Overview
- 18.2.4.2. Products
- 18.2.4.3. SWOT Analysis
- 18.2.4.4. Recent Developments
- 18.2.4.5. Financials (Based on Availability)
- 18.2.5 Diamler AG
- 18.2.5.1. Overview
- 18.2.5.2. Products
- 18.2.5.3. SWOT Analysis
- 18.2.5.4. Recent Developments
- 18.2.5.5. Financials (Based on Availability)
- 18.2.6 Continental AG
- 18.2.6.1. Overview
- 18.2.6.2. Products
- 18.2.6.3. SWOT Analysis
- 18.2.6.4. Recent Developments
- 18.2.6.5. Financials (Based on Availability)
- 18.2.7 Autoliv Inc
- 18.2.7.1. Overview
- 18.2.7.2. Products
- 18.2.7.3. SWOT Analysis
- 18.2.7.4. Recent Developments
- 18.2.7.5. Financials (Based on Availability)
- 18.2.8 Robert Bosch GmbH
- 18.2.8.1. Overview
- 18.2.8.2. Products
- 18.2.8.3. SWOT Analysis
- 18.2.8.4. Recent Developments
- 18.2.8.5. Financials (Based on Availability)
- 18.2.9 BMW Group
- 18.2.9.1. Overview
- 18.2.9.2. Products
- 18.2.9.3. SWOT Analysis
- 18.2.9.4. Recent Developments
- 18.2.9.5. Financials (Based on Availability)
- 18.2.10 Audi AG
- 18.2.10.1. Overview
- 18.2.10.2. Products
- 18.2.10.3. SWOT Analysis
- 18.2.10.4. Recent Developments
- 18.2.10.5. Financials (Based on Availability)
- 18.2.1 Denso Corporation
List of Figures
- Figure 1: Global Connected Vehicles Industry in Europe Revenue Breakdown (Million, %) by Region 2024 & 2032
- Figure 2: Europe Connected Vehicles Industry in Europe Revenue (Million), by Country 2024 & 2032
- Figure 3: Europe Connected Vehicles Industry in Europe Revenue Share (%), by Country 2024 & 2032
- Figure 4: North America Connected Vehicles Industry in Europe Revenue (Million), by Technology Type 2024 & 2032
- Figure 5: North America Connected Vehicles Industry in Europe Revenue Share (%), by Technology Type 2024 & 2032
- Figure 6: North America Connected Vehicles Industry in Europe Revenue (Million), by Connectivity Type 2024 & 2032
- Figure 7: North America Connected Vehicles Industry in Europe Revenue Share (%), by Connectivity Type 2024 & 2032
- Figure 8: North America Connected Vehicles Industry in Europe Revenue (Million), by Vehicle Connectivity Type 2024 & 2032
- Figure 9: North America Connected Vehicles Industry in Europe Revenue Share (%), by Vehicle Connectivity Type 2024 & 2032
- Figure 10: North America Connected Vehicles Industry in Europe Revenue (Million), by End-User Type 2024 & 2032
- Figure 11: North America Connected Vehicles Industry in Europe Revenue Share (%), by End-User Type 2024 & 2032
- Figure 12: North America Connected Vehicles Industry in Europe Revenue (Million), by Country 2024 & 2032
- Figure 13: North America Connected Vehicles Industry in Europe Revenue Share (%), by Country 2024 & 2032
- Figure 14: South America Connected Vehicles Industry in Europe Revenue (Million), by Technology Type 2024 & 2032
- Figure 15: South America Connected Vehicles Industry in Europe Revenue Share (%), by Technology Type 2024 & 2032
- Figure 16: South America Connected Vehicles Industry in Europe Revenue (Million), by Connectivity Type 2024 & 2032
- Figure 17: South America Connected Vehicles Industry in Europe Revenue Share (%), by Connectivity Type 2024 & 2032
- Figure 18: South America Connected Vehicles Industry in Europe Revenue (Million), by Vehicle Connectivity Type 2024 & 2032
- Figure 19: South America Connected Vehicles Industry in Europe Revenue Share (%), by Vehicle Connectivity Type 2024 & 2032
- Figure 20: South America Connected Vehicles Industry in Europe Revenue (Million), by End-User Type 2024 & 2032
- Figure 21: South America Connected Vehicles Industry in Europe Revenue Share (%), by End-User Type 2024 & 2032
- Figure 22: South America Connected Vehicles Industry in Europe Revenue (Million), by Country 2024 & 2032
- Figure 23: South America Connected Vehicles Industry in Europe Revenue Share (%), by Country 2024 & 2032
- Figure 24: Europe Connected Vehicles Industry in Europe Revenue (Million), by Technology Type 2024 & 2032
- Figure 25: Europe Connected Vehicles Industry in Europe Revenue Share (%), by Technology Type 2024 & 2032
- Figure 26: Europe Connected Vehicles Industry in Europe Revenue (Million), by Connectivity Type 2024 & 2032
- Figure 27: Europe Connected Vehicles Industry in Europe Revenue Share (%), by Connectivity Type 2024 & 2032
- Figure 28: Europe Connected Vehicles Industry in Europe Revenue (Million), by Vehicle Connectivity Type 2024 & 2032
- Figure 29: Europe Connected Vehicles Industry in Europe Revenue Share (%), by Vehicle Connectivity Type 2024 & 2032
- Figure 30: Europe Connected Vehicles Industry in Europe Revenue (Million), by End-User Type 2024 & 2032
- Figure 31: Europe Connected Vehicles Industry in Europe Revenue Share (%), by End-User Type 2024 & 2032
- Figure 32: Europe Connected Vehicles Industry in Europe Revenue (Million), by Country 2024 & 2032
- Figure 33: Europe Connected Vehicles Industry in Europe Revenue Share (%), by Country 2024 & 2032
- Figure 34: Middle East & Africa Connected Vehicles Industry in Europe Revenue (Million), by Technology Type 2024 & 2032
- Figure 35: Middle East & Africa Connected Vehicles Industry in Europe Revenue Share (%), by Technology Type 2024 & 2032
- Figure 36: Middle East & Africa Connected Vehicles Industry in Europe Revenue (Million), by Connectivity Type 2024 & 2032
- Figure 37: Middle East & Africa Connected Vehicles Industry in Europe Revenue Share (%), by Connectivity Type 2024 & 2032
- Figure 38: Middle East & Africa Connected Vehicles Industry in Europe Revenue (Million), by Vehicle Connectivity Type 2024 & 2032
- Figure 39: Middle East & Africa Connected Vehicles Industry in Europe Revenue Share (%), by Vehicle Connectivity Type 2024 & 2032
- Figure 40: Middle East & Africa Connected Vehicles Industry in Europe Revenue (Million), by End-User Type 2024 & 2032
- Figure 41: Middle East & Africa Connected Vehicles Industry in Europe Revenue Share (%), by End-User Type 2024 & 2032
- Figure 42: Middle East & Africa Connected Vehicles Industry in Europe Revenue (Million), by Country 2024 & 2032
- Figure 43: Middle East & Africa Connected Vehicles Industry in Europe Revenue Share (%), by Country 2024 & 2032
- Figure 44: Asia Pacific Connected Vehicles Industry in Europe Revenue (Million), by Technology Type 2024 & 2032
- Figure 45: Asia Pacific Connected Vehicles Industry in Europe Revenue Share (%), by Technology Type 2024 & 2032
- Figure 46: Asia Pacific Connected Vehicles Industry in Europe Revenue (Million), by Connectivity Type 2024 & 2032
- Figure 47: Asia Pacific Connected Vehicles Industry in Europe Revenue Share (%), by Connectivity Type 2024 & 2032
- Figure 48: Asia Pacific Connected Vehicles Industry in Europe Revenue (Million), by Vehicle Connectivity Type 2024 & 2032
- Figure 49: Asia Pacific Connected Vehicles Industry in Europe Revenue Share (%), by Vehicle Connectivity Type 2024 & 2032
- Figure 50: Asia Pacific Connected Vehicles Industry in Europe Revenue (Million), by End-User Type 2024 & 2032
- Figure 51: Asia Pacific Connected Vehicles Industry in Europe Revenue Share (%), by End-User Type 2024 & 2032
- Figure 52: Asia Pacific Connected Vehicles Industry in Europe Revenue (Million), by Country 2024 & 2032
- Figure 53: Asia Pacific Connected Vehicles Industry in Europe Revenue Share (%), by Country 2024 & 2032
List of Tables
- Table 1: Global Connected Vehicles Industry in Europe Revenue Million Forecast, by Region 2019 & 2032
- Table 2: Global Connected Vehicles Industry in Europe Revenue Million Forecast, by Technology Type 2019 & 2032
- Table 3: Global Connected Vehicles Industry in Europe Revenue Million Forecast, by Connectivity Type 2019 & 2032
- Table 4: Global Connected Vehicles Industry in Europe Revenue Million Forecast, by Vehicle Connectivity Type 2019 & 2032
- Table 5: Global Connected Vehicles Industry in Europe Revenue Million Forecast, by End-User Type 2019 & 2032
- Table 6: Global Connected Vehicles Industry in Europe Revenue Million Forecast, by Region 2019 & 2032
- Table 7: Global Connected Vehicles Industry in Europe Revenue Million Forecast, by Country 2019 & 2032
- Table 8: Germany Connected Vehicles Industry in Europe Revenue (Million) Forecast, by Application 2019 & 2032
- Table 9: France Connected Vehicles Industry in Europe Revenue (Million) Forecast, by Application 2019 & 2032
- Table 10: Italy Connected Vehicles Industry in Europe Revenue (Million) Forecast, by Application 2019 & 2032
- Table 11: United Kingdom Connected Vehicles Industry in Europe Revenue (Million) Forecast, by Application 2019 & 2032
- Table 12: Netherlands Connected Vehicles Industry in Europe Revenue (Million) Forecast, by Application 2019 & 2032
- Table 13: Sweden Connected Vehicles Industry in Europe Revenue (Million) Forecast, by Application 2019 & 2032
- Table 14: Rest of Europe Connected Vehicles Industry in Europe Revenue (Million) Forecast, by Application 2019 & 2032
- Table 15: Global Connected Vehicles Industry in Europe Revenue Million Forecast, by Technology Type 2019 & 2032
- Table 16: Global Connected Vehicles Industry in Europe Revenue Million Forecast, by Connectivity Type 2019 & 2032
- Table 17: Global Connected Vehicles Industry in Europe Revenue Million Forecast, by Vehicle Connectivity Type 2019 & 2032
- Table 18: Global Connected Vehicles Industry in Europe Revenue Million Forecast, by End-User Type 2019 & 2032
- Table 19: Global Connected Vehicles Industry in Europe Revenue Million Forecast, by Country 2019 & 2032
- Table 20: United States Connected Vehicles Industry in Europe Revenue (Million) Forecast, by Application 2019 & 2032
- Table 21: Canada Connected Vehicles Industry in Europe Revenue (Million) Forecast, by Application 2019 & 2032
- Table 22: Mexico Connected Vehicles Industry in Europe Revenue (Million) Forecast, by Application 2019 & 2032
- Table 23: Global Connected Vehicles Industry in Europe Revenue Million Forecast, by Technology Type 2019 & 2032
- Table 24: Global Connected Vehicles Industry in Europe Revenue Million Forecast, by Connectivity Type 2019 & 2032
- Table 25: Global Connected Vehicles Industry in Europe Revenue Million Forecast, by Vehicle Connectivity Type 2019 & 2032
- Table 26: Global Connected Vehicles Industry in Europe Revenue Million Forecast, by End-User Type 2019 & 2032
- Table 27: Global Connected Vehicles Industry in Europe Revenue Million Forecast, by Country 2019 & 2032
- Table 28: Brazil Connected Vehicles Industry in Europe Revenue (Million) Forecast, by Application 2019 & 2032
- Table 29: Argentina Connected Vehicles Industry in Europe Revenue (Million) Forecast, by Application 2019 & 2032
- Table 30: Rest of South America Connected Vehicles Industry in Europe Revenue (Million) Forecast, by Application 2019 & 2032
- Table 31: Global Connected Vehicles Industry in Europe Revenue Million Forecast, by Technology Type 2019 & 2032
- Table 32: Global Connected Vehicles Industry in Europe Revenue Million Forecast, by Connectivity Type 2019 & 2032
- Table 33: Global Connected Vehicles Industry in Europe Revenue Million Forecast, by Vehicle Connectivity Type 2019 & 2032
- Table 34: Global Connected Vehicles Industry in Europe Revenue Million Forecast, by End-User Type 2019 & 2032
- Table 35: Global Connected Vehicles Industry in Europe Revenue Million Forecast, by Country 2019 & 2032
- Table 36: United Kingdom Connected Vehicles Industry in Europe Revenue (Million) Forecast, by Application 2019 & 2032
- Table 37: Germany Connected Vehicles Industry in Europe Revenue (Million) Forecast, by Application 2019 & 2032
- Table 38: France Connected Vehicles Industry in Europe Revenue (Million) Forecast, by Application 2019 & 2032
- Table 39: Italy Connected Vehicles Industry in Europe Revenue (Million) Forecast, by Application 2019 & 2032
- Table 40: Spain Connected Vehicles Industry in Europe Revenue (Million) Forecast, by Application 2019 & 2032
- Table 41: Russia Connected Vehicles Industry in Europe Revenue (Million) Forecast, by Application 2019 & 2032
- Table 42: Benelux Connected Vehicles Industry in Europe Revenue (Million) Forecast, by Application 2019 & 2032
- Table 43: Nordics Connected Vehicles Industry in Europe Revenue (Million) Forecast, by Application 2019 & 2032
- Table 44: Rest of Europe Connected Vehicles Industry in Europe Revenue (Million) Forecast, by Application 2019 & 2032
- Table 45: Global Connected Vehicles Industry in Europe Revenue Million Forecast, by Technology Type 2019 & 2032
- Table 46: Global Connected Vehicles Industry in Europe Revenue Million Forecast, by Connectivity Type 2019 & 2032
- Table 47: Global Connected Vehicles Industry in Europe Revenue Million Forecast, by Vehicle Connectivity Type 2019 & 2032
- Table 48: Global Connected Vehicles Industry in Europe Revenue Million Forecast, by End-User Type 2019 & 2032
- Table 49: Global Connected Vehicles Industry in Europe Revenue Million Forecast, by Country 2019 & 2032
- Table 50: Turkey Connected Vehicles Industry in Europe Revenue (Million) Forecast, by Application 2019 & 2032
- Table 51: Israel Connected Vehicles Industry in Europe Revenue (Million) Forecast, by Application 2019 & 2032
- Table 52: GCC Connected Vehicles Industry in Europe Revenue (Million) Forecast, by Application 2019 & 2032
- Table 53: North Africa Connected Vehicles Industry in Europe Revenue (Million) Forecast, by Application 2019 & 2032
- Table 54: South Africa Connected Vehicles Industry in Europe Revenue (Million) Forecast, by Application 2019 & 2032
- Table 55: Rest of Middle East & Africa Connected Vehicles Industry in Europe Revenue (Million) Forecast, by Application 2019 & 2032
- Table 56: Global Connected Vehicles Industry in Europe Revenue Million Forecast, by Technology Type 2019 & 2032
- Table 57: Global Connected Vehicles Industry in Europe Revenue Million Forecast, by Connectivity Type 2019 & 2032
- Table 58: Global Connected Vehicles Industry in Europe Revenue Million Forecast, by Vehicle Connectivity Type 2019 & 2032
- Table 59: Global Connected Vehicles Industry in Europe Revenue Million Forecast, by End-User Type 2019 & 2032
- Table 60: Global Connected Vehicles Industry in Europe Revenue Million Forecast, by Country 2019 & 2032
- Table 61: China Connected Vehicles Industry in Europe Revenue (Million) Forecast, by Application 2019 & 2032
- Table 62: India Connected Vehicles Industry in Europe Revenue (Million) Forecast, by Application 2019 & 2032
- Table 63: Japan Connected Vehicles Industry in Europe Revenue (Million) Forecast, by Application 2019 & 2032
- Table 64: South Korea Connected Vehicles Industry in Europe Revenue (Million) Forecast, by Application 2019 & 2032
- Table 65: ASEAN Connected Vehicles Industry in Europe Revenue (Million) Forecast, by Application 2019 & 2032
- Table 66: Oceania Connected Vehicles Industry in Europe Revenue (Million) Forecast, by Application 2019 & 2032
- Table 67: Rest of Asia Pacific Connected Vehicles Industry in Europe Revenue (Million) Forecast, by Application 2019 & 2032
Frequently Asked Questions
1. What is the projected Compound Annual Growth Rate (CAGR) of the Connected Vehicles Industry in Europe?
The projected CAGR is approximately 16.90%.
2. Which companies are prominent players in the Connected Vehicles Industry in Europe?
Key companies in the market include Denso Corporation, Delphi Automotive LLP, Verizon Communicatio, Harman International, Diamler AG, Continental AG, Autoliv Inc, Robert Bosch GmbH, BMW Group, Audi AG.
3. What are the main segments of the Connected Vehicles Industry in Europe?
The market segments include Technology Type, Connectivity Type, Vehicle Connectivity Type, End-User Type.
4. Can you provide details about the market size?
The market size is estimated to be USD XX Million as of 2022.
5. What are some drivers contributing to market growth?
Integration With Telematics And Fleet Management Systems; Others.
6. What are the notable trends driving market growth?
Introduction of 5G Network and Increased Use of IoT Applications.
7. Are there any restraints impacting market growth?
The Initial Costs Associated With Purchasing And Installing ELD Systems is High; Others.
8. Can you provide examples of recent developments in the market?
In May 2022, Volkswagen Group and SEAT SA announced their strategic vision to mobilize EUR 10 billion for electrifying Europe. Under this plan, companies will construct battery plants to fast forward goals with the 62 national and international companies, benchmark firms, and Transformation programs for electric and connected vehicles.
9. What pricing options are available for accessing the report?
Pricing options include single-user, multi-user, and enterprise licenses priced at USD 4750, USD 4950, and USD 6800 respectively.
10. Is the market size provided in terms of value or volume?
The market size is provided in terms of value, measured in Million.
11. Are there any specific market keywords associated with the report?
Yes, the market keyword associated with the report is "Connected Vehicles Industry in Europe," which aids in identifying and referencing the specific market segment covered.
12. How do I determine which pricing option suits my needs best?
The pricing options vary based on user requirements and access needs. Individual users may opt for single-user licenses, while businesses requiring broader access may choose multi-user or enterprise licenses for cost-effective access to the report.
13. Are there any additional resources or data provided in the Connected Vehicles Industry in Europe report?
While the report offers comprehensive insights, it's advisable to review the specific contents or supplementary materials provided to ascertain if additional resources or data are available.
14. How can I stay updated on further developments or reports in the Connected Vehicles Industry in Europe?
To stay informed about further developments, trends, and reports in the Connected Vehicles Industry in Europe, consider subscribing to industry newsletters, following relevant companies and organizations, or regularly checking reputable industry news sources and publications.
Methodology
Step 1 - Identification of Relevant Samples Size from Population Database


Step 2 - Approaches for Defining Global Market Size (Value, Volume* & Price*)

Note*: In applicable scenarios
Step 3 - Data Sources
Primary Research
- Web Analytics
- Survey Reports
- Research Institute
- Latest Research Reports
- Opinion Leaders
Secondary Research
- Annual Reports
- White Paper
- Latest Press Release
- Industry Association
- Paid Database
- Investor Presentations

Step 4 - Data Triangulation
Involves using different sources of information in order to increase the validity of a study
These sources are likely to be stakeholders in a program - participants, other researchers, program staff, other community members, and so on.
Then we put all data in single framework & apply various statistical tools to find out the dynamic on the market.
During the analysis stage, feedback from the stakeholder groups would be compared to determine areas of agreement as well as areas of divergence


