
Key Insights
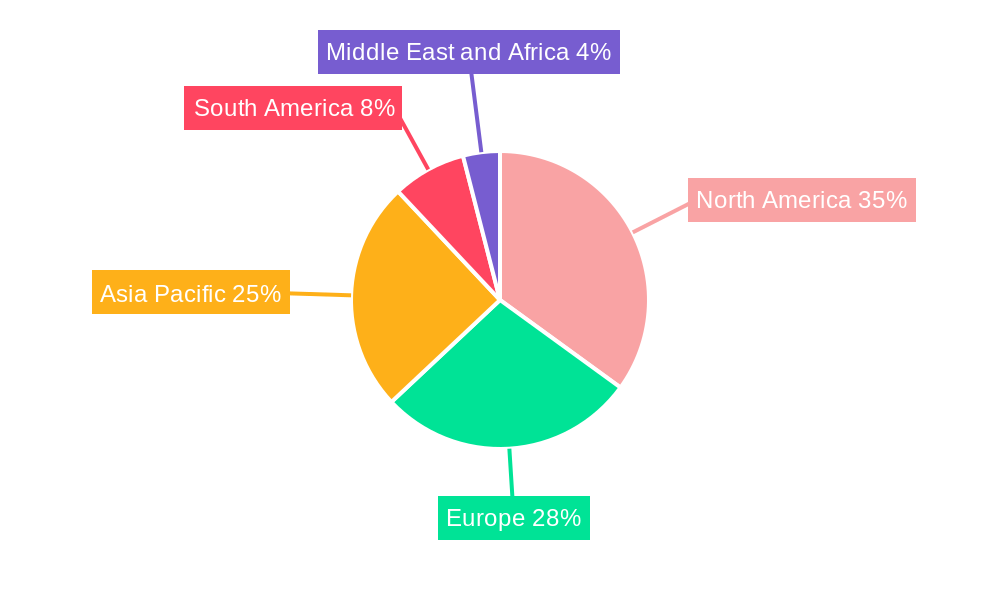
The Cone Beam Computed Tomography (CBCT) market is experiencing robust growth, driven by the increasing adoption of minimally invasive dental procedures, the rising prevalence of dental diseases, and advancements in imaging technology offering improved image quality and faster scan times. The market's Compound Annual Growth Rate (CAGR) of 9.90% from 2019 to 2024 suggests a significant expansion, and this momentum is expected to continue throughout the forecast period (2025-2033). The dental application segment currently dominates the market, fueled by the growing demand for precise diagnostic imaging in implantology, orthodontics, and endodontics. However, the 'other applications' segment, encompassing applications in maxillofacial surgery and other medical fields, is projected to witness substantial growth due to the increasing awareness of CBCT's versatility and its ability to provide detailed 3D images crucial for complex surgical planning. The seated position segment holds the largest market share among patient positions, primarily due to the convenience and ease of use for both patients and practitioners. Hospitals and imaging centers are the leading end-users, but the market is also seeing growth within private dental practices as the cost of CBCT systems decreases and their benefits become more widely understood. Geographic expansion is also a significant factor, with North America and Europe currently leading the market, while the Asia-Pacific region is poised for substantial growth due to its expanding healthcare infrastructure and increasing disposable incomes.
Market restraints include the high initial investment cost associated with CBCT systems, the need for specialized training for operation and image interpretation, and concerns surrounding radiation exposure. However, ongoing technological advancements, such as the development of lower-dose imaging techniques and user-friendly software, are mitigating these concerns. The competitive landscape is characterized by the presence of both established players and emerging companies, leading to ongoing innovation and competition in terms of pricing, features, and technological advancements. The presence of key players like Vatech America, Dentsply Sirona, and Danaher Corporation signifies a commitment to research and development, further pushing the boundaries of CBCT technology and expanding its applications across various medical and dental sectors. The overall market outlook for CBCT remains positive, with continued growth expected across all major segments and regions in the coming years.
Cone Beam Computed Tomography (CBCT) Industry Market Report: 2019-2033
This comprehensive report provides a detailed analysis of the Cone Beam Computed Tomography (CBCT) industry, offering invaluable insights for stakeholders seeking to understand market dynamics, competitive landscapes, and future growth opportunities. The study period covers 2019-2033, with a base year of 2025 and a forecast period of 2025-2033. The report analyzes a market valued at xx Million in 2025, projected to reach xx Million by 2033, exhibiting a CAGR of xx%.
Cone Beam Computed Tomography Industry Market Structure & Competitive Dynamics
The global CBCT market is characterized by a moderately concentrated structure with several key players vying for market share. While a few dominant companies hold significant positions, the market also features numerous smaller players, particularly in specialized niches. Market concentration is influenced by factors like technological advancements, regulatory approvals, and strategic mergers and acquisitions (M&A). Innovation ecosystems play a crucial role, with ongoing research and development leading to improved image quality, reduced radiation exposure, and enhanced software capabilities. Regulatory frameworks, including those related to medical device approvals and data privacy, significantly shape market entry and operations. Product substitutes, such as conventional radiography, are less versatile and offer lower image resolution, hence limiting their impact. End-user trends demonstrate a growing preference for advanced imaging techniques, driven by improved diagnostic accuracy and minimally invasive procedures. M&A activity has been relatively robust, with deals often focused on expanding product portfolios, geographical reach, and technological capabilities. For instance, while precise deal values are often confidential, major acquisitions in the past few years suggest M&A deal values ranging from xx Million to xx Million. The leading companies, such as Vatech America, Dentsply Sirona, and Planmeca Group, maintain a significant share of the market; however, smaller firms specializing in niche applications or regions are also making considerable contributions. Market share data for 2025 indicates Vatech America holding approximately xx% market share, Dentsply Sirona at xx%, and Planmeca Group at xx%. Remaining market share is distributed among other competitors listed above and numerous smaller participants.
Cone Beam Computed Tomography Industry Industry Trends & Insights
The CBCT market exhibits robust growth driven by several key factors. The increasing prevalence of dental diseases and the rising demand for advanced diagnostic imaging solutions are major catalysts for market expansion. Technological advancements, including the development of faster scan times, higher resolution imaging, and improved software functionalities, enhance the appeal of CBCT systems. Furthermore, growing awareness among healthcare professionals about the benefits of CBCT technology, such as its ability to provide detailed 3D images for precise diagnosis and treatment planning, fuels market growth. Consumer preferences lean towards systems that offer convenience, improved image quality, and lower radiation dose. Competitive dynamics are characterized by ongoing innovation, strategic partnerships, and intense competition among established players and emerging companies. The market penetration of CBCT systems has increased significantly in recent years, particularly in developed nations, but considerable growth potential remains in emerging markets. The CAGR for the forecast period (2025-2033) is projected to be xx%, reflecting the continuing expansion of the CBCT market.
Dominant Markets & Segments in Cone Beam Computed Tomography Industry
The CBCT market is geographically diverse, with significant growth observed across various regions. However, North America currently holds a dominant position, owing to high healthcare expenditure, advanced healthcare infrastructure, and high adoption rates. Within the application segment, dental applications represent the largest share, driven by its wide use in endodontics, implantology, orthodontics, and periodontics. Other applications, encompassing maxillofacial surgery, ENT, and orthopedics, are also showing promising growth. The seated position is the most prevalent patient position for CBCT scans, although supine and standing positions also find specific applications depending on the clinical needs. Hospitals and imaging centers constitute the primary end-users, owing to their established infrastructure and expertise in managing advanced imaging technologies.
Key Drivers for North America Dominance:
- High healthcare expenditure
- Advanced medical infrastructure
- High adoption rates of advanced technologies
- Strong regulatory environment supportive of medical innovation
Key Drivers for Dental Application Dominance:
- Rising prevalence of dental diseases
- Growing demand for advanced diagnostic tools
- Improved treatment planning capabilities and precision
Key Drivers for Hospital/Imaging Center Dominance:
- Established infrastructure and expertise
- Presence of specialized staff and equipment for managing CBCT
Cone Beam Computed Tomography Industry Product Innovations
Recent innovations in CBCT technology focus on reducing radiation dose, enhancing image quality, and improving workflow efficiency. Manufacturers are integrating advanced software algorithms for image processing and analysis, making CBCT systems more user-friendly and efficient. The development of portable and mobile CBCT systems enhances accessibility and convenience. The introduction of new applications, such as those in maxillofacial surgery and orthopedics, expands the market's reach and appeal, strengthening competitive advantages. These innovations effectively target the needs of both clinicians and patients, leading to a wider acceptance and market growth for CBCT technology.
Report Segmentation & Scope
This report segments the CBCT market across several key parameters:
Application: The report analyzes the market for Dental Applications and Other Applications, providing growth projections and competitive landscapes for each. Dental applications are forecast to dominate, with continued high demand. Other Applications are projected to show robust growth due to expanding applications in various medical fields.
Patient Position: The market is segmented into Standing/Seated Position, Seated Position, Supine Position, and Others, offering a detailed breakdown of market size and growth trends for each.
End-User: Hospitals and Imaging Centers constitute the primary end-user segments, with the report providing insights into their individual growth trajectories and competitive dynamics within each segment. The "Others" segment includes smaller clinics and private practices and will be analyzed for its growth potential and characteristics.
Key Drivers of Cone Beam Computed Tomography Industry Growth
Several factors are driving the growth of the CBCT industry. Technological advancements, such as improved image quality, reduced scan times, and lower radiation doses, are significantly increasing the adoption of CBCT systems. The rising prevalence of dental and maxillofacial diseases is creating a substantial demand for accurate and efficient diagnostic tools. Favorable regulatory environments in several countries are promoting the adoption of advanced medical technologies like CBCT, and increasing healthcare expenditure globally fuels investments in advanced imaging equipment.
Challenges in the Cone Beam Computed Tomography Industry Sector
The CBCT industry faces several challenges, including the high initial investment costs associated with purchasing and maintaining the equipment, potential regulatory hurdles related to medical device approvals and data privacy, and competition from alternative imaging technologies. Supply chain disruptions can impact the availability and cost of components, and fluctuating raw material prices add to the economic challenges of manufacturing.
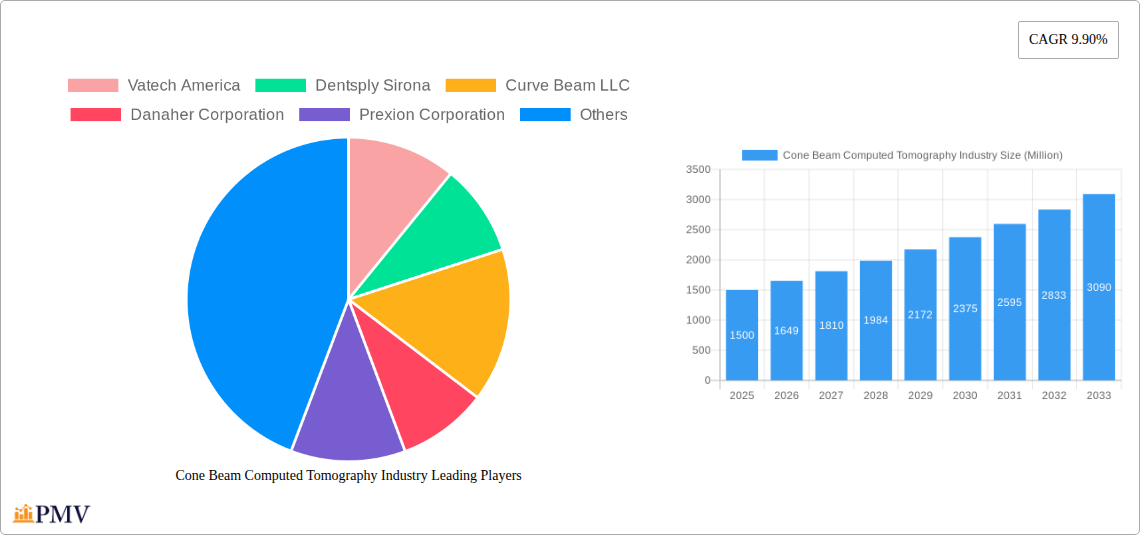
Leading Players in the Cone Beam Computed Tomography Industry Market
- Vatech America
- Dentsply Sirona
- Curve Beam LLC
- Danaher Corporation
- Prexion Corporation
- Carestream Health Inc
- Planmeca Group
- Asahi RoEntgen Ind Co Ltd
- J Morita Mfg Corp
- Cefla S C
Key Developments in Cone Beam Computed Tomography Industry Sector
- June 2022: Xoran Technologies received a patent for a modular cone beam computed tomography (CT) system assembly. This development highlights advancements in system design and potential for improved accessibility and flexibility.
- April 2022: A research study confirmed the use of cone-beam computed tomography in analyzing root canal thickness, highlighting the technology's expanding clinical applications.
Strategic Cone Beam Computed Tomography Industry Market Outlook
The CBCT market presents significant growth opportunities, driven by technological advancements, expanding applications, and the rising demand for advanced imaging solutions. Strategic partnerships, focused R&D, and expansion into emerging markets will be key for industry players. Companies specializing in innovative software solutions and those focusing on reducing radiation doses and improving image quality are likely to gain a competitive edge. The market’s future success hinges on continuous innovation, addressing regulatory requirements effectively, and focusing on improved patient care through enhanced diagnostic capabilities.
Cone Beam Computed Tomography Industry Segmentation
-
1. Application
-
1.1. Dental Applications
- 1.1.1. Orthodontics
- 1.1.2. Endodontics
- 1.1.3. Periodontics
- 1.1.4. General Dentistry
- 1.1.5. Others
- 1.2. Other Applications
-
1.1. Dental Applications
-
2. Patient Position
- 2.1. Standing/Seated Position
- 2.2. Supine Position
-
3. End User
- 3.1. Hospitals
- 3.2. Imaging Centers
- 3.3. Others
Cone Beam Computed Tomography Industry Segmentation By Geography
-
1. North America
- 1.1. United States
- 1.2. Canada
- 1.3. Mexico
-
2. Europe
- 2.1. Germany
- 2.2. United Kingdom
- 2.3. France
- 2.4. Italy
- 2.5. Spain
- 2.6. Rest of Europe
-
3. Asia Pacific
- 3.1. China
- 3.2. Japan
- 3.3. India
- 3.4. Australia
- 3.5. South Korea
- 3.6. Rest of Asia Pacific
-
4. Middle East and Africa
- 4.1. GCC
- 4.2. South Africa
- 4.3. Rest of Middle East and Africa
-
5. South America
- 5.1. Brazil
- 5.2. Argentina
- 5.3. Rest of South America
Cone Beam Computed Tomography Industry REPORT HIGHLIGHTS
| Aspects | Details |
|---|---|
| Study Period | 2019-2033 |
| Base Year | 2024 |
| Estimated Year | 2025 |
| Forecast Period | 2025-2033 |
| Historical Period | 2019-2024 |
| Growth Rate | CAGR of 9.90% from 2019-2033 |
| Segmentation |
|
Table of Contents
- 1. Introduction
- 1.1. Research Scope
- 1.2. Market Segmentation
- 1.3. Research Methodology
- 1.4. Definitions and Assumptions
- 2. Executive Summary
- 2.1. Introduction
- 3. Market Dynamics
- 3.1. Introduction
- 3.2. Market Drivers
- 3.2.1. Increasing Cases of Dental Disorders; Advancements in Technology; Expanding Application Areas of CBCT Systems
- 3.3. Market Restrains
- 3.3.1. High Cost of CBCT Systems; Imaging Issues
- 3.4. Market Trends
- 3.4.1. Periodontal Applications is Expected to Dominate the Cone Beam Computed Tomography (CBCT) Market During the Forecast Period
- 4. Market Factor Analysis
- 4.1. Porters Five Forces
- 4.2. Supply/Value Chain
- 4.3. PESTEL analysis
- 4.4. Market Entropy
- 4.5. Patent/Trademark Analysis
- 5. Global Cone Beam Computed Tomography Industry Analysis, Insights and Forecast, 2019-2031
- 5.1. Market Analysis, Insights and Forecast - by Application
- 5.1.1. Dental Applications
- 5.1.1.1. Orthodontics
- 5.1.1.2. Endodontics
- 5.1.1.3. Periodontics
- 5.1.1.4. General Dentistry
- 5.1.1.5. Others
- 5.1.2. Other Applications
- 5.1.1. Dental Applications
- 5.2. Market Analysis, Insights and Forecast - by Patient Position
- 5.2.1. Standing/Seated Position
- 5.2.2. Supine Position
- 5.3. Market Analysis, Insights and Forecast - by End User
- 5.3.1. Hospitals
- 5.3.2. Imaging Centers
- 5.3.3. Others
- 5.4. Market Analysis, Insights and Forecast - by Region
- 5.4.1. North America
- 5.4.2. Europe
- 5.4.3. Asia Pacific
- 5.4.4. Middle East and Africa
- 5.4.5. South America
- 5.1. Market Analysis, Insights and Forecast - by Application
- 6. North America Cone Beam Computed Tomography Industry Analysis, Insights and Forecast, 2019-2031
- 6.1. Market Analysis, Insights and Forecast - by Application
- 6.1.1. Dental Applications
- 6.1.1.1. Orthodontics
- 6.1.1.2. Endodontics
- 6.1.1.3. Periodontics
- 6.1.1.4. General Dentistry
- 6.1.1.5. Others
- 6.1.2. Other Applications
- 6.1.1. Dental Applications
- 6.2. Market Analysis, Insights and Forecast - by Patient Position
- 6.2.1. Standing/Seated Position
- 6.2.2. Supine Position
- 6.3. Market Analysis, Insights and Forecast - by End User
- 6.3.1. Hospitals
- 6.3.2. Imaging Centers
- 6.3.3. Others
- 6.1. Market Analysis, Insights and Forecast - by Application
- 7. Europe Cone Beam Computed Tomography Industry Analysis, Insights and Forecast, 2019-2031
- 7.1. Market Analysis, Insights and Forecast - by Application
- 7.1.1. Dental Applications
- 7.1.1.1. Orthodontics
- 7.1.1.2. Endodontics
- 7.1.1.3. Periodontics
- 7.1.1.4. General Dentistry
- 7.1.1.5. Others
- 7.1.2. Other Applications
- 7.1.1. Dental Applications
- 7.2. Market Analysis, Insights and Forecast - by Patient Position
- 7.2.1. Standing/Seated Position
- 7.2.2. Supine Position
- 7.3. Market Analysis, Insights and Forecast - by End User
- 7.3.1. Hospitals
- 7.3.2. Imaging Centers
- 7.3.3. Others
- 7.1. Market Analysis, Insights and Forecast - by Application
- 8. Asia Pacific Cone Beam Computed Tomography Industry Analysis, Insights and Forecast, 2019-2031
- 8.1. Market Analysis, Insights and Forecast - by Application
- 8.1.1. Dental Applications
- 8.1.1.1. Orthodontics
- 8.1.1.2. Endodontics
- 8.1.1.3. Periodontics
- 8.1.1.4. General Dentistry
- 8.1.1.5. Others
- 8.1.2. Other Applications
- 8.1.1. Dental Applications
- 8.2. Market Analysis, Insights and Forecast - by Patient Position
- 8.2.1. Standing/Seated Position
- 8.2.2. Supine Position
- 8.3. Market Analysis, Insights and Forecast - by End User
- 8.3.1. Hospitals
- 8.3.2. Imaging Centers
- 8.3.3. Others
- 8.1. Market Analysis, Insights and Forecast - by Application
- 9. Middle East and Africa Cone Beam Computed Tomography Industry Analysis, Insights and Forecast, 2019-2031
- 9.1. Market Analysis, Insights and Forecast - by Application
- 9.1.1. Dental Applications
- 9.1.1.1. Orthodontics
- 9.1.1.2. Endodontics
- 9.1.1.3. Periodontics
- 9.1.1.4. General Dentistry
- 9.1.1.5. Others
- 9.1.2. Other Applications
- 9.1.1. Dental Applications
- 9.2. Market Analysis, Insights and Forecast - by Patient Position
- 9.2.1. Standing/Seated Position
- 9.2.2. Supine Position
- 9.3. Market Analysis, Insights and Forecast - by End User
- 9.3.1. Hospitals
- 9.3.2. Imaging Centers
- 9.3.3. Others
- 9.1. Market Analysis, Insights and Forecast - by Application
- 10. South America Cone Beam Computed Tomography Industry Analysis, Insights and Forecast, 2019-2031
- 10.1. Market Analysis, Insights and Forecast - by Application
- 10.1.1. Dental Applications
- 10.1.1.1. Orthodontics
- 10.1.1.2. Endodontics
- 10.1.1.3. Periodontics
- 10.1.1.4. General Dentistry
- 10.1.1.5. Others
- 10.1.2. Other Applications
- 10.1.1. Dental Applications
- 10.2. Market Analysis, Insights and Forecast - by Patient Position
- 10.2.1. Standing/Seated Position
- 10.2.2. Supine Position
- 10.3. Market Analysis, Insights and Forecast - by End User
- 10.3.1. Hospitals
- 10.3.2. Imaging Centers
- 10.3.3. Others
- 10.1. Market Analysis, Insights and Forecast - by Application
- 11. North America Cone Beam Computed Tomography Industry Analysis, Insights and Forecast, 2019-2031
- 11.1. Market Analysis, Insights and Forecast - By Country/Sub-region
- 11.1.1 United States
- 11.1.2 Canada
- 11.1.3 Mexico
- 12. Europe Cone Beam Computed Tomography Industry Analysis, Insights and Forecast, 2019-2031
- 12.1. Market Analysis, Insights and Forecast - By Country/Sub-region
- 12.1.1 Germany
- 12.1.2 United Kingdom
- 12.1.3 France
- 12.1.4 Italy
- 12.1.5 Spain
- 12.1.6 Rest of Europe
- 13. Asia Pacific Cone Beam Computed Tomography Industry Analysis, Insights and Forecast, 2019-2031
- 13.1. Market Analysis, Insights and Forecast - By Country/Sub-region
- 13.1.1 China
- 13.1.2 Japan
- 13.1.3 India
- 13.1.4 Australia
- 13.1.5 South Korea
- 13.1.6 Rest of Asia Pacific
- 14. South America Cone Beam Computed Tomography Industry Analysis, Insights and Forecast, 2019-2031
- 14.1. Market Analysis, Insights and Forecast - By Country/Sub-region
- 14.1.1 Brazil
- 14.1.2 Argentina
- 14.1.3 Rest of South America
- 15. Middle East and Africa Cone Beam Computed Tomography Industry Analysis, Insights and Forecast, 2019-2031
- 15.1. Market Analysis, Insights and Forecast - By Country/Sub-region
- 15.1.1 GCC
- 15.1.2 South Africa
- 15.1.3 Rest of Middle East and Africa
- 16. Competitive Analysis
- 16.1. Global Market Share Analysis 2024
- 16.2. Company Profiles
- 16.2.1 Vatech America
- 16.2.1.1. Overview
- 16.2.1.2. Products
- 16.2.1.3. SWOT Analysis
- 16.2.1.4. Recent Developments
- 16.2.1.5. Financials (Based on Availability)
- 16.2.2 Dentsply Sirona
- 16.2.2.1. Overview
- 16.2.2.2. Products
- 16.2.2.3. SWOT Analysis
- 16.2.2.4. Recent Developments
- 16.2.2.5. Financials (Based on Availability)
- 16.2.3 Curve Beam LLC
- 16.2.3.1. Overview
- 16.2.3.2. Products
- 16.2.3.3. SWOT Analysis
- 16.2.3.4. Recent Developments
- 16.2.3.5. Financials (Based on Availability)
- 16.2.4 Danaher Corporation
- 16.2.4.1. Overview
- 16.2.4.2. Products
- 16.2.4.3. SWOT Analysis
- 16.2.4.4. Recent Developments
- 16.2.4.5. Financials (Based on Availability)
- 16.2.5 Prexion Corporation
- 16.2.5.1. Overview
- 16.2.5.2. Products
- 16.2.5.3. SWOT Analysis
- 16.2.5.4. Recent Developments
- 16.2.5.5. Financials (Based on Availability)
- 16.2.6 Carestream Health Inc
- 16.2.6.1. Overview
- 16.2.6.2. Products
- 16.2.6.3. SWOT Analysis
- 16.2.6.4. Recent Developments
- 16.2.6.5. Financials (Based on Availability)
- 16.2.7 Planmeca Group
- 16.2.7.1. Overview
- 16.2.7.2. Products
- 16.2.7.3. SWOT Analysis
- 16.2.7.4. Recent Developments
- 16.2.7.5. Financials (Based on Availability)
- 16.2.8 Asahi RoEntgen Ind Co Ltd
- 16.2.8.1. Overview
- 16.2.8.2. Products
- 16.2.8.3. SWOT Analysis
- 16.2.8.4. Recent Developments
- 16.2.8.5. Financials (Based on Availability)
- 16.2.9 J Morita Mfg Corp
- 16.2.9.1. Overview
- 16.2.9.2. Products
- 16.2.9.3. SWOT Analysis
- 16.2.9.4. Recent Developments
- 16.2.9.5. Financials (Based on Availability)
- 16.2.10 Cefla S C
- 16.2.10.1. Overview
- 16.2.10.2. Products
- 16.2.10.3. SWOT Analysis
- 16.2.10.4. Recent Developments
- 16.2.10.5. Financials (Based on Availability)
- 16.2.1 Vatech America
List of Figures
- Figure 1: Global Cone Beam Computed Tomography Industry Revenue Breakdown (Million, %) by Region 2024 & 2032
- Figure 2: North America Cone Beam Computed Tomography Industry Revenue (Million), by Country 2024 & 2032
- Figure 3: North America Cone Beam Computed Tomography Industry Revenue Share (%), by Country 2024 & 2032
- Figure 4: Europe Cone Beam Computed Tomography Industry Revenue (Million), by Country 2024 & 2032
- Figure 5: Europe Cone Beam Computed Tomography Industry Revenue Share (%), by Country 2024 & 2032
- Figure 6: Asia Pacific Cone Beam Computed Tomography Industry Revenue (Million), by Country 2024 & 2032
- Figure 7: Asia Pacific Cone Beam Computed Tomography Industry Revenue Share (%), by Country 2024 & 2032
- Figure 8: South America Cone Beam Computed Tomography Industry Revenue (Million), by Country 2024 & 2032
- Figure 9: South America Cone Beam Computed Tomography Industry Revenue Share (%), by Country 2024 & 2032
- Figure 10: Middle East and Africa Cone Beam Computed Tomography Industry Revenue (Million), by Country 2024 & 2032
- Figure 11: Middle East and Africa Cone Beam Computed Tomography Industry Revenue Share (%), by Country 2024 & 2032
- Figure 12: North America Cone Beam Computed Tomography Industry Revenue (Million), by Application 2024 & 2032
- Figure 13: North America Cone Beam Computed Tomography Industry Revenue Share (%), by Application 2024 & 2032
- Figure 14: North America Cone Beam Computed Tomography Industry Revenue (Million), by Patient Position 2024 & 2032
- Figure 15: North America Cone Beam Computed Tomography Industry Revenue Share (%), by Patient Position 2024 & 2032
- Figure 16: North America Cone Beam Computed Tomography Industry Revenue (Million), by End User 2024 & 2032
- Figure 17: North America Cone Beam Computed Tomography Industry Revenue Share (%), by End User 2024 & 2032
- Figure 18: North America Cone Beam Computed Tomography Industry Revenue (Million), by Country 2024 & 2032
- Figure 19: North America Cone Beam Computed Tomography Industry Revenue Share (%), by Country 2024 & 2032
- Figure 20: Europe Cone Beam Computed Tomography Industry Revenue (Million), by Application 2024 & 2032
- Figure 21: Europe Cone Beam Computed Tomography Industry Revenue Share (%), by Application 2024 & 2032
- Figure 22: Europe Cone Beam Computed Tomography Industry Revenue (Million), by Patient Position 2024 & 2032
- Figure 23: Europe Cone Beam Computed Tomography Industry Revenue Share (%), by Patient Position 2024 & 2032
- Figure 24: Europe Cone Beam Computed Tomography Industry Revenue (Million), by End User 2024 & 2032
- Figure 25: Europe Cone Beam Computed Tomography Industry Revenue Share (%), by End User 2024 & 2032
- Figure 26: Europe Cone Beam Computed Tomography Industry Revenue (Million), by Country 2024 & 2032
- Figure 27: Europe Cone Beam Computed Tomography Industry Revenue Share (%), by Country 2024 & 2032
- Figure 28: Asia Pacific Cone Beam Computed Tomography Industry Revenue (Million), by Application 2024 & 2032
- Figure 29: Asia Pacific Cone Beam Computed Tomography Industry Revenue Share (%), by Application 2024 & 2032
- Figure 30: Asia Pacific Cone Beam Computed Tomography Industry Revenue (Million), by Patient Position 2024 & 2032
- Figure 31: Asia Pacific Cone Beam Computed Tomography Industry Revenue Share (%), by Patient Position 2024 & 2032
- Figure 32: Asia Pacific Cone Beam Computed Tomography Industry Revenue (Million), by End User 2024 & 2032
- Figure 33: Asia Pacific Cone Beam Computed Tomography Industry Revenue Share (%), by End User 2024 & 2032
- Figure 34: Asia Pacific Cone Beam Computed Tomography Industry Revenue (Million), by Country 2024 & 2032
- Figure 35: Asia Pacific Cone Beam Computed Tomography Industry Revenue Share (%), by Country 2024 & 2032
- Figure 36: Middle East and Africa Cone Beam Computed Tomography Industry Revenue (Million), by Application 2024 & 2032
- Figure 37: Middle East and Africa Cone Beam Computed Tomography Industry Revenue Share (%), by Application 2024 & 2032
- Figure 38: Middle East and Africa Cone Beam Computed Tomography Industry Revenue (Million), by Patient Position 2024 & 2032
- Figure 39: Middle East and Africa Cone Beam Computed Tomography Industry Revenue Share (%), by Patient Position 2024 & 2032
- Figure 40: Middle East and Africa Cone Beam Computed Tomography Industry Revenue (Million), by End User 2024 & 2032
- Figure 41: Middle East and Africa Cone Beam Computed Tomography Industry Revenue Share (%), by End User 2024 & 2032
- Figure 42: Middle East and Africa Cone Beam Computed Tomography Industry Revenue (Million), by Country 2024 & 2032
- Figure 43: Middle East and Africa Cone Beam Computed Tomography Industry Revenue Share (%), by Country 2024 & 2032
- Figure 44: South America Cone Beam Computed Tomography Industry Revenue (Million), by Application 2024 & 2032
- Figure 45: South America Cone Beam Computed Tomography Industry Revenue Share (%), by Application 2024 & 2032
- Figure 46: South America Cone Beam Computed Tomography Industry Revenue (Million), by Patient Position 2024 & 2032
- Figure 47: South America Cone Beam Computed Tomography Industry Revenue Share (%), by Patient Position 2024 & 2032
- Figure 48: South America Cone Beam Computed Tomography Industry Revenue (Million), by End User 2024 & 2032
- Figure 49: South America Cone Beam Computed Tomography Industry Revenue Share (%), by End User 2024 & 2032
- Figure 50: South America Cone Beam Computed Tomography Industry Revenue (Million), by Country 2024 & 2032
- Figure 51: South America Cone Beam Computed Tomography Industry Revenue Share (%), by Country 2024 & 2032
List of Tables
- Table 1: Global Cone Beam Computed Tomography Industry Revenue Million Forecast, by Region 2019 & 2032
- Table 2: Global Cone Beam Computed Tomography Industry Revenue Million Forecast, by Application 2019 & 2032
- Table 3: Global Cone Beam Computed Tomography Industry Revenue Million Forecast, by Patient Position 2019 & 2032
- Table 4: Global Cone Beam Computed Tomography Industry Revenue Million Forecast, by End User 2019 & 2032
- Table 5: Global Cone Beam Computed Tomography Industry Revenue Million Forecast, by Region 2019 & 2032
- Table 6: Global Cone Beam Computed Tomography Industry Revenue Million Forecast, by Country 2019 & 2032
- Table 7: United States Cone Beam Computed Tomography Industry Revenue (Million) Forecast, by Application 2019 & 2032
- Table 8: Canada Cone Beam Computed Tomography Industry Revenue (Million) Forecast, by Application 2019 & 2032
- Table 9: Mexico Cone Beam Computed Tomography Industry Revenue (Million) Forecast, by Application 2019 & 2032
- Table 10: Global Cone Beam Computed Tomography Industry Revenue Million Forecast, by Country 2019 & 2032
- Table 11: Germany Cone Beam Computed Tomography Industry Revenue (Million) Forecast, by Application 2019 & 2032
- Table 12: United Kingdom Cone Beam Computed Tomography Industry Revenue (Million) Forecast, by Application 2019 & 2032
- Table 13: France Cone Beam Computed Tomography Industry Revenue (Million) Forecast, by Application 2019 & 2032
- Table 14: Italy Cone Beam Computed Tomography Industry Revenue (Million) Forecast, by Application 2019 & 2032
- Table 15: Spain Cone Beam Computed Tomography Industry Revenue (Million) Forecast, by Application 2019 & 2032
- Table 16: Rest of Europe Cone Beam Computed Tomography Industry Revenue (Million) Forecast, by Application 2019 & 2032
- Table 17: Global Cone Beam Computed Tomography Industry Revenue Million Forecast, by Country 2019 & 2032
- Table 18: China Cone Beam Computed Tomography Industry Revenue (Million) Forecast, by Application 2019 & 2032
- Table 19: Japan Cone Beam Computed Tomography Industry Revenue (Million) Forecast, by Application 2019 & 2032
- Table 20: India Cone Beam Computed Tomography Industry Revenue (Million) Forecast, by Application 2019 & 2032
- Table 21: Australia Cone Beam Computed Tomography Industry Revenue (Million) Forecast, by Application 2019 & 2032
- Table 22: South Korea Cone Beam Computed Tomography Industry Revenue (Million) Forecast, by Application 2019 & 2032
- Table 23: Rest of Asia Pacific Cone Beam Computed Tomography Industry Revenue (Million) Forecast, by Application 2019 & 2032
- Table 24: Global Cone Beam Computed Tomography Industry Revenue Million Forecast, by Country 2019 & 2032
- Table 25: Brazil Cone Beam Computed Tomography Industry Revenue (Million) Forecast, by Application 2019 & 2032
- Table 26: Argentina Cone Beam Computed Tomography Industry Revenue (Million) Forecast, by Application 2019 & 2032
- Table 27: Rest of South America Cone Beam Computed Tomography Industry Revenue (Million) Forecast, by Application 2019 & 2032
- Table 28: Global Cone Beam Computed Tomography Industry Revenue Million Forecast, by Country 2019 & 2032
- Table 29: GCC Cone Beam Computed Tomography Industry Revenue (Million) Forecast, by Application 2019 & 2032
- Table 30: South Africa Cone Beam Computed Tomography Industry Revenue (Million) Forecast, by Application 2019 & 2032
- Table 31: Rest of Middle East and Africa Cone Beam Computed Tomography Industry Revenue (Million) Forecast, by Application 2019 & 2032
- Table 32: Global Cone Beam Computed Tomography Industry Revenue Million Forecast, by Application 2019 & 2032
- Table 33: Global Cone Beam Computed Tomography Industry Revenue Million Forecast, by Patient Position 2019 & 2032
- Table 34: Global Cone Beam Computed Tomography Industry Revenue Million Forecast, by End User 2019 & 2032
- Table 35: Global Cone Beam Computed Tomography Industry Revenue Million Forecast, by Country 2019 & 2032
- Table 36: United States Cone Beam Computed Tomography Industry Revenue (Million) Forecast, by Application 2019 & 2032
- Table 37: Canada Cone Beam Computed Tomography Industry Revenue (Million) Forecast, by Application 2019 & 2032
- Table 38: Mexico Cone Beam Computed Tomography Industry Revenue (Million) Forecast, by Application 2019 & 2032
- Table 39: Global Cone Beam Computed Tomography Industry Revenue Million Forecast, by Application 2019 & 2032
- Table 40: Global Cone Beam Computed Tomography Industry Revenue Million Forecast, by Patient Position 2019 & 2032
- Table 41: Global Cone Beam Computed Tomography Industry Revenue Million Forecast, by End User 2019 & 2032
- Table 42: Global Cone Beam Computed Tomography Industry Revenue Million Forecast, by Country 2019 & 2032
- Table 43: Germany Cone Beam Computed Tomography Industry Revenue (Million) Forecast, by Application 2019 & 2032
- Table 44: United Kingdom Cone Beam Computed Tomography Industry Revenue (Million) Forecast, by Application 2019 & 2032
- Table 45: France Cone Beam Computed Tomography Industry Revenue (Million) Forecast, by Application 2019 & 2032
- Table 46: Italy Cone Beam Computed Tomography Industry Revenue (Million) Forecast, by Application 2019 & 2032
- Table 47: Spain Cone Beam Computed Tomography Industry Revenue (Million) Forecast, by Application 2019 & 2032
- Table 48: Rest of Europe Cone Beam Computed Tomography Industry Revenue (Million) Forecast, by Application 2019 & 2032
- Table 49: Global Cone Beam Computed Tomography Industry Revenue Million Forecast, by Application 2019 & 2032
- Table 50: Global Cone Beam Computed Tomography Industry Revenue Million Forecast, by Patient Position 2019 & 2032
- Table 51: Global Cone Beam Computed Tomography Industry Revenue Million Forecast, by End User 2019 & 2032
- Table 52: Global Cone Beam Computed Tomography Industry Revenue Million Forecast, by Country 2019 & 2032
- Table 53: China Cone Beam Computed Tomography Industry Revenue (Million) Forecast, by Application 2019 & 2032
- Table 54: Japan Cone Beam Computed Tomography Industry Revenue (Million) Forecast, by Application 2019 & 2032
- Table 55: India Cone Beam Computed Tomography Industry Revenue (Million) Forecast, by Application 2019 & 2032
- Table 56: Australia Cone Beam Computed Tomography Industry Revenue (Million) Forecast, by Application 2019 & 2032
- Table 57: South Korea Cone Beam Computed Tomography Industry Revenue (Million) Forecast, by Application 2019 & 2032
- Table 58: Rest of Asia Pacific Cone Beam Computed Tomography Industry Revenue (Million) Forecast, by Application 2019 & 2032
- Table 59: Global Cone Beam Computed Tomography Industry Revenue Million Forecast, by Application 2019 & 2032
- Table 60: Global Cone Beam Computed Tomography Industry Revenue Million Forecast, by Patient Position 2019 & 2032
- Table 61: Global Cone Beam Computed Tomography Industry Revenue Million Forecast, by End User 2019 & 2032
- Table 62: Global Cone Beam Computed Tomography Industry Revenue Million Forecast, by Country 2019 & 2032
- Table 63: GCC Cone Beam Computed Tomography Industry Revenue (Million) Forecast, by Application 2019 & 2032
- Table 64: South Africa Cone Beam Computed Tomography Industry Revenue (Million) Forecast, by Application 2019 & 2032
- Table 65: Rest of Middle East and Africa Cone Beam Computed Tomography Industry Revenue (Million) Forecast, by Application 2019 & 2032
- Table 66: Global Cone Beam Computed Tomography Industry Revenue Million Forecast, by Application 2019 & 2032
- Table 67: Global Cone Beam Computed Tomography Industry Revenue Million Forecast, by Patient Position 2019 & 2032
- Table 68: Global Cone Beam Computed Tomography Industry Revenue Million Forecast, by End User 2019 & 2032
- Table 69: Global Cone Beam Computed Tomography Industry Revenue Million Forecast, by Country 2019 & 2032
- Table 70: Brazil Cone Beam Computed Tomography Industry Revenue (Million) Forecast, by Application 2019 & 2032
- Table 71: Argentina Cone Beam Computed Tomography Industry Revenue (Million) Forecast, by Application 2019 & 2032
- Table 72: Rest of South America Cone Beam Computed Tomography Industry Revenue (Million) Forecast, by Application 2019 & 2032
Frequently Asked Questions
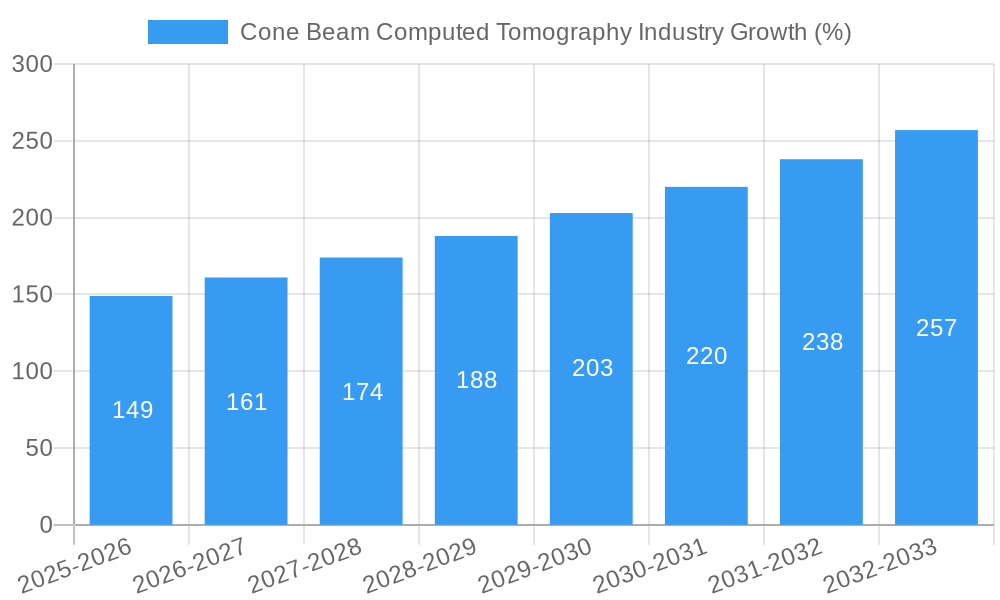
1. What is the projected Compound Annual Growth Rate (CAGR) of the Cone Beam Computed Tomography Industry?
The projected CAGR is approximately 9.90%.
2. Which companies are prominent players in the Cone Beam Computed Tomography Industry?
Key companies in the market include Vatech America, Dentsply Sirona, Curve Beam LLC, Danaher Corporation, Prexion Corporation, Carestream Health Inc, Planmeca Group, Asahi RoEntgen Ind Co Ltd, J Morita Mfg Corp, Cefla S C.
3. What are the main segments of the Cone Beam Computed Tomography Industry?
The market segments include Application, Patient Position, End User.
4. Can you provide details about the market size?
The market size is estimated to be USD XX Million as of 2022.
5. What are some drivers contributing to market growth?
Increasing Cases of Dental Disorders; Advancements in Technology; Expanding Application Areas of CBCT Systems.
6. What are the notable trends driving market growth?
Periodontal Applications is Expected to Dominate the Cone Beam Computed Tomography (CBCT) Market During the Forecast Period.
7. Are there any restraints impacting market growth?
High Cost of CBCT Systems; Imaging Issues.
8. Can you provide examples of recent developments in the market?
In June 2022, Xoran Technologies received a patent for a modular cone beam computed tomography (CT) system assembly.
9. What pricing options are available for accessing the report?
Pricing options include single-user, multi-user, and enterprise licenses priced at USD 4750, USD 5250, and USD 8750 respectively.
10. Is the market size provided in terms of value or volume?
The market size is provided in terms of value, measured in Million.
11. Are there any specific market keywords associated with the report?
Yes, the market keyword associated with the report is "Cone Beam Computed Tomography Industry," which aids in identifying and referencing the specific market segment covered.
12. How do I determine which pricing option suits my needs best?
The pricing options vary based on user requirements and access needs. Individual users may opt for single-user licenses, while businesses requiring broader access may choose multi-user or enterprise licenses for cost-effective access to the report.
13. Are there any additional resources or data provided in the Cone Beam Computed Tomography Industry report?
While the report offers comprehensive insights, it's advisable to review the specific contents or supplementary materials provided to ascertain if additional resources or data are available.
14. How can I stay updated on further developments or reports in the Cone Beam Computed Tomography Industry?
To stay informed about further developments, trends, and reports in the Cone Beam Computed Tomography Industry, consider subscribing to industry newsletters, following relevant companies and organizations, or regularly checking reputable industry news sources and publications.
Methodology
Step 1 - Identification of Relevant Samples Size from Population Database


Step 2 - Approaches for Defining Global Market Size (Value, Volume* & Price*)

Note*: In applicable scenarios
Step 3 - Data Sources
Primary Research
- Web Analytics
- Survey Reports
- Research Institute
- Latest Research Reports
- Opinion Leaders
Secondary Research
- Annual Reports
- White Paper
- Latest Press Release
- Industry Association
- Paid Database
- Investor Presentations

Step 4 - Data Triangulation
Involves using different sources of information in order to increase the validity of a study
These sources are likely to be stakeholders in a program - participants, other researchers, program staff, other community members, and so on.
Then we put all data in single framework & apply various statistical tools to find out the dynamic on the market.
During the analysis stage, feedback from the stakeholder groups would be compared to determine areas of agreement as well as areas of divergence


