
Key Insights
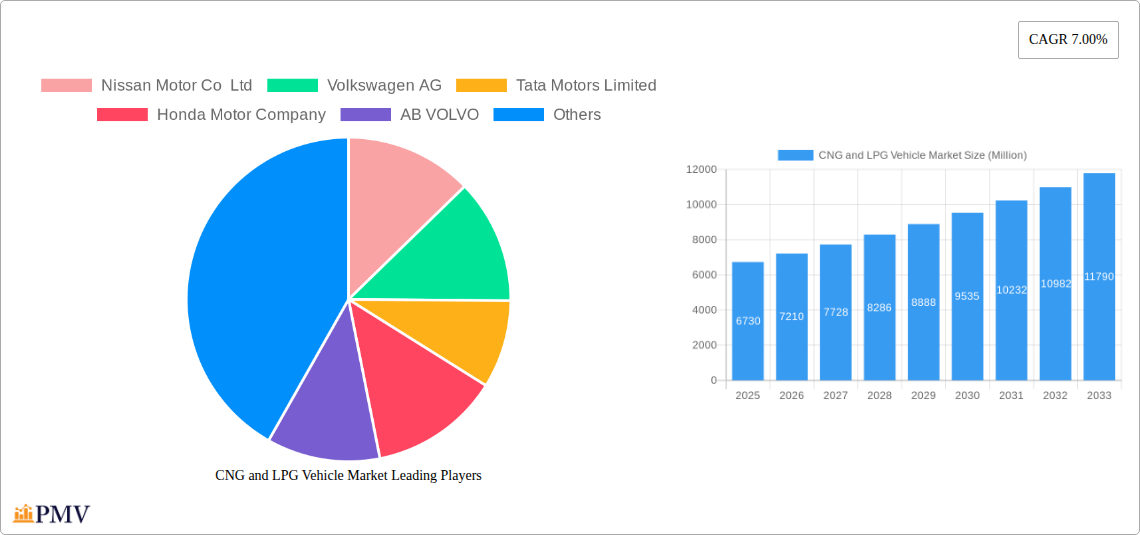
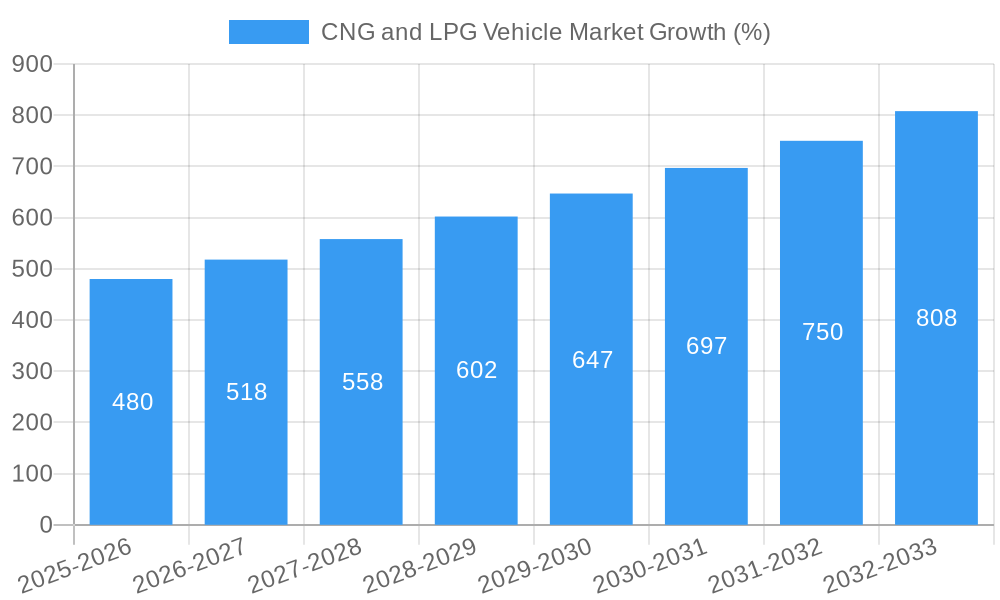
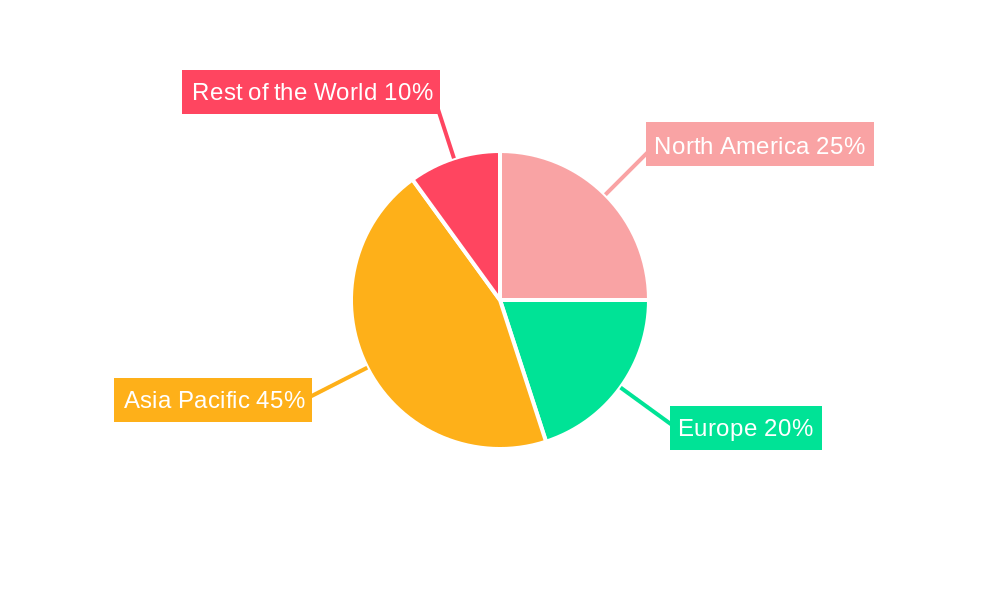
The global CNG and LPG vehicle market, valued at $6.73 billion in 2025, is projected to experience robust growth, driven by increasing environmental concerns and stringent emission regulations globally. The Compound Annual Growth Rate (CAGR) of 7.00% from 2025 to 2033 indicates a significant expansion, largely fueled by government incentives promoting cleaner transportation solutions and the rising adoption of these fuel types in both passenger cars and commercial vehicles. The market segmentation reveals a dynamic landscape, with CNG potentially holding a larger market share due to its lower cost compared to LPG, especially in regions with established CNG infrastructure. However, LPG's ease of storage and transportation might provide a competitive advantage in areas lacking extensive CNG networks. The sales channel is split between Original Equipment Manufacturers (OEMs) integrating CNG/LPG systems directly into new vehicles and the retrofitting market, which modifies existing gasoline or diesel vehicles to utilize alternative fuels. The Asia-Pacific region, particularly India and China, is expected to be a key growth driver due to their large vehicle populations and active government policies supporting alternative fuel adoption. Growth will also be influenced by technological advancements improving the efficiency and performance of CNG/LPG engines, addressing range anxiety concerns currently limiting widespread adoption. Conversely, factors like the limited refueling infrastructure in certain regions and fluctuating fuel prices represent key restraints on market expansion. The competitive landscape involves major automotive players like Nissan, Volkswagen, Tata Motors, and Honda, as well as specialized retrofitting companies. These companies are constantly striving to innovate and enhance their product offerings to stay ahead in this rapidly evolving market.
The forecast period (2025-2033) anticipates a steady expansion, driven by continued government support, technological advancements, and increasing consumer awareness of environmental sustainability. The North American and European markets, while showing growth, might face comparatively slower expansion due to already existing well-established infrastructure for traditional fuels. However, the market will likely see growth driven by the increasing popularity of eco-friendly options even in these more mature markets. The Rest of the World segment, comprising regions like South America and the Middle East and Africa, presents considerable untapped potential with increasing urbanization and growing vehicle ownership, though these markets may encounter challenges related to infrastructure development. Overall, the CNG and LPG vehicle market is poised for substantial growth in the coming years, presenting significant opportunities for industry players to capitalize on the growing demand for cleaner and more cost-effective transportation solutions.
CNG and LPG Vehicle Market: A Comprehensive Report (2019-2033)
This in-depth report provides a comprehensive analysis of the CNG and LPG vehicle market, offering crucial insights for businesses and investors seeking to navigate this dynamic sector. Covering the period from 2019 to 2033, with a focus on 2025, this report leverages rigorous data analysis to forecast market trends and identify key growth opportunities. The study includes detailed segmentation by fuel type (CNG, LPG), vehicle type (passenger cars, commercial vehicles), and sales channel (OEM, retrofitting), offering a granular perspective on market dynamics.
CNG and LPG Vehicle Market Structure & Competitive Dynamics
The CNG and LPG vehicle market exhibits a moderately concentrated structure, with several major players competing for market share. Key players include Nissan Motor Co Ltd, Volkswagen AG, Tata Motors Limited, Honda Motor Company, AB VOLVO, Hyundai Motor Company, Traton SE, Suzuki Motor Corporation, IVECO SpA, and Ford Motor Company. However, the market also accommodates numerous smaller players, particularly in the retrofitting segment.
Market share varies significantly across segments and regions. For example, in the passenger car segment, xx% of the market is held by the top five players, while the remaining xx% is fragmented amongst numerous smaller players. In the commercial vehicle segment, consolidation is more pronounced, with the top three players accounting for xx% of market share.
Innovation ecosystems are critical, driven by advancements in engine technology, fuel efficiency improvements, and alternative fuel sourcing. Regulatory frameworks, varying across regions, significantly impact market growth. Stringent emission regulations in some countries are driving demand for CNG and LPG vehicles, while supportive government policies, such as subsidies or tax incentives, further accelerate market expansion. Product substitutes, primarily electric vehicles, pose a competitive threat. However, the lower initial cost and existing infrastructure advantage of CNG/LPG vehicles offer a compelling counterpoint. Mergers and acquisitions (M&A) activities in this space are moderate but increasing, driven by the need for expansion into new markets and technological advancements. The total value of M&A deals in the past five years has been estimated at $xx Million. End-user trends point towards an increasing preference for cost-effective and environmentally friendly options.
CNG and LPG Vehicle Market Industry Trends & Insights
The CNG and LPG vehicle market is experiencing steady growth, driven by several factors. The global market is projected to grow at a Compound Annual Growth Rate (CAGR) of xx% during the forecast period (2025-2033), reaching a market size of $xx Million by 2033. This growth is fueled primarily by government initiatives aimed at reducing carbon emissions and improving air quality. The increasing cost of gasoline and diesel fuel makes CNG and LPG more attractive economically. Furthermore, advancements in engine technology are leading to enhanced performance and fuel efficiency, driving greater consumer appeal. However, the growth trajectory is impacted by fluctuating fuel prices and the increasing competition from electric vehicles. Market penetration of CNG and LPG vehicles varies significantly across regions, with developing nations experiencing faster adoption rates due to cost-effectiveness and readily available infrastructure. The transition to bio-CNG, as seen in Suzuki's initiative using cow dung, also suggests an emerging trend that could positively disrupt the industry. Technological disruptions, such as the development of more efficient and cleaner combustion systems, are expected to enhance the competitiveness of CNG and LPG vehicles in the future. Consumer preferences are shifting toward vehicles with lower running costs and reduced environmental impact. Competitive dynamics are characterized by both consolidation among leading players and a growing presence of smaller niche players specializing in specific vehicle types or retrofitting services.
Dominant Markets & Segments in CNG and LPG Vehicle Market
Dominant Region/Country: India is currently the dominant market, driven primarily by government support and increasing fuel prices. Other significant markets include China, Brazil, and several countries in the European Union.
Dominant Segment:
- By Fuel Type: CNG currently dominates, owing to its wider availability and lower cost compared to LPG.
- By Vehicle Type: The commercial vehicle segment is experiencing robust growth due to its cost-effectiveness in fleet operations. Passenger car adoption is growing steadily, albeit at a slower pace.
- By Sales Channel: OEM (Original Equipment Manufacturer) sales account for a significant portion of the market; however, the retrofitting segment is showing promising growth, particularly in regions with less established CNG/LPG infrastructure.
Key Drivers:
- Economic Policies: Government subsidies and tax incentives for CNG/LPG vehicles, especially in India and several developing countries.
- Infrastructure Development: Expansion of CNG filling stations (as seen in India's plan to increase the number from 6,000 to 17,700 by 2030) and LPG distribution networks directly impacts market growth.
- Environmental Regulations: Stringent emission norms in many countries are creating a favorable environment for CNG/LPG vehicles as a cleaner alternative to petrol and diesel vehicles.
- Fuel Price Volatility: Fluctuating gasoline and diesel prices make CNG/LPG a cost-effective alternative.
Detailed dominance analysis reveals that the Indian market's dominance stems from a perfect storm of these factors. The supportive government policy coupled with the relatively lower cost of CNG compared to gasoline and diesel is creating an environment where CNG vehicles are becoming increasingly popular amongst consumers and commercial fleets. While other regions are experiencing growth, none have yet reached the scale of adoption seen in India.
CNG and LPG Vehicle Market Product Innovations
Recent innovations focus on enhancing fuel efficiency, reducing emissions, and improving engine performance. The introduction of advanced combustion technologies, such as those used in Maruti Suzuki's Dzire S-CNG, provides better fuel economy and power output, thereby creating a better value proposition for consumers. The exploration of alternative CNG sources, like cow dung as explored by Suzuki Motor Corporation, highlights a significant trend toward sustainable fuel options. These developments align with both consumer preferences for greener transportation and government regulations promoting cleaner vehicles. The market fit is strong in regions where natural gas infrastructure is established and where government incentives promote sustainable fuels.
Report Segmentation & Scope
By Fuel Type: The report analyzes the market segments for Compressed Natural Gas (CNG) and Liquefied Petroleum Gas (LPG) vehicles separately, projecting growth rates and market size for each. Competitive dynamics differ between the two fuel types due to differing infrastructure requirements and fuel costs.
By Vehicle Type: The report differentiates between passenger cars and commercial vehicles, assessing distinct market trends and growth prospects for each segment. The commercial vehicle segment is expected to grow faster due to the cost-effectiveness of CNG and LPG for fleet operations.
By Sales Channel: The analysis includes Original Equipment Manufacturers (OEMs) and the retrofitting market, highlighting the different growth patterns, competitive landscapes, and market sizes of both segments. Retrofitting is expected to play a larger role in regions with less established CNG/LPG infrastructure.
Key Drivers of CNG and LPG Vehicle Growth
The CNG and LPG vehicle market is propelled by several factors. Technological advancements leading to improved fuel efficiency and reduced emissions are key drivers. Furthermore, supportive government policies, such as tax breaks and subsidies, are significantly boosting adoption. The increasing volatility of petrol and diesel prices, along with rising environmental concerns, is making CNG and LPG an attractive alternative. India's ambitious expansion of CNG infrastructure is another major growth catalyst.
Challenges in the CNG and LPG Vehicle Market Sector
Challenges include the limited availability of CNG filling stations in some regions, hindering widespread adoption. The higher initial cost of CNG- or LPG-equipped vehicles compared to petrol or diesel vehicles can be a deterrent for some consumers. Supply chain disruptions and the fluctuating prices of natural gas can also affect market growth. Furthermore, competition from electric vehicles presents a significant long-term challenge.
Leading Players in the CNG and LPG Vehicle Market
- Nissan Motor Co Ltd
- Volkswagen AG
- Tata Motors Limited
- Honda Motor Company
- AB VOLVO
- Hyundai Motor Company
- Traton SE
- Suzuki Motor Corporation
- IVECO SpA
- Ford Motor Company
Key Developments in CNG and LPG Vehicle Market Sector
- November 2023: The Indian government's commitment to expanding CNG stations from 6,000 to 17,700 by 2030, alongside the 12th CGD bidding round, is expected to significantly boost CNG vehicle demand.
- June 2023: The NEC's approval for large-scale CNG vehicle production in Nigeria signals market expansion into new territories.
- January 2023: Suzuki's plan to utilize cow dung for CNG vehicles demonstrates innovation in sustainable fuel sourcing, impacting long-term market trends.
- March 2022: Maruti Suzuki's launch of the Dzire S-CNG highlights product innovation, improving fuel efficiency and consumer appeal.
Strategic CNG and LPG Vehicle Market Outlook
The CNG and LPG vehicle market holds significant future potential. Ongoing technological advancements, government initiatives to promote cleaner fuels, and increasing fuel price volatility will drive market growth. Strategic opportunities exist in expanding into new markets, developing innovative fuel solutions, and focusing on improving the overall efficiency and affordability of CNG and LPG vehicles. The market is poised for expansion, especially in developing economies where cost-effectiveness and environmental benefits are prioritized. The strategic focus for growth should be on expanding infrastructure, improving engine technology to compete with electric vehicles, and exploration of bio-fuels.
CNG and LPG Vehicle Market Segmentation
-
1. Fuel Type
- 1.1. Compressed Natural Gas (CNG)
- 1.2. Liquefied Petroleum Gas (LPG)
-
2. Vehicle Type
- 2.1. Passenger Cars
- 2.2. Commercial Vehicles
-
3. Sales Channel
- 3.1. OEM
- 3.2. Retrofitting
CNG and LPG Vehicle Market Segmentation By Geography
-
1. North America
- 1.1. United States
- 1.2. Canada
- 1.3. Rest of North America
-
2. Europe
- 2.1. Germany
- 2.2. United Kingdom
- 2.3. France
- 2.4. Italy
- 2.5. Spain
- 2.6. Rest of Europe
-
3. Asia Pacific
- 3.1. India
- 3.2. China
- 3.3. Japan
- 3.4. South Korea
- 3.5. Rest of Asia Pacific
-
4. Rest of the World
- 4.1. South America
- 4.2. Middle East and Africa
CNG and LPG Vehicle Market REPORT HIGHLIGHTS
| Aspects | Details |
|---|---|
| Study Period | 2019-2033 |
| Base Year | 2024 |
| Estimated Year | 2025 |
| Forecast Period | 2025-2033 |
| Historical Period | 2019-2024 |
| Growth Rate | CAGR of 7.00% from 2019-2033 |
| Segmentation |
|
Table of Contents
- 1. Introduction
- 1.1. Research Scope
- 1.2. Market Segmentation
- 1.3. Research Methodology
- 1.4. Definitions and Assumptions
- 2. Executive Summary
- 2.1. Introduction
- 3. Market Dynamics
- 3.1. Introduction
- 3.2. Market Drivers
- 3.2.1. Increase in Demand for Clean Energy Driving the Market
- 3.3. Market Restrains
- 3.3.1. Rising Safety Concerns is Antcipated to Restrain the Market
- 3.4. Market Trends
- 3.4.1. Commercial Vehicles Fueling the Demand for CNG and LPG Vehicle
- 4. Market Factor Analysis
- 4.1. Porters Five Forces
- 4.2. Supply/Value Chain
- 4.3. PESTEL analysis
- 4.4. Market Entropy
- 4.5. Patent/Trademark Analysis
- 5. Global CNG and LPG Vehicle Market Analysis, Insights and Forecast, 2019-2031
- 5.1. Market Analysis, Insights and Forecast - by Fuel Type
- 5.1.1. Compressed Natural Gas (CNG)
- 5.1.2. Liquefied Petroleum Gas (LPG)
- 5.2. Market Analysis, Insights and Forecast - by Vehicle Type
- 5.2.1. Passenger Cars
- 5.2.2. Commercial Vehicles
- 5.3. Market Analysis, Insights and Forecast - by Sales Channel
- 5.3.1. OEM
- 5.3.2. Retrofitting
- 5.4. Market Analysis, Insights and Forecast - by Region
- 5.4.1. North America
- 5.4.2. Europe
- 5.4.3. Asia Pacific
- 5.4.4. Rest of the World
- 5.1. Market Analysis, Insights and Forecast - by Fuel Type
- 6. North America CNG and LPG Vehicle Market Analysis, Insights and Forecast, 2019-2031
- 6.1. Market Analysis, Insights and Forecast - by Fuel Type
- 6.1.1. Compressed Natural Gas (CNG)
- 6.1.2. Liquefied Petroleum Gas (LPG)
- 6.2. Market Analysis, Insights and Forecast - by Vehicle Type
- 6.2.1. Passenger Cars
- 6.2.2. Commercial Vehicles
- 6.3. Market Analysis, Insights and Forecast - by Sales Channel
- 6.3.1. OEM
- 6.3.2. Retrofitting
- 6.1. Market Analysis, Insights and Forecast - by Fuel Type
- 7. Europe CNG and LPG Vehicle Market Analysis, Insights and Forecast, 2019-2031
- 7.1. Market Analysis, Insights and Forecast - by Fuel Type
- 7.1.1. Compressed Natural Gas (CNG)
- 7.1.2. Liquefied Petroleum Gas (LPG)
- 7.2. Market Analysis, Insights and Forecast - by Vehicle Type
- 7.2.1. Passenger Cars
- 7.2.2. Commercial Vehicles
- 7.3. Market Analysis, Insights and Forecast - by Sales Channel
- 7.3.1. OEM
- 7.3.2. Retrofitting
- 7.1. Market Analysis, Insights and Forecast - by Fuel Type
- 8. Asia Pacific CNG and LPG Vehicle Market Analysis, Insights and Forecast, 2019-2031
- 8.1. Market Analysis, Insights and Forecast - by Fuel Type
- 8.1.1. Compressed Natural Gas (CNG)
- 8.1.2. Liquefied Petroleum Gas (LPG)
- 8.2. Market Analysis, Insights and Forecast - by Vehicle Type
- 8.2.1. Passenger Cars
- 8.2.2. Commercial Vehicles
- 8.3. Market Analysis, Insights and Forecast - by Sales Channel
- 8.3.1. OEM
- 8.3.2. Retrofitting
- 8.1. Market Analysis, Insights and Forecast - by Fuel Type
- 9. Rest of the World CNG and LPG Vehicle Market Analysis, Insights and Forecast, 2019-2031
- 9.1. Market Analysis, Insights and Forecast - by Fuel Type
- 9.1.1. Compressed Natural Gas (CNG)
- 9.1.2. Liquefied Petroleum Gas (LPG)
- 9.2. Market Analysis, Insights and Forecast - by Vehicle Type
- 9.2.1. Passenger Cars
- 9.2.2. Commercial Vehicles
- 9.3. Market Analysis, Insights and Forecast - by Sales Channel
- 9.3.1. OEM
- 9.3.2. Retrofitting
- 9.1. Market Analysis, Insights and Forecast - by Fuel Type
- 10. North America CNG and LPG Vehicle Market Analysis, Insights and Forecast, 2019-2031
- 10.1. Market Analysis, Insights and Forecast - By Country/Sub-region
- 10.1.1 United States
- 10.1.2 Canada
- 10.1.3 Rest of North America
- 11. Europe CNG and LPG Vehicle Market Analysis, Insights and Forecast, 2019-2031
- 11.1. Market Analysis, Insights and Forecast - By Country/Sub-region
- 11.1.1 Germany
- 11.1.2 United Kingdom
- 11.1.3 France
- 11.1.4 Russia
- 11.1.5 Spain
- 11.1.6 Rest of Europe
- 12. Asia Pacific CNG and LPG Vehicle Market Analysis, Insights and Forecast, 2019-2031
- 12.1. Market Analysis, Insights and Forecast - By Country/Sub-region
- 12.1.1 India
- 12.1.2 China
- 12.1.3 Japan
- 12.1.4 South Korea
- 12.1.5 Rest of Asia Pacific
- 13. Rest of the World CNG and LPG Vehicle Market Analysis, Insights and Forecast, 2019-2031
- 13.1. Market Analysis, Insights and Forecast - By Country/Sub-region
- 13.1.1 South America
- 13.1.2 Middle East and Africa
- 14. Competitive Analysis
- 14.1. Global Market Share Analysis 2024
- 14.2. Company Profiles
- 14.2.1 Nissan Motor Co Ltd
- 14.2.1.1. Overview
- 14.2.1.2. Products
- 14.2.1.3. SWOT Analysis
- 14.2.1.4. Recent Developments
- 14.2.1.5. Financials (Based on Availability)
- 14.2.2 Volkswagen AG
- 14.2.2.1. Overview
- 14.2.2.2. Products
- 14.2.2.3. SWOT Analysis
- 14.2.2.4. Recent Developments
- 14.2.2.5. Financials (Based on Availability)
- 14.2.3 Tata Motors Limited
- 14.2.3.1. Overview
- 14.2.3.2. Products
- 14.2.3.3. SWOT Analysis
- 14.2.3.4. Recent Developments
- 14.2.3.5. Financials (Based on Availability)
- 14.2.4 Honda Motor Company
- 14.2.4.1. Overview
- 14.2.4.2. Products
- 14.2.4.3. SWOT Analysis
- 14.2.4.4. Recent Developments
- 14.2.4.5. Financials (Based on Availability)
- 14.2.5 AB VOLVO
- 14.2.5.1. Overview
- 14.2.5.2. Products
- 14.2.5.3. SWOT Analysis
- 14.2.5.4. Recent Developments
- 14.2.5.5. Financials (Based on Availability)
- 14.2.6 Hyundai Motor Company
- 14.2.6.1. Overview
- 14.2.6.2. Products
- 14.2.6.3. SWOT Analysis
- 14.2.6.4. Recent Developments
- 14.2.6.5. Financials (Based on Availability)
- 14.2.7 Traton SE*List Not Exhaustive
- 14.2.7.1. Overview
- 14.2.7.2. Products
- 14.2.7.3. SWOT Analysis
- 14.2.7.4. Recent Developments
- 14.2.7.5. Financials (Based on Availability)
- 14.2.8 Suzuki Motor Corporation
- 14.2.8.1. Overview
- 14.2.8.2. Products
- 14.2.8.3. SWOT Analysis
- 14.2.8.4. Recent Developments
- 14.2.8.5. Financials (Based on Availability)
- 14.2.9 IVECO SpA
- 14.2.9.1. Overview
- 14.2.9.2. Products
- 14.2.9.3. SWOT Analysis
- 14.2.9.4. Recent Developments
- 14.2.9.5. Financials (Based on Availability)
- 14.2.10 Ford Motor Company
- 14.2.10.1. Overview
- 14.2.10.2. Products
- 14.2.10.3. SWOT Analysis
- 14.2.10.4. Recent Developments
- 14.2.10.5. Financials (Based on Availability)
- 14.2.1 Nissan Motor Co Ltd
List of Figures
- Figure 1: Global CNG and LPG Vehicle Market Revenue Breakdown (Million, %) by Region 2024 & 2032
- Figure 2: North America CNG and LPG Vehicle Market Revenue (Million), by Country 2024 & 2032
- Figure 3: North America CNG and LPG Vehicle Market Revenue Share (%), by Country 2024 & 2032
- Figure 4: Europe CNG and LPG Vehicle Market Revenue (Million), by Country 2024 & 2032
- Figure 5: Europe CNG and LPG Vehicle Market Revenue Share (%), by Country 2024 & 2032
- Figure 6: Asia Pacific CNG and LPG Vehicle Market Revenue (Million), by Country 2024 & 2032
- Figure 7: Asia Pacific CNG and LPG Vehicle Market Revenue Share (%), by Country 2024 & 2032
- Figure 8: Rest of the World CNG and LPG Vehicle Market Revenue (Million), by Country 2024 & 2032
- Figure 9: Rest of the World CNG and LPG Vehicle Market Revenue Share (%), by Country 2024 & 2032
- Figure 10: North America CNG and LPG Vehicle Market Revenue (Million), by Fuel Type 2024 & 2032
- Figure 11: North America CNG and LPG Vehicle Market Revenue Share (%), by Fuel Type 2024 & 2032
- Figure 12: North America CNG and LPG Vehicle Market Revenue (Million), by Vehicle Type 2024 & 2032
- Figure 13: North America CNG and LPG Vehicle Market Revenue Share (%), by Vehicle Type 2024 & 2032
- Figure 14: North America CNG and LPG Vehicle Market Revenue (Million), by Sales Channel 2024 & 2032
- Figure 15: North America CNG and LPG Vehicle Market Revenue Share (%), by Sales Channel 2024 & 2032
- Figure 16: North America CNG and LPG Vehicle Market Revenue (Million), by Country 2024 & 2032
- Figure 17: North America CNG and LPG Vehicle Market Revenue Share (%), by Country 2024 & 2032
- Figure 18: Europe CNG and LPG Vehicle Market Revenue (Million), by Fuel Type 2024 & 2032
- Figure 19: Europe CNG and LPG Vehicle Market Revenue Share (%), by Fuel Type 2024 & 2032
- Figure 20: Europe CNG and LPG Vehicle Market Revenue (Million), by Vehicle Type 2024 & 2032
- Figure 21: Europe CNG and LPG Vehicle Market Revenue Share (%), by Vehicle Type 2024 & 2032
- Figure 22: Europe CNG and LPG Vehicle Market Revenue (Million), by Sales Channel 2024 & 2032
- Figure 23: Europe CNG and LPG Vehicle Market Revenue Share (%), by Sales Channel 2024 & 2032
- Figure 24: Europe CNG and LPG Vehicle Market Revenue (Million), by Country 2024 & 2032
- Figure 25: Europe CNG and LPG Vehicle Market Revenue Share (%), by Country 2024 & 2032
- Figure 26: Asia Pacific CNG and LPG Vehicle Market Revenue (Million), by Fuel Type 2024 & 2032
- Figure 27: Asia Pacific CNG and LPG Vehicle Market Revenue Share (%), by Fuel Type 2024 & 2032
- Figure 28: Asia Pacific CNG and LPG Vehicle Market Revenue (Million), by Vehicle Type 2024 & 2032
- Figure 29: Asia Pacific CNG and LPG Vehicle Market Revenue Share (%), by Vehicle Type 2024 & 2032
- Figure 30: Asia Pacific CNG and LPG Vehicle Market Revenue (Million), by Sales Channel 2024 & 2032
- Figure 31: Asia Pacific CNG and LPG Vehicle Market Revenue Share (%), by Sales Channel 2024 & 2032
- Figure 32: Asia Pacific CNG and LPG Vehicle Market Revenue (Million), by Country 2024 & 2032
- Figure 33: Asia Pacific CNG and LPG Vehicle Market Revenue Share (%), by Country 2024 & 2032
- Figure 34: Rest of the World CNG and LPG Vehicle Market Revenue (Million), by Fuel Type 2024 & 2032
- Figure 35: Rest of the World CNG and LPG Vehicle Market Revenue Share (%), by Fuel Type 2024 & 2032
- Figure 36: Rest of the World CNG and LPG Vehicle Market Revenue (Million), by Vehicle Type 2024 & 2032
- Figure 37: Rest of the World CNG and LPG Vehicle Market Revenue Share (%), by Vehicle Type 2024 & 2032
- Figure 38: Rest of the World CNG and LPG Vehicle Market Revenue (Million), by Sales Channel 2024 & 2032
- Figure 39: Rest of the World CNG and LPG Vehicle Market Revenue Share (%), by Sales Channel 2024 & 2032
- Figure 40: Rest of the World CNG and LPG Vehicle Market Revenue (Million), by Country 2024 & 2032
- Figure 41: Rest of the World CNG and LPG Vehicle Market Revenue Share (%), by Country 2024 & 2032
List of Tables
- Table 1: Global CNG and LPG Vehicle Market Revenue Million Forecast, by Region 2019 & 2032
- Table 2: Global CNG and LPG Vehicle Market Revenue Million Forecast, by Fuel Type 2019 & 2032
- Table 3: Global CNG and LPG Vehicle Market Revenue Million Forecast, by Vehicle Type 2019 & 2032
- Table 4: Global CNG and LPG Vehicle Market Revenue Million Forecast, by Sales Channel 2019 & 2032
- Table 5: Global CNG and LPG Vehicle Market Revenue Million Forecast, by Region 2019 & 2032
- Table 6: Global CNG and LPG Vehicle Market Revenue Million Forecast, by Country 2019 & 2032
- Table 7: United States CNG and LPG Vehicle Market Revenue (Million) Forecast, by Application 2019 & 2032
- Table 8: Canada CNG and LPG Vehicle Market Revenue (Million) Forecast, by Application 2019 & 2032
- Table 9: Rest of North America CNG and LPG Vehicle Market Revenue (Million) Forecast, by Application 2019 & 2032
- Table 10: Global CNG and LPG Vehicle Market Revenue Million Forecast, by Country 2019 & 2032
- Table 11: Germany CNG and LPG Vehicle Market Revenue (Million) Forecast, by Application 2019 & 2032
- Table 12: United Kingdom CNG and LPG Vehicle Market Revenue (Million) Forecast, by Application 2019 & 2032
- Table 13: France CNG and LPG Vehicle Market Revenue (Million) Forecast, by Application 2019 & 2032
- Table 14: Russia CNG and LPG Vehicle Market Revenue (Million) Forecast, by Application 2019 & 2032
- Table 15: Spain CNG and LPG Vehicle Market Revenue (Million) Forecast, by Application 2019 & 2032
- Table 16: Rest of Europe CNG and LPG Vehicle Market Revenue (Million) Forecast, by Application 2019 & 2032
- Table 17: Global CNG and LPG Vehicle Market Revenue Million Forecast, by Country 2019 & 2032
- Table 18: India CNG and LPG Vehicle Market Revenue (Million) Forecast, by Application 2019 & 2032
- Table 19: China CNG and LPG Vehicle Market Revenue (Million) Forecast, by Application 2019 & 2032
- Table 20: Japan CNG and LPG Vehicle Market Revenue (Million) Forecast, by Application 2019 & 2032
- Table 21: South Korea CNG and LPG Vehicle Market Revenue (Million) Forecast, by Application 2019 & 2032
- Table 22: Rest of Asia Pacific CNG and LPG Vehicle Market Revenue (Million) Forecast, by Application 2019 & 2032
- Table 23: Global CNG and LPG Vehicle Market Revenue Million Forecast, by Country 2019 & 2032
- Table 24: South America CNG and LPG Vehicle Market Revenue (Million) Forecast, by Application 2019 & 2032
- Table 25: Middle East and Africa CNG and LPG Vehicle Market Revenue (Million) Forecast, by Application 2019 & 2032
- Table 26: Global CNG and LPG Vehicle Market Revenue Million Forecast, by Fuel Type 2019 & 2032
- Table 27: Global CNG and LPG Vehicle Market Revenue Million Forecast, by Vehicle Type 2019 & 2032
- Table 28: Global CNG and LPG Vehicle Market Revenue Million Forecast, by Sales Channel 2019 & 2032
- Table 29: Global CNG and LPG Vehicle Market Revenue Million Forecast, by Country 2019 & 2032
- Table 30: United States CNG and LPG Vehicle Market Revenue (Million) Forecast, by Application 2019 & 2032
- Table 31: Canada CNG and LPG Vehicle Market Revenue (Million) Forecast, by Application 2019 & 2032
- Table 32: Rest of North America CNG and LPG Vehicle Market Revenue (Million) Forecast, by Application 2019 & 2032
- Table 33: Global CNG and LPG Vehicle Market Revenue Million Forecast, by Fuel Type 2019 & 2032
- Table 34: Global CNG and LPG Vehicle Market Revenue Million Forecast, by Vehicle Type 2019 & 2032
- Table 35: Global CNG and LPG Vehicle Market Revenue Million Forecast, by Sales Channel 2019 & 2032
- Table 36: Global CNG and LPG Vehicle Market Revenue Million Forecast, by Country 2019 & 2032
- Table 37: Germany CNG and LPG Vehicle Market Revenue (Million) Forecast, by Application 2019 & 2032
- Table 38: United Kingdom CNG and LPG Vehicle Market Revenue (Million) Forecast, by Application 2019 & 2032
- Table 39: France CNG and LPG Vehicle Market Revenue (Million) Forecast, by Application 2019 & 2032
- Table 40: Italy CNG and LPG Vehicle Market Revenue (Million) Forecast, by Application 2019 & 2032
- Table 41: Spain CNG and LPG Vehicle Market Revenue (Million) Forecast, by Application 2019 & 2032
- Table 42: Rest of Europe CNG and LPG Vehicle Market Revenue (Million) Forecast, by Application 2019 & 2032
- Table 43: Global CNG and LPG Vehicle Market Revenue Million Forecast, by Fuel Type 2019 & 2032
- Table 44: Global CNG and LPG Vehicle Market Revenue Million Forecast, by Vehicle Type 2019 & 2032
- Table 45: Global CNG and LPG Vehicle Market Revenue Million Forecast, by Sales Channel 2019 & 2032
- Table 46: Global CNG and LPG Vehicle Market Revenue Million Forecast, by Country 2019 & 2032
- Table 47: India CNG and LPG Vehicle Market Revenue (Million) Forecast, by Application 2019 & 2032
- Table 48: China CNG and LPG Vehicle Market Revenue (Million) Forecast, by Application 2019 & 2032
- Table 49: Japan CNG and LPG Vehicle Market Revenue (Million) Forecast, by Application 2019 & 2032
- Table 50: South Korea CNG and LPG Vehicle Market Revenue (Million) Forecast, by Application 2019 & 2032
- Table 51: Rest of Asia Pacific CNG and LPG Vehicle Market Revenue (Million) Forecast, by Application 2019 & 2032
- Table 52: Global CNG and LPG Vehicle Market Revenue Million Forecast, by Fuel Type 2019 & 2032
- Table 53: Global CNG and LPG Vehicle Market Revenue Million Forecast, by Vehicle Type 2019 & 2032
- Table 54: Global CNG and LPG Vehicle Market Revenue Million Forecast, by Sales Channel 2019 & 2032
- Table 55: Global CNG and LPG Vehicle Market Revenue Million Forecast, by Country 2019 & 2032
- Table 56: South America CNG and LPG Vehicle Market Revenue (Million) Forecast, by Application 2019 & 2032
- Table 57: Middle East and Africa CNG and LPG Vehicle Market Revenue (Million) Forecast, by Application 2019 & 2032
Frequently Asked Questions
1. What is the projected Compound Annual Growth Rate (CAGR) of the CNG and LPG Vehicle Market?
The projected CAGR is approximately 7.00%.
2. Which companies are prominent players in the CNG and LPG Vehicle Market?
Key companies in the market include Nissan Motor Co Ltd, Volkswagen AG, Tata Motors Limited, Honda Motor Company, AB VOLVO, Hyundai Motor Company, Traton SE*List Not Exhaustive, Suzuki Motor Corporation, IVECO SpA, Ford Motor Company.
3. What are the main segments of the CNG and LPG Vehicle Market?
The market segments include Fuel Type, Vehicle Type, Sales Channel.
4. Can you provide details about the market size?
The market size is estimated to be USD 6.73 Million as of 2022.
5. What are some drivers contributing to market growth?
Increase in Demand for Clean Energy Driving the Market.
6. What are the notable trends driving market growth?
Commercial Vehicles Fueling the Demand for CNG and LPG Vehicle.
7. Are there any restraints impacting market growth?
Rising Safety Concerns is Antcipated to Restrain the Market.
8. Can you provide examples of recent developments in the market?
November 2023: The government of India committed to significantly expanding the network of CNG stations, setting an ambitious target to increase the count from 6,000 to 17,700 by 2030. In October, this initiative gained further momentum with the launch of the 12th City Gas Distribution (CGD) bidding round. This strategic move is aimed at closing the gaps in the existing gas infrastructure, a step that is expected to substantially drive the growth of the CNG vehicle market.
9. What pricing options are available for accessing the report?
Pricing options include single-user, multi-user, and enterprise licenses priced at USD 4750, USD 5250, and USD 8750 respectively.
10. Is the market size provided in terms of value or volume?
The market size is provided in terms of value, measured in Million.
11. Are there any specific market keywords associated with the report?
Yes, the market keyword associated with the report is "CNG and LPG Vehicle Market," which aids in identifying and referencing the specific market segment covered.
12. How do I determine which pricing option suits my needs best?
The pricing options vary based on user requirements and access needs. Individual users may opt for single-user licenses, while businesses requiring broader access may choose multi-user or enterprise licenses for cost-effective access to the report.
13. Are there any additional resources or data provided in the CNG and LPG Vehicle Market report?
While the report offers comprehensive insights, it's advisable to review the specific contents or supplementary materials provided to ascertain if additional resources or data are available.
14. How can I stay updated on further developments or reports in the CNG and LPG Vehicle Market?
To stay informed about further developments, trends, and reports in the CNG and LPG Vehicle Market, consider subscribing to industry newsletters, following relevant companies and organizations, or regularly checking reputable industry news sources and publications.
Methodology
Step 1 - Identification of Relevant Samples Size from Population Database


Step 2 - Approaches for Defining Global Market Size (Value, Volume* & Price*)

Note*: In applicable scenarios
Step 3 - Data Sources
Primary Research
- Web Analytics
- Survey Reports
- Research Institute
- Latest Research Reports
- Opinion Leaders
Secondary Research
- Annual Reports
- White Paper
- Latest Press Release
- Industry Association
- Paid Database
- Investor Presentations

Step 4 - Data Triangulation
Involves using different sources of information in order to increase the validity of a study
These sources are likely to be stakeholders in a program - participants, other researchers, program staff, other community members, and so on.
Then we put all data in single framework & apply various statistical tools to find out the dynamic on the market.
During the analysis stage, feedback from the stakeholder groups would be compared to determine areas of agreement as well as areas of divergence


