
Key Insights
The global cannabidiol (CBD) oil market is experiencing robust growth, projected to reach a substantial size driven by increasing consumer awareness of CBD's potential health benefits and the expanding legalization of cannabis and hemp-derived products. The market's 16.50% CAGR from 2019-2024 indicates significant momentum. This growth is fueled by rising demand across various applications, including treatment of multiple sclerosis, depression and sleep disorders, and neurological pain. The market is segmented into marijuana-based and hemp-based CBD oils, with hemp-based CBD oil currently dominating due to its legal accessibility in more regions. North America and Europe are currently leading the market, although the Asia-Pacific region is poised for rapid expansion in the coming years driven by increasing awareness and acceptance of alternative therapies. While regulatory hurdles and inconsistent regulations across different countries remain a constraint, the overall positive trend in consumer acceptance and ongoing research into CBD's therapeutic properties are expected to drive continued market expansion. Major players are actively investing in research and development, product innovation, and expansion into new markets, further shaping the industry's trajectory. The forecast period of 2025-2033 anticipates continued growth, particularly in applications beyond the currently established therapeutic segments. The increase in consumer demand is driving the development of innovative product formulations such as CBD edibles, topical creams, and beauty products, broadening the overall market.
The competitive landscape features both established companies and new entrants, leading to increased market competitiveness. Successful companies are focusing on building brand recognition, ensuring product quality and safety, and educating consumers on CBD's potential benefits and responsible usage. The increasing availability of high-quality, third-party tested CBD products is also contributing to greater consumer trust and market expansion. The future of the CBD oil market hinges on continued scientific research validating its therapeutic claims, the establishment of clear and consistent regulatory frameworks across nations, and ongoing innovation within the industry. This dynamic environment offers both significant opportunities and challenges for companies operating in this rapidly evolving sector.
Cannabidiol Oil Industry: A Comprehensive Market Report (2019-2033)
This comprehensive report provides an in-depth analysis of the Cannabidiol (CBD) oil industry, encompassing market size, growth projections, competitive landscape, and key trends from 2019 to 2033. The study period covers the historical period (2019-2024), the base year (2025), and the forecast period (2025-2033), with an estimated year of 2025. The report is essential for businesses, investors, and researchers seeking a thorough understanding of this rapidly evolving market. The global CBD oil market is projected to reach xx Million by 2033, demonstrating significant growth potential.
Cannabidiol Oil Industry Market Structure & Competitive Dynamics
The CBD oil market exhibits a dynamic competitive landscape, characterized by a mix of large multinational corporations and smaller, specialized companies. Market concentration is moderate, with a few key players holding significant market share, while numerous smaller firms compete in niche segments. The industry's innovation ecosystem is robust, driven by ongoing research into CBD's therapeutic properties and the development of new product formulations. Regulatory frameworks vary significantly across different regions, creating both opportunities and challenges. Product substitutes include traditional pharmaceuticals and other natural remedies, although CBD oil's unique properties offer a distinct advantage for specific applications. End-user trends show a growing preference for high-quality, organically sourced CBD oil products, reflecting an increasing consumer awareness of product purity and efficacy. Mergers and acquisitions (M&A) activities are frequent, reflecting the industry's consolidation trend. For instance, while precise M&A deal values are not publicly available for all transactions, some deals have involved hundreds of Millions of dollars, demonstrating significant investment in the sector. Key players such as Aurora Cannabis and Canopy Growth Corporation have significantly impacted the market through strategic acquisitions.
- Market Share: The top 5 companies account for approximately xx% of the global market share in 2025.
- M&A Activity: The number of M&A deals in the CBD oil industry increased by xx% between 2021 and 2022.
- Regulatory Landscape: Variations in regulations across jurisdictions create significant complexities for market expansion.
Cannabidiol Oil Industry Trends & Insights
The CBD oil market is experiencing exponential growth, driven by increasing consumer awareness of CBD's potential health benefits, expanding legal frameworks, and technological advancements in extraction and purification methods. The Compound Annual Growth Rate (CAGR) is estimated at xx% during the forecast period (2025-2033), indicating robust market expansion. Market penetration is currently relatively low in several regions, suggesting a significant untapped market potential. Technological disruptions, such as advancements in nanotechnology for enhanced bioavailability and personalized medicine approaches, are shaping the future of the industry. Consumer preferences are increasingly focused on transparency, sustainability, and third-party testing for product quality assurance. Competitive dynamics are intensified by the entrance of new players and increased product differentiation strategies.
Dominant Markets & Segments in Cannabidiol Oil Industry
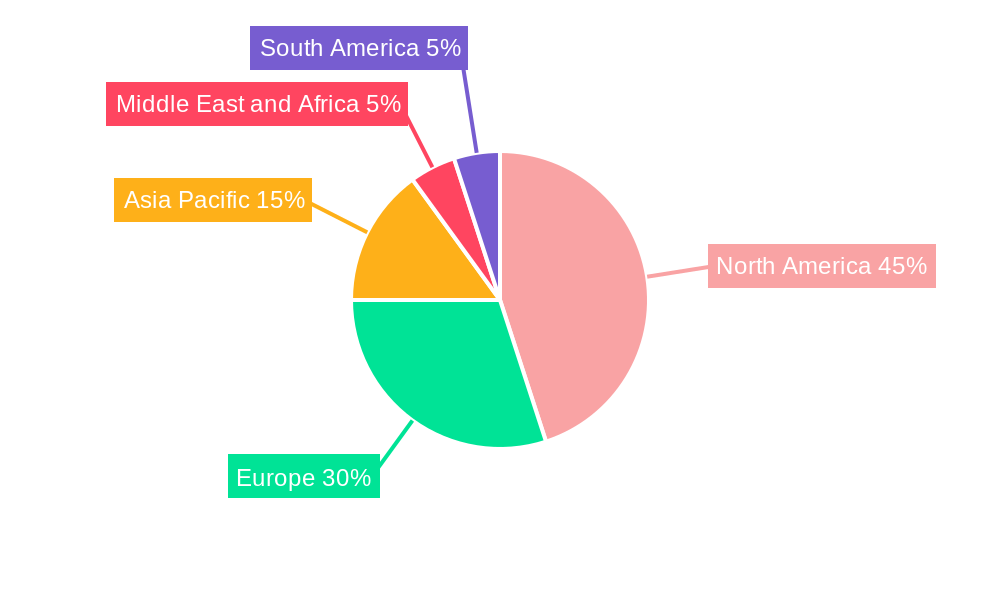
The North American market, particularly the United States, currently dominates the global CBD oil market due to factors such as early adoption of legalization, robust consumer demand, and a well-established distribution infrastructure. The hemp-based segment holds the largest market share due to its legal accessibility in many regions compared to marijuana-based CBD. Within applications, the neurological pain segment is showing significant growth due to the increasing awareness of CBD's potential analgesic properties.
Key Drivers for North American Dominance:
- Early legalization and regulatory changes
- High consumer awareness and acceptance
- Well-established distribution networks
- Significant investment in research and development.
Dominant Product Segment: Hemp-based CBD oil accounts for xx% of the market in 2025.
Dominant Application Segment: Neurological pain applications represent xx% of the market in 2025.
Cannabidiol Oil Industry Product Innovations
Recent innovations in the CBD oil industry focus on enhanced product formulations, including nano-emulsions for improved bioavailability, water-soluble CBD for easier consumption, and customized blends targeting specific health concerns. Technological advancements in extraction methods lead to higher purity and yield, while the development of new delivery systems (e.g., sublingual sprays, topical creams) enhances user experience and convenience. These innovations address market demand for efficacy, convenience, and diverse product offerings.
Report Segmentation & Scope
This report segments the CBD oil market based on product type (Marijuana-based and Hemp-based) and application (Multiple Sclerosis, Depression and Sleep Disorders, Neurological Pain, and Other Applications). Each segment’s market size, growth projections, and competitive dynamics are analyzed. The Hemp-based segment is projected to experience faster growth than the Marijuana-based segment due to varying legal restrictions. The Neurological Pain application segment shows strong growth potential driven by increased consumer interest in natural pain management solutions. Other applications, encompassing areas such as skincare and pet care, are also exhibiting significant growth and expanding the market's overall scope.
Key Drivers of Cannabidiol Oil Industry Growth
The key drivers of CBD oil industry growth are increasing consumer awareness of potential health benefits, expanding legal frameworks, technological advancements leading to better product quality and delivery methods, and growing investments in research and development. The increasing acceptance of CBD as a natural remedy for various ailments fuels market expansion. Relaxed regulatory environments in some regions further stimulate industry growth.
Challenges in the Cannabidiol Oil Industry Sector
Challenges facing the CBD oil industry include inconsistencies in regulatory frameworks across different jurisdictions, supply chain complexities, and intense competition. The lack of standardized regulations can lead to quality control issues and limit market accessibility. Supply chain challenges include ensuring consistent sourcing of high-quality hemp and managing the complexities of international trade. Fierce competition among established and emerging players necessitates continuous innovation and strategic differentiation to maintain market share. These factors could collectively impact market growth by xx Million by 2033.
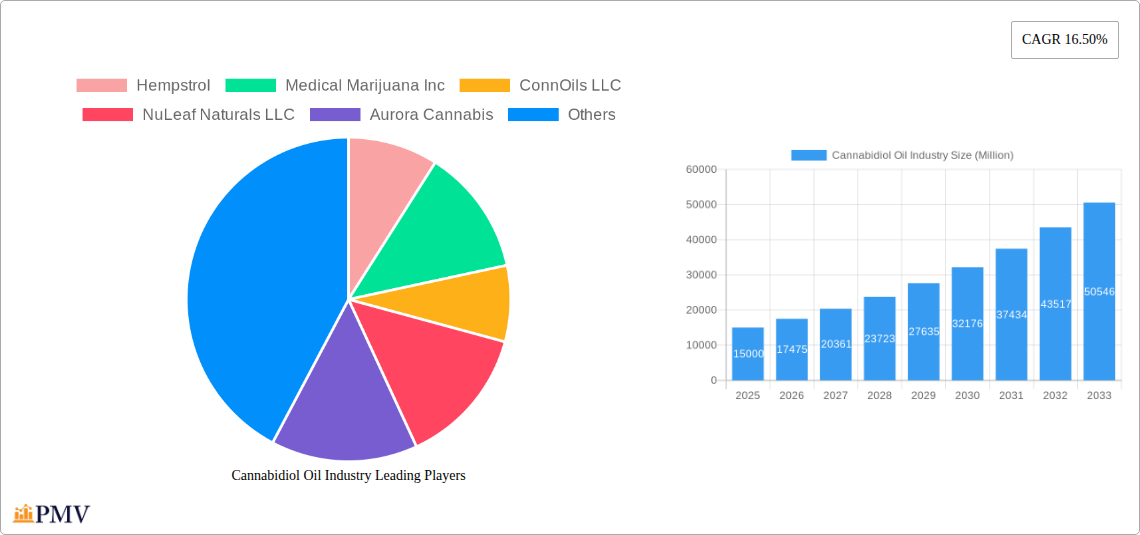
Leading Players in the Cannabidiol Oil Industry Market
- Hempstrol
- Medical Marijuana Inc
- ConnOils LLC
- NuLeaf Naturals LLC
- Aurora Cannabis
- Canopy Growth Corporation
- Elixinol
- CV Sciences Inc
- IRIE CBD
- ENDOCA
- CBD American Shaman
- Gaia Herbs
Key Developments in Cannabidiol Oil Industry Sector
- October 2022: Charlotte's Web Holdings, Inc., partnered with GoPuff for distribution in Arizona, Illinois, California, and New York, expanding its reach and market share.
- May 2022: Medical Marijuana, Inc. launched HM Pharma in Brazil, significantly expanding its international market presence.
Strategic Cannabidiol Oil Industry Market Outlook
The future of the CBD oil industry appears bright, with continued growth fueled by increasing consumer acceptance, further legal approvals, and ongoing scientific research validating CBD's therapeutic properties. Strategic opportunities lie in expanding into new markets, developing innovative product formulations, and leveraging technological advancements to improve product quality and efficacy. Companies that prioritize transparency, quality control, and sustainable practices will be well-positioned to succeed in this rapidly evolving market.
Cannabidiol Oil Industry Segmentation
-
1. Product
- 1.1. Marijuana Based
- 1.2. Hemp Based
-
2. Application
- 2.1. Multiple Sclerosis
- 2.2. Depression and Sleep Disorders
- 2.3. Neurological Pain
- 2.4. Other Applications
Cannabidiol Oil Industry Segmentation By Geography
-
1. North America
- 1.1. United States
- 1.2. Canada
- 1.3. Mexico
-
2. Europe
- 2.1. Germany
- 2.2. United Kingdom
- 2.3. France
- 2.4. Italy
- 2.5. Spain
- 2.6. Rest of Europe
-
3. Asia Pacific
- 3.1. China
- 3.2. Japan
- 3.3. India
- 3.4. Australia
- 3.5. South Korea
- 3.6. Rest of Asia Pacific
-
4. Middle East and Africa
- 4.1. GCC
- 4.2. South Africa
- 4.3. Rest of Middle East and Africa
-
5. South America
- 5.1. Brazil
- 5.2. Argentina
- 5.3. Rest of South America
Cannabidiol Oil Industry REPORT HIGHLIGHTS
| Aspects | Details |
|---|---|
| Study Period | 2019-2033 |
| Base Year | 2024 |
| Estimated Year | 2025 |
| Forecast Period | 2025-2033 |
| Historical Period | 2019-2024 |
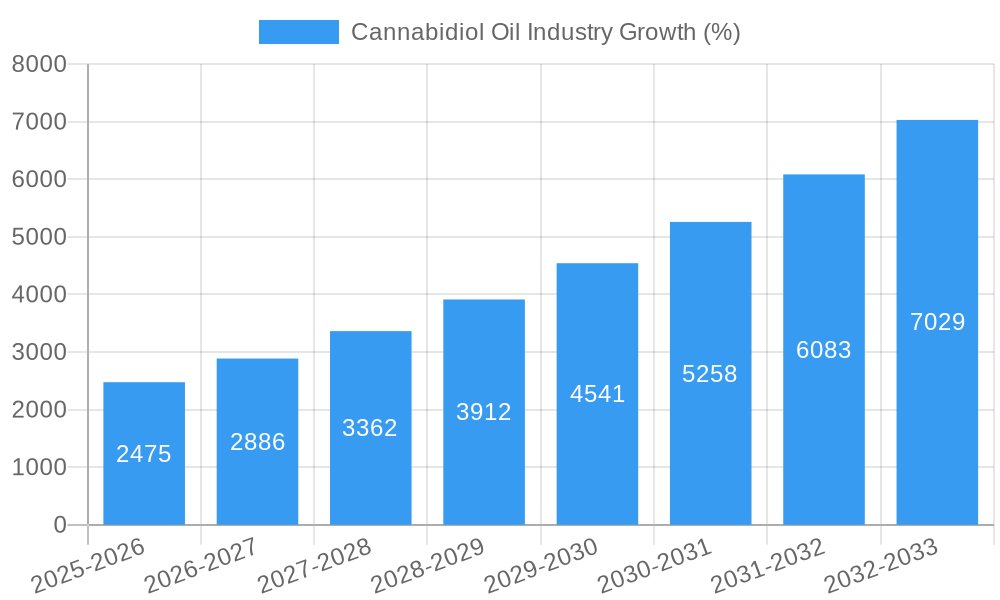
| Growth Rate | CAGR of 16.50% from 2019-2033 |
| Segmentation |
|
Table of Contents
- 1. Introduction
- 1.1. Research Scope
- 1.2. Market Segmentation
- 1.3. Research Methodology
- 1.4. Definitions and Assumptions
- 2. Executive Summary
- 2.1. Introduction
- 3. Market Dynamics
- 3.1. Introduction
- 3.2. Market Drivers
- 3.2.1. Growing Incidence of Psychological Disorders; Rise in Acceptance of CBD Oil Based Products
- 3.3. Market Restrains
- 3.3.1. Stringent Regulatory Policies for Marketing; Side Effects and Negative Perception of People on Use of CBD Oil
- 3.4. Market Trends
- 3.4.1. Neurological Pain Segment is Expected to Hold a Significant Share in the Cannabidiol (CBD) Oil Market Over the Forecast Period
- 4. Market Factor Analysis
- 4.1. Porters Five Forces
- 4.2. Supply/Value Chain
- 4.3. PESTEL analysis
- 4.4. Market Entropy
- 4.5. Patent/Trademark Analysis
- 5. Global Cannabidiol Oil Industry Analysis, Insights and Forecast, 2019-2031
- 5.1. Market Analysis, Insights and Forecast - by Product
- 5.1.1. Marijuana Based
- 5.1.2. Hemp Based
- 5.2. Market Analysis, Insights and Forecast - by Application
- 5.2.1. Multiple Sclerosis
- 5.2.2. Depression and Sleep Disorders
- 5.2.3. Neurological Pain
- 5.2.4. Other Applications
- 5.3. Market Analysis, Insights and Forecast - by Region
- 5.3.1. North America
- 5.3.2. Europe
- 5.3.3. Asia Pacific
- 5.3.4. Middle East and Africa
- 5.3.5. South America
- 5.1. Market Analysis, Insights and Forecast - by Product
- 6. North America Cannabidiol Oil Industry Analysis, Insights and Forecast, 2019-2031
- 6.1. Market Analysis, Insights and Forecast - by Product
- 6.1.1. Marijuana Based
- 6.1.2. Hemp Based
- 6.2. Market Analysis, Insights and Forecast - by Application
- 6.2.1. Multiple Sclerosis
- 6.2.2. Depression and Sleep Disorders
- 6.2.3. Neurological Pain
- 6.2.4. Other Applications
- 6.1. Market Analysis, Insights and Forecast - by Product
- 7. Europe Cannabidiol Oil Industry Analysis, Insights and Forecast, 2019-2031
- 7.1. Market Analysis, Insights and Forecast - by Product
- 7.1.1. Marijuana Based
- 7.1.2. Hemp Based
- 7.2. Market Analysis, Insights and Forecast - by Application
- 7.2.1. Multiple Sclerosis
- 7.2.2. Depression and Sleep Disorders
- 7.2.3. Neurological Pain
- 7.2.4. Other Applications
- 7.1. Market Analysis, Insights and Forecast - by Product
- 8. Asia Pacific Cannabidiol Oil Industry Analysis, Insights and Forecast, 2019-2031
- 8.1. Market Analysis, Insights and Forecast - by Product
- 8.1.1. Marijuana Based
- 8.1.2. Hemp Based
- 8.2. Market Analysis, Insights and Forecast - by Application
- 8.2.1. Multiple Sclerosis
- 8.2.2. Depression and Sleep Disorders
- 8.2.3. Neurological Pain
- 8.2.4. Other Applications
- 8.1. Market Analysis, Insights and Forecast - by Product
- 9. Middle East and Africa Cannabidiol Oil Industry Analysis, Insights and Forecast, 2019-2031
- 9.1. Market Analysis, Insights and Forecast - by Product
- 9.1.1. Marijuana Based
- 9.1.2. Hemp Based
- 9.2. Market Analysis, Insights and Forecast - by Application
- 9.2.1. Multiple Sclerosis
- 9.2.2. Depression and Sleep Disorders
- 9.2.3. Neurological Pain
- 9.2.4. Other Applications
- 9.1. Market Analysis, Insights and Forecast - by Product
- 10. South America Cannabidiol Oil Industry Analysis, Insights and Forecast, 2019-2031
- 10.1. Market Analysis, Insights and Forecast - by Product
- 10.1.1. Marijuana Based
- 10.1.2. Hemp Based
- 10.2. Market Analysis, Insights and Forecast - by Application
- 10.2.1. Multiple Sclerosis
- 10.2.2. Depression and Sleep Disorders
- 10.2.3. Neurological Pain
- 10.2.4. Other Applications
- 10.1. Market Analysis, Insights and Forecast - by Product
- 11. North America Cannabidiol Oil Industry Analysis, Insights and Forecast, 2019-2031
- 11.1. Market Analysis, Insights and Forecast - By Country/Sub-region
- 11.1.1. undefined
- 12. Europe Cannabidiol Oil Industry Analysis, Insights and Forecast, 2019-2031
- 12.1. Market Analysis, Insights and Forecast - By Country/Sub-region
- 12.1.1. undefined
- 13. Asia Pacific Cannabidiol Oil Industry Analysis, Insights and Forecast, 2019-2031
- 13.1. Market Analysis, Insights and Forecast - By Country/Sub-region
- 13.1.1. undefined
- 14. Middle East and Africa Cannabidiol Oil Industry Analysis, Insights and Forecast, 2019-2031
- 14.1. Market Analysis, Insights and Forecast - By Country/Sub-region
- 14.1.1. undefined
- 15. South America Cannabidiol Oil Industry Analysis, Insights and Forecast, 2019-2031
- 15.1. Market Analysis, Insights and Forecast - By Country/Sub-region
- 15.1.1. undefined
- 16. Competitive Analysis
- 16.1. Global Market Share Analysis 2024
- 16.2. Company Profiles
- 16.2.1 Hempstrol
- 16.2.1.1. Overview
- 16.2.1.2. Products
- 16.2.1.3. SWOT Analysis
- 16.2.1.4. Recent Developments
- 16.2.1.5. Financials (Based on Availability)
- 16.2.2 Medical Marijuana Inc
- 16.2.2.1. Overview
- 16.2.2.2. Products
- 16.2.2.3. SWOT Analysis
- 16.2.2.4. Recent Developments
- 16.2.2.5. Financials (Based on Availability)
- 16.2.3 ConnOils LLC
- 16.2.3.1. Overview
- 16.2.3.2. Products
- 16.2.3.3. SWOT Analysis
- 16.2.3.4. Recent Developments
- 16.2.3.5. Financials (Based on Availability)
- 16.2.4 NuLeaf Naturals LLC
- 16.2.4.1. Overview
- 16.2.4.2. Products
- 16.2.4.3. SWOT Analysis
- 16.2.4.4. Recent Developments
- 16.2.4.5. Financials (Based on Availability)
- 16.2.5 Aurora Cannabis
- 16.2.5.1. Overview
- 16.2.5.2. Products
- 16.2.5.3. SWOT Analysis
- 16.2.5.4. Recent Developments
- 16.2.5.5. Financials (Based on Availability)
- 16.2.6 Canopy Growth Corporation
- 16.2.6.1. Overview
- 16.2.6.2. Products
- 16.2.6.3. SWOT Analysis
- 16.2.6.4. Recent Developments
- 16.2.6.5. Financials (Based on Availability)
- 16.2.7 Elixinol
- 16.2.7.1. Overview
- 16.2.7.2. Products
- 16.2.7.3. SWOT Analysis
- 16.2.7.4. Recent Developments
- 16.2.7.5. Financials (Based on Availability)
- 16.2.8 CV Sciences Inc
- 16.2.8.1. Overview
- 16.2.8.2. Products
- 16.2.8.3. SWOT Analysis
- 16.2.8.4. Recent Developments
- 16.2.8.5. Financials (Based on Availability)
- 16.2.9 IRIE CBD
- 16.2.9.1. Overview
- 16.2.9.2. Products
- 16.2.9.3. SWOT Analysis
- 16.2.9.4. Recent Developments
- 16.2.9.5. Financials (Based on Availability)
- 16.2.10 ENDOCA
- 16.2.10.1. Overview
- 16.2.10.2. Products
- 16.2.10.3. SWOT Analysis
- 16.2.10.4. Recent Developments
- 16.2.10.5. Financials (Based on Availability)
- 16.2.11 CBD American Shaman
- 16.2.11.1. Overview
- 16.2.11.2. Products
- 16.2.11.3. SWOT Analysis
- 16.2.11.4. Recent Developments
- 16.2.11.5. Financials (Based on Availability)
- 16.2.12 Gaia Herbs
- 16.2.12.1. Overview
- 16.2.12.2. Products
- 16.2.12.3. SWOT Analysis
- 16.2.12.4. Recent Developments
- 16.2.12.5. Financials (Based on Availability)
- 16.2.1 Hempstrol
List of Figures
- Figure 1: Global Cannabidiol Oil Industry Revenue Breakdown (Million, %) by Region 2024 & 2032
- Figure 2: Global Cannabidiol Oil Industry Volume Breakdown (K unit, %) by Region 2024 & 2032
- Figure 3: North America Cannabidiol Oil Industry Revenue (Million), by Country 2024 & 2032
- Figure 4: North America Cannabidiol Oil Industry Volume (K unit), by Country 2024 & 2032
- Figure 5: North America Cannabidiol Oil Industry Revenue Share (%), by Country 2024 & 2032
- Figure 6: North America Cannabidiol Oil Industry Volume Share (%), by Country 2024 & 2032
- Figure 7: Europe Cannabidiol Oil Industry Revenue (Million), by Country 2024 & 2032
- Figure 8: Europe Cannabidiol Oil Industry Volume (K unit), by Country 2024 & 2032
- Figure 9: Europe Cannabidiol Oil Industry Revenue Share (%), by Country 2024 & 2032
- Figure 10: Europe Cannabidiol Oil Industry Volume Share (%), by Country 2024 & 2032
- Figure 11: Asia Pacific Cannabidiol Oil Industry Revenue (Million), by Country 2024 & 2032
- Figure 12: Asia Pacific Cannabidiol Oil Industry Volume (K unit), by Country 2024 & 2032
- Figure 13: Asia Pacific Cannabidiol Oil Industry Revenue Share (%), by Country 2024 & 2032
- Figure 14: Asia Pacific Cannabidiol Oil Industry Volume Share (%), by Country 2024 & 2032
- Figure 15: Middle East and Africa Cannabidiol Oil Industry Revenue (Million), by Country 2024 & 2032
- Figure 16: Middle East and Africa Cannabidiol Oil Industry Volume (K unit), by Country 2024 & 2032
- Figure 17: Middle East and Africa Cannabidiol Oil Industry Revenue Share (%), by Country 2024 & 2032
- Figure 18: Middle East and Africa Cannabidiol Oil Industry Volume Share (%), by Country 2024 & 2032
- Figure 19: South America Cannabidiol Oil Industry Revenue (Million), by Country 2024 & 2032
- Figure 20: South America Cannabidiol Oil Industry Volume (K unit), by Country 2024 & 2032
- Figure 21: South America Cannabidiol Oil Industry Revenue Share (%), by Country 2024 & 2032
- Figure 22: South America Cannabidiol Oil Industry Volume Share (%), by Country 2024 & 2032
- Figure 23: North America Cannabidiol Oil Industry Revenue (Million), by Product 2024 & 2032
- Figure 24: North America Cannabidiol Oil Industry Volume (K unit), by Product 2024 & 2032
- Figure 25: North America Cannabidiol Oil Industry Revenue Share (%), by Product 2024 & 2032
- Figure 26: North America Cannabidiol Oil Industry Volume Share (%), by Product 2024 & 2032
- Figure 27: North America Cannabidiol Oil Industry Revenue (Million), by Application 2024 & 2032
- Figure 28: North America Cannabidiol Oil Industry Volume (K unit), by Application 2024 & 2032
- Figure 29: North America Cannabidiol Oil Industry Revenue Share (%), by Application 2024 & 2032
- Figure 30: North America Cannabidiol Oil Industry Volume Share (%), by Application 2024 & 2032
- Figure 31: North America Cannabidiol Oil Industry Revenue (Million), by Country 2024 & 2032
- Figure 32: North America Cannabidiol Oil Industry Volume (K unit), by Country 2024 & 2032
- Figure 33: North America Cannabidiol Oil Industry Revenue Share (%), by Country 2024 & 2032
- Figure 34: North America Cannabidiol Oil Industry Volume Share (%), by Country 2024 & 2032
- Figure 35: Europe Cannabidiol Oil Industry Revenue (Million), by Product 2024 & 2032
- Figure 36: Europe Cannabidiol Oil Industry Volume (K unit), by Product 2024 & 2032
- Figure 37: Europe Cannabidiol Oil Industry Revenue Share (%), by Product 2024 & 2032
- Figure 38: Europe Cannabidiol Oil Industry Volume Share (%), by Product 2024 & 2032
- Figure 39: Europe Cannabidiol Oil Industry Revenue (Million), by Application 2024 & 2032
- Figure 40: Europe Cannabidiol Oil Industry Volume (K unit), by Application 2024 & 2032
- Figure 41: Europe Cannabidiol Oil Industry Revenue Share (%), by Application 2024 & 2032
- Figure 42: Europe Cannabidiol Oil Industry Volume Share (%), by Application 2024 & 2032
- Figure 43: Europe Cannabidiol Oil Industry Revenue (Million), by Country 2024 & 2032
- Figure 44: Europe Cannabidiol Oil Industry Volume (K unit), by Country 2024 & 2032
- Figure 45: Europe Cannabidiol Oil Industry Revenue Share (%), by Country 2024 & 2032
- Figure 46: Europe Cannabidiol Oil Industry Volume Share (%), by Country 2024 & 2032
- Figure 47: Asia Pacific Cannabidiol Oil Industry Revenue (Million), by Product 2024 & 2032
- Figure 48: Asia Pacific Cannabidiol Oil Industry Volume (K unit), by Product 2024 & 2032
- Figure 49: Asia Pacific Cannabidiol Oil Industry Revenue Share (%), by Product 2024 & 2032
- Figure 50: Asia Pacific Cannabidiol Oil Industry Volume Share (%), by Product 2024 & 2032
- Figure 51: Asia Pacific Cannabidiol Oil Industry Revenue (Million), by Application 2024 & 2032
- Figure 52: Asia Pacific Cannabidiol Oil Industry Volume (K unit), by Application 2024 & 2032
- Figure 53: Asia Pacific Cannabidiol Oil Industry Revenue Share (%), by Application 2024 & 2032
- Figure 54: Asia Pacific Cannabidiol Oil Industry Volume Share (%), by Application 2024 & 2032
- Figure 55: Asia Pacific Cannabidiol Oil Industry Revenue (Million), by Country 2024 & 2032
- Figure 56: Asia Pacific Cannabidiol Oil Industry Volume (K unit), by Country 2024 & 2032
- Figure 57: Asia Pacific Cannabidiol Oil Industry Revenue Share (%), by Country 2024 & 2032
- Figure 58: Asia Pacific Cannabidiol Oil Industry Volume Share (%), by Country 2024 & 2032
- Figure 59: Middle East and Africa Cannabidiol Oil Industry Revenue (Million), by Product 2024 & 2032
- Figure 60: Middle East and Africa Cannabidiol Oil Industry Volume (K unit), by Product 2024 & 2032
- Figure 61: Middle East and Africa Cannabidiol Oil Industry Revenue Share (%), by Product 2024 & 2032
- Figure 62: Middle East and Africa Cannabidiol Oil Industry Volume Share (%), by Product 2024 & 2032
- Figure 63: Middle East and Africa Cannabidiol Oil Industry Revenue (Million), by Application 2024 & 2032
- Figure 64: Middle East and Africa Cannabidiol Oil Industry Volume (K unit), by Application 2024 & 2032
- Figure 65: Middle East and Africa Cannabidiol Oil Industry Revenue Share (%), by Application 2024 & 2032
- Figure 66: Middle East and Africa Cannabidiol Oil Industry Volume Share (%), by Application 2024 & 2032
- Figure 67: Middle East and Africa Cannabidiol Oil Industry Revenue (Million), by Country 2024 & 2032
- Figure 68: Middle East and Africa Cannabidiol Oil Industry Volume (K unit), by Country 2024 & 2032
- Figure 69: Middle East and Africa Cannabidiol Oil Industry Revenue Share (%), by Country 2024 & 2032
- Figure 70: Middle East and Africa Cannabidiol Oil Industry Volume Share (%), by Country 2024 & 2032
- Figure 71: South America Cannabidiol Oil Industry Revenue (Million), by Product 2024 & 2032
- Figure 72: South America Cannabidiol Oil Industry Volume (K unit), by Product 2024 & 2032
- Figure 73: South America Cannabidiol Oil Industry Revenue Share (%), by Product 2024 & 2032
- Figure 74: South America Cannabidiol Oil Industry Volume Share (%), by Product 2024 & 2032
- Figure 75: South America Cannabidiol Oil Industry Revenue (Million), by Application 2024 & 2032
- Figure 76: South America Cannabidiol Oil Industry Volume (K unit), by Application 2024 & 2032
- Figure 77: South America Cannabidiol Oil Industry Revenue Share (%), by Application 2024 & 2032
- Figure 78: South America Cannabidiol Oil Industry Volume Share (%), by Application 2024 & 2032
- Figure 79: South America Cannabidiol Oil Industry Revenue (Million), by Country 2024 & 2032
- Figure 80: South America Cannabidiol Oil Industry Volume (K unit), by Country 2024 & 2032
- Figure 81: South America Cannabidiol Oil Industry Revenue Share (%), by Country 2024 & 2032
- Figure 82: South America Cannabidiol Oil Industry Volume Share (%), by Country 2024 & 2032
List of Tables
- Table 1: Global Cannabidiol Oil Industry Revenue Million Forecast, by Region 2019 & 2032
- Table 2: Global Cannabidiol Oil Industry Volume K unit Forecast, by Region 2019 & 2032
- Table 3: Global Cannabidiol Oil Industry Revenue Million Forecast, by Product 2019 & 2032
- Table 4: Global Cannabidiol Oil Industry Volume K unit Forecast, by Product 2019 & 2032
- Table 5: Global Cannabidiol Oil Industry Revenue Million Forecast, by Application 2019 & 2032
- Table 6: Global Cannabidiol Oil Industry Volume K unit Forecast, by Application 2019 & 2032
- Table 7: Global Cannabidiol Oil Industry Revenue Million Forecast, by Region 2019 & 2032
- Table 8: Global Cannabidiol Oil Industry Volume K unit Forecast, by Region 2019 & 2032
- Table 9: Global Cannabidiol Oil Industry Revenue Million Forecast, by Country 2019 & 2032
- Table 10: Global Cannabidiol Oil Industry Volume K unit Forecast, by Country 2019 & 2032
- Table 11: Global Cannabidiol Oil Industry Revenue Million Forecast, by Country 2019 & 2032
- Table 12: Global Cannabidiol Oil Industry Volume K unit Forecast, by Country 2019 & 2032
- Table 13: Global Cannabidiol Oil Industry Revenue Million Forecast, by Country 2019 & 2032
- Table 14: Global Cannabidiol Oil Industry Volume K unit Forecast, by Country 2019 & 2032
- Table 15: Global Cannabidiol Oil Industry Revenue Million Forecast, by Country 2019 & 2032
- Table 16: Global Cannabidiol Oil Industry Volume K unit Forecast, by Country 2019 & 2032
- Table 17: Global Cannabidiol Oil Industry Revenue Million Forecast, by Country 2019 & 2032
- Table 18: Global Cannabidiol Oil Industry Volume K unit Forecast, by Country 2019 & 2032
- Table 19: Global Cannabidiol Oil Industry Revenue Million Forecast, by Product 2019 & 2032
- Table 20: Global Cannabidiol Oil Industry Volume K unit Forecast, by Product 2019 & 2032
- Table 21: Global Cannabidiol Oil Industry Revenue Million Forecast, by Application 2019 & 2032
- Table 22: Global Cannabidiol Oil Industry Volume K unit Forecast, by Application 2019 & 2032
- Table 23: Global Cannabidiol Oil Industry Revenue Million Forecast, by Country 2019 & 2032
- Table 24: Global Cannabidiol Oil Industry Volume K unit Forecast, by Country 2019 & 2032
- Table 25: United States Cannabidiol Oil Industry Revenue (Million) Forecast, by Application 2019 & 2032
- Table 26: United States Cannabidiol Oil Industry Volume (K unit) Forecast, by Application 2019 & 2032
- Table 27: Canada Cannabidiol Oil Industry Revenue (Million) Forecast, by Application 2019 & 2032
- Table 28: Canada Cannabidiol Oil Industry Volume (K unit) Forecast, by Application 2019 & 2032
- Table 29: Mexico Cannabidiol Oil Industry Revenue (Million) Forecast, by Application 2019 & 2032
- Table 30: Mexico Cannabidiol Oil Industry Volume (K unit) Forecast, by Application 2019 & 2032
- Table 31: Global Cannabidiol Oil Industry Revenue Million Forecast, by Product 2019 & 2032
- Table 32: Global Cannabidiol Oil Industry Volume K unit Forecast, by Product 2019 & 2032
- Table 33: Global Cannabidiol Oil Industry Revenue Million Forecast, by Application 2019 & 2032
- Table 34: Global Cannabidiol Oil Industry Volume K unit Forecast, by Application 2019 & 2032
- Table 35: Global Cannabidiol Oil Industry Revenue Million Forecast, by Country 2019 & 2032
- Table 36: Global Cannabidiol Oil Industry Volume K unit Forecast, by Country 2019 & 2032
- Table 37: Germany Cannabidiol Oil Industry Revenue (Million) Forecast, by Application 2019 & 2032
- Table 38: Germany Cannabidiol Oil Industry Volume (K unit) Forecast, by Application 2019 & 2032
- Table 39: United Kingdom Cannabidiol Oil Industry Revenue (Million) Forecast, by Application 2019 & 2032
- Table 40: United Kingdom Cannabidiol Oil Industry Volume (K unit) Forecast, by Application 2019 & 2032
- Table 41: France Cannabidiol Oil Industry Revenue (Million) Forecast, by Application 2019 & 2032
- Table 42: France Cannabidiol Oil Industry Volume (K unit) Forecast, by Application 2019 & 2032
- Table 43: Italy Cannabidiol Oil Industry Revenue (Million) Forecast, by Application 2019 & 2032
- Table 44: Italy Cannabidiol Oil Industry Volume (K unit) Forecast, by Application 2019 & 2032
- Table 45: Spain Cannabidiol Oil Industry Revenue (Million) Forecast, by Application 2019 & 2032
- Table 46: Spain Cannabidiol Oil Industry Volume (K unit) Forecast, by Application 2019 & 2032
- Table 47: Rest of Europe Cannabidiol Oil Industry Revenue (Million) Forecast, by Application 2019 & 2032
- Table 48: Rest of Europe Cannabidiol Oil Industry Volume (K unit) Forecast, by Application 2019 & 2032
- Table 49: Global Cannabidiol Oil Industry Revenue Million Forecast, by Product 2019 & 2032
- Table 50: Global Cannabidiol Oil Industry Volume K unit Forecast, by Product 2019 & 2032
- Table 51: Global Cannabidiol Oil Industry Revenue Million Forecast, by Application 2019 & 2032
- Table 52: Global Cannabidiol Oil Industry Volume K unit Forecast, by Application 2019 & 2032
- Table 53: Global Cannabidiol Oil Industry Revenue Million Forecast, by Country 2019 & 2032
- Table 54: Global Cannabidiol Oil Industry Volume K unit Forecast, by Country 2019 & 2032
- Table 55: China Cannabidiol Oil Industry Revenue (Million) Forecast, by Application 2019 & 2032
- Table 56: China Cannabidiol Oil Industry Volume (K unit) Forecast, by Application 2019 & 2032
- Table 57: Japan Cannabidiol Oil Industry Revenue (Million) Forecast, by Application 2019 & 2032
- Table 58: Japan Cannabidiol Oil Industry Volume (K unit) Forecast, by Application 2019 & 2032
- Table 59: India Cannabidiol Oil Industry Revenue (Million) Forecast, by Application 2019 & 2032
- Table 60: India Cannabidiol Oil Industry Volume (K unit) Forecast, by Application 2019 & 2032
- Table 61: Australia Cannabidiol Oil Industry Revenue (Million) Forecast, by Application 2019 & 2032
- Table 62: Australia Cannabidiol Oil Industry Volume (K unit) Forecast, by Application 2019 & 2032
- Table 63: South Korea Cannabidiol Oil Industry Revenue (Million) Forecast, by Application 2019 & 2032
- Table 64: South Korea Cannabidiol Oil Industry Volume (K unit) Forecast, by Application 2019 & 2032
- Table 65: Rest of Asia Pacific Cannabidiol Oil Industry Revenue (Million) Forecast, by Application 2019 & 2032
- Table 66: Rest of Asia Pacific Cannabidiol Oil Industry Volume (K unit) Forecast, by Application 2019 & 2032
- Table 67: Global Cannabidiol Oil Industry Revenue Million Forecast, by Product 2019 & 2032
- Table 68: Global Cannabidiol Oil Industry Volume K unit Forecast, by Product 2019 & 2032
- Table 69: Global Cannabidiol Oil Industry Revenue Million Forecast, by Application 2019 & 2032
- Table 70: Global Cannabidiol Oil Industry Volume K unit Forecast, by Application 2019 & 2032
- Table 71: Global Cannabidiol Oil Industry Revenue Million Forecast, by Country 2019 & 2032
- Table 72: Global Cannabidiol Oil Industry Volume K unit Forecast, by Country 2019 & 2032
- Table 73: GCC Cannabidiol Oil Industry Revenue (Million) Forecast, by Application 2019 & 2032
- Table 74: GCC Cannabidiol Oil Industry Volume (K unit) Forecast, by Application 2019 & 2032
- Table 75: South Africa Cannabidiol Oil Industry Revenue (Million) Forecast, by Application 2019 & 2032
- Table 76: South Africa Cannabidiol Oil Industry Volume (K unit) Forecast, by Application 2019 & 2032
- Table 77: Rest of Middle East and Africa Cannabidiol Oil Industry Revenue (Million) Forecast, by Application 2019 & 2032
- Table 78: Rest of Middle East and Africa Cannabidiol Oil Industry Volume (K unit) Forecast, by Application 2019 & 2032
- Table 79: Global Cannabidiol Oil Industry Revenue Million Forecast, by Product 2019 & 2032
- Table 80: Global Cannabidiol Oil Industry Volume K unit Forecast, by Product 2019 & 2032
- Table 81: Global Cannabidiol Oil Industry Revenue Million Forecast, by Application 2019 & 2032
- Table 82: Global Cannabidiol Oil Industry Volume K unit Forecast, by Application 2019 & 2032
- Table 83: Global Cannabidiol Oil Industry Revenue Million Forecast, by Country 2019 & 2032
- Table 84: Global Cannabidiol Oil Industry Volume K unit Forecast, by Country 2019 & 2032
- Table 85: Brazil Cannabidiol Oil Industry Revenue (Million) Forecast, by Application 2019 & 2032
- Table 86: Brazil Cannabidiol Oil Industry Volume (K unit) Forecast, by Application 2019 & 2032
- Table 87: Argentina Cannabidiol Oil Industry Revenue (Million) Forecast, by Application 2019 & 2032
- Table 88: Argentina Cannabidiol Oil Industry Volume (K unit) Forecast, by Application 2019 & 2032
- Table 89: Rest of South America Cannabidiol Oil Industry Revenue (Million) Forecast, by Application 2019 & 2032
- Table 90: Rest of South America Cannabidiol Oil Industry Volume (K unit) Forecast, by Application 2019 & 2032
Frequently Asked Questions
1. What is the projected Compound Annual Growth Rate (CAGR) of the Cannabidiol Oil Industry?
The projected CAGR is approximately 16.50%.
2. Which companies are prominent players in the Cannabidiol Oil Industry?
Key companies in the market include Hempstrol, Medical Marijuana Inc, ConnOils LLC, NuLeaf Naturals LLC, Aurora Cannabis, Canopy Growth Corporation, Elixinol, CV Sciences Inc, IRIE CBD, ENDOCA, CBD American Shaman, Gaia Herbs.
3. What are the main segments of the Cannabidiol Oil Industry?
The market segments include Product, Application.
4. Can you provide details about the market size?
The market size is estimated to be USD XX Million as of 2022.
5. What are some drivers contributing to market growth?
Growing Incidence of Psychological Disorders; Rise in Acceptance of CBD Oil Based Products.
6. What are the notable trends driving market growth?
Neurological Pain Segment is Expected to Hold a Significant Share in the Cannabidiol (CBD) Oil Market Over the Forecast Period.
7. Are there any restraints impacting market growth?
Stringent Regulatory Policies for Marketing; Side Effects and Negative Perception of People on Use of CBD Oil.
8. Can you provide examples of recent developments in the market?
October 2022: Charlotte's Web Holdings, Inc., partnered with GoPuff for distribution in Arizona, Illinois, California, and New York. The distribution included CBD oil tinctures in various concentrations, topical CBD creams, balms, and CBD oil.
9. What pricing options are available for accessing the report?
Pricing options include single-user, multi-user, and enterprise licenses priced at USD 4750, USD 5250, and USD 8750 respectively.
10. Is the market size provided in terms of value or volume?
The market size is provided in terms of value, measured in Million and volume, measured in K unit.
11. Are there any specific market keywords associated with the report?
Yes, the market keyword associated with the report is "Cannabidiol Oil Industry," which aids in identifying and referencing the specific market segment covered.
12. How do I determine which pricing option suits my needs best?
The pricing options vary based on user requirements and access needs. Individual users may opt for single-user licenses, while businesses requiring broader access may choose multi-user or enterprise licenses for cost-effective access to the report.
13. Are there any additional resources or data provided in the Cannabidiol Oil Industry report?
While the report offers comprehensive insights, it's advisable to review the specific contents or supplementary materials provided to ascertain if additional resources or data are available.
14. How can I stay updated on further developments or reports in the Cannabidiol Oil Industry?
To stay informed about further developments, trends, and reports in the Cannabidiol Oil Industry, consider subscribing to industry newsletters, following relevant companies and organizations, or regularly checking reputable industry news sources and publications.
Methodology
Step 1 - Identification of Relevant Samples Size from Population Database


Step 2 - Approaches for Defining Global Market Size (Value, Volume* & Price*)

Note*: In applicable scenarios
Step 3 - Data Sources
Primary Research
- Web Analytics
- Survey Reports
- Research Institute
- Latest Research Reports
- Opinion Leaders
Secondary Research
- Annual Reports
- White Paper
- Latest Press Release
- Industry Association
- Paid Database
- Investor Presentations

Step 4 - Data Triangulation
Involves using different sources of information in order to increase the validity of a study
These sources are likely to be stakeholders in a program - participants, other researchers, program staff, other community members, and so on.
Then we put all data in single framework & apply various statistical tools to find out the dynamic on the market.
During the analysis stage, feedback from the stakeholder groups would be compared to determine areas of agreement as well as areas of divergence


