
Key Insights
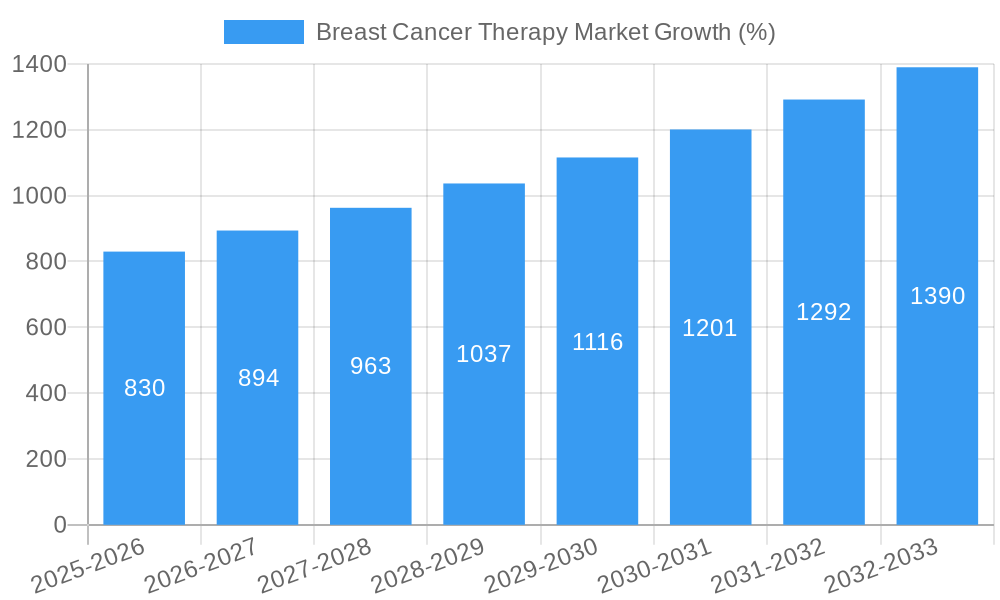
The global breast cancer therapy market is experiencing robust growth, driven by increasing breast cancer incidence rates worldwide, advancements in targeted therapies, and the rising adoption of personalized medicine approaches. The market's Compound Annual Growth Rate (CAGR) of 8.30% from 2019 to 2024 suggests a substantial expansion, which is projected to continue through 2033. Several factors contribute to this growth. The development of innovative therapies, such as targeted therapies including hormonal therapies and immunotherapies, offers improved efficacy and reduced side effects compared to traditional chemotherapy, fueling market expansion. Furthermore, increased awareness campaigns and early detection programs are leading to earlier diagnosis and treatment, impacting market size positively. While the market is dominated by established players like Pfizer, Novartis, and Roche, emerging biotech companies are also making significant contributions with novel therapeutic approaches. Competition is fierce, driving innovation and potentially leading to more affordable treatment options in the future. Geographic variations exist, with North America and Europe currently holding the largest market shares due to advanced healthcare infrastructure and high healthcare spending. However, emerging economies in Asia-Pacific are showing significant growth potential, driven by rising disposable incomes and increasing healthcare awareness.
The market segmentation reveals radiation therapy, targeted therapy (including hormonal therapies and other targeted approaches like antibody-drug conjugates and kinase inhibitors), and chemotherapy as the primary treatment modalities. The preference for a specific therapy depends on various factors, including the stage and type of breast cancer, patient characteristics, and physician preference. Growth in targeted therapies is particularly notable, reflecting the ongoing shift toward personalized medicine and the development of therapies targeting specific molecular drivers of cancer. Challenges remain, however, including the high cost of newer therapies, potential treatment resistance, and the need for improved access to advanced treatments in low- and middle-income countries. These factors, while presenting restraints to market expansion, are simultaneously driving innovation and research into more cost-effective and accessible treatment options. Future market growth will likely depend on the successful development and commercialization of next-generation therapies, alongside improvements in affordability and accessibility.
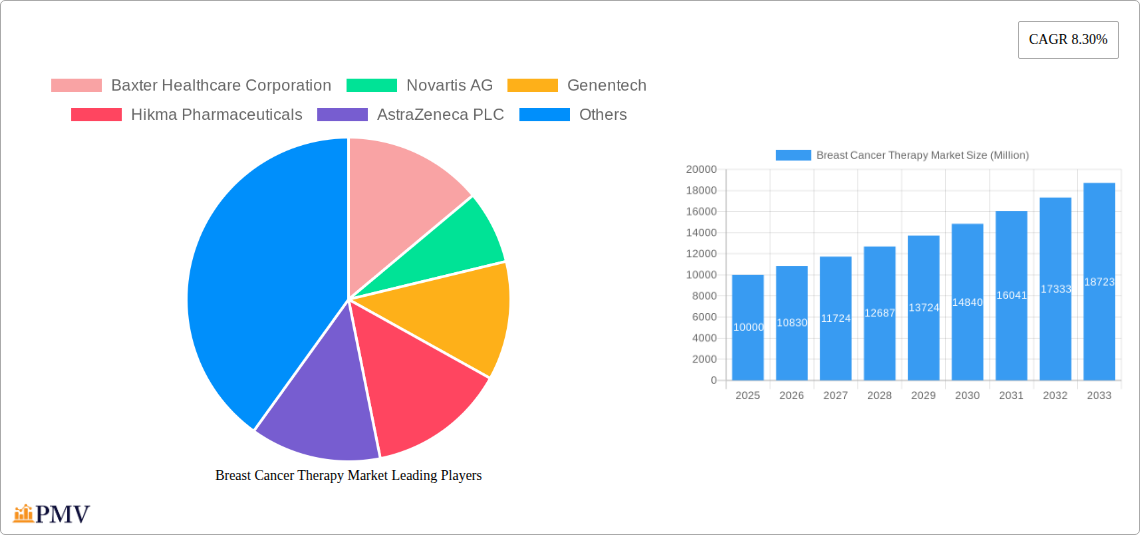
This comprehensive report provides an in-depth analysis of the global Breast Cancer Therapy Market, encompassing historical data (2019-2024), current estimations (2025), and future projections (2025-2033). The report offers actionable insights into market dynamics, competitive landscapes, and emerging trends, enabling stakeholders to make informed strategic decisions. The market is expected to reach xx Million by 2033, exhibiting a CAGR of xx% during the forecast period. Key players analyzed include Baxter Healthcare Corporation, Novartis AG, Genentech, Hikma Pharmaceuticals, AstraZeneca PLC, FRESENIUS KABI, Eli Lilly and Company, Celltrion Healthcare, Teva Pharmaceutical Industries Ltd, Viatris Inc, Halozyme Inc, Eisai Co Ltd, Bristol-Myers Squibb Company, GlaxoSmithKline PLC, and Pfizer Inc. The report segments the market by therapy type: Radiation Therapy, Targeted Therapy (including Hormonal Therapy and other targeted therapies), and Chemotherapy (including Hormonal Chemotherapy and other chemotherapies).
Breast Cancer Therapy Market Market Structure & Competitive Dynamics
The Breast Cancer Therapy market exhibits a moderately consolidated structure, with a few major players holding significant market share. The market's competitive landscape is characterized by intense rivalry, driven by continuous innovation, strategic partnerships, and mergers & acquisitions (M&A) activities. Several key metrics reveal this dynamic:
- Market Concentration: The top 5 companies hold approximately xx% of the global market share in 2025.
- Innovation Ecosystems: Significant investments in R&D are observed across various companies, leading to a steady stream of new drug approvals and technological advancements. This drives both innovation and competition.
- Regulatory Frameworks: Stringent regulatory approvals from bodies like the FDA influence market entry and product lifecycles. This necessitates significant regulatory compliance investments.
- Product Substitutes: The availability of alternative therapies and the emergence of biosimilars exert pressure on pricing and market share among established players.
- End-User Trends: The increasing prevalence of breast cancer globally, coupled with a growing demand for targeted and personalized therapies, fuels market growth.
- M&A Activities: The past five years witnessed significant M&A activity, with deal values exceeding xx Million, demonstrating the strategic importance of consolidating market position and expanding product portfolios. Examples include (Specific examples of M&A deals within the industry, if available, should be inserted here with deal values).
Breast Cancer Therapy Market Industry Trends & Insights
The global breast cancer therapy market is experiencing robust growth, driven by several factors. Technological advancements in targeted therapies, particularly in the realm of immunotherapies and personalized medicine, are significantly impacting treatment strategies. The increasing prevalence of breast cancer, especially among women in developing nations, is a significant market driver. Consumer preferences are shifting towards less invasive and more effective treatments with minimized side effects. The competitive dynamics are characterized by the continuous introduction of innovative therapies and the ongoing efforts of established players to maintain market dominance.
The market is witnessing a transition towards personalized medicine, driven by advancements in genomic profiling and the development of targeted therapies. This trend is enhancing treatment efficacy and improving patient outcomes. Increased investment in research and development by pharmaceutical companies is leading to the development of novel therapeutic approaches. This results in a considerable market expansion, with a projected compound annual growth rate (CAGR) of xx% between 2025 and 2033. Market penetration of new therapies is also influenced by factors such as pricing, reimbursement policies, and clinical trial outcomes.
Dominant Markets & Segments in Breast Cancer Therapy Market
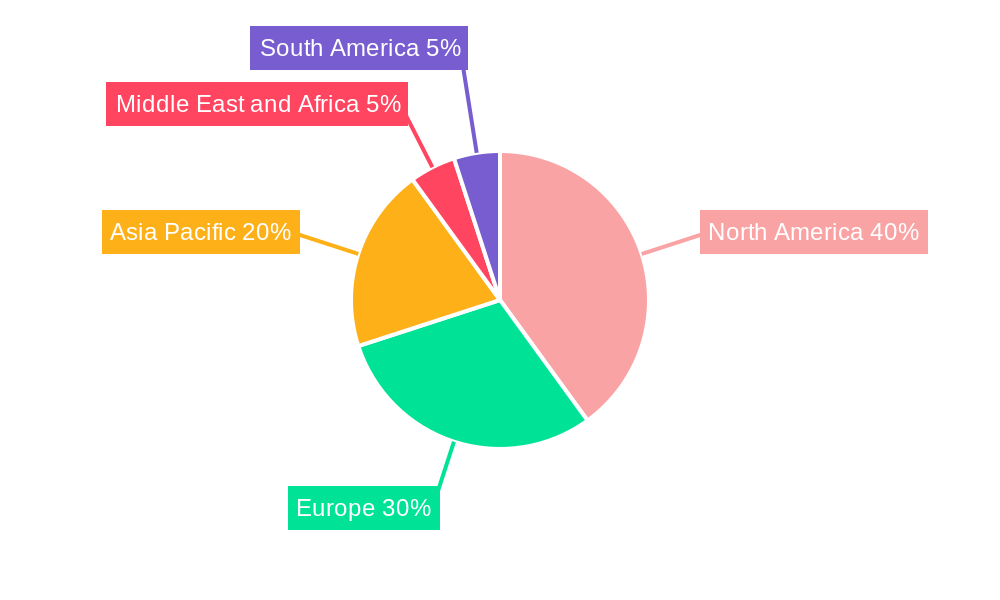
The North American region currently dominates the global breast cancer therapy market, driven by high healthcare expenditure, advanced healthcare infrastructure, and a large patient pool. However, emerging economies in Asia-Pacific are demonstrating rapid growth potential.
- North America: High prevalence of breast cancer, advanced healthcare infrastructure, and robust research and development activity contribute to market leadership.
- Europe: A significant market driven by high healthcare expenditure and the adoption of innovative therapies.
- Asia Pacific: Rapid growth potential due to rising prevalence of breast cancer, increasing healthcare awareness, and expanding healthcare infrastructure.
Segment Dominance:
- Targeted Therapy: This segment holds the largest market share due to its effectiveness and selectivity in targeting cancerous cells, minimizing damage to healthy tissue.
- Hormonal Therapy: A significant segment, particularly effective in treating hormone-receptor-positive breast cancers.
- Chemotherapy: Remains a crucial treatment modality, particularly in advanced stages of the disease.
- Radiation Therapy: An important treatment option frequently used in conjunction with other therapies.
Specific drivers for each region and segment (e.g., economic policies, healthcare infrastructure, regulatory approvals) would need to be detailed here.
Breast Cancer Therapy Market Product Innovations
Recent years have witnessed significant advancements in breast cancer therapies, including the development of novel targeted therapies like antibody-drug conjugates (ADCs), such as Enhertu (fam-trastuzumab-deruxtecan-nxki), approved for HER2-low breast cancer. Immunotherapies are showing great promise, targeting the immune system to fight cancer cells. These advancements are improving treatment outcomes and offer more personalized treatment approaches for patients.
Report Segmentation & Scope
The report provides a comprehensive segmentation of the breast cancer therapy market based on therapy type:
Radiation Therapy: This segment is analyzed based on various radiation techniques, including external beam radiation therapy, brachytherapy, and others. Growth projections and market sizes are provided for the forecast period.
Targeted Therapy: This segment encompasses various targeted therapies including hormonal therapies and other targeted therapies. Growth projections and market sizes are given for the forecast period. Competitive dynamics, such as the introduction of novel targeted agents and biosimilars, are analyzed.
Other Targeted Therapies (Hormonal Therapy): This sub-segment focuses specifically on hormonal therapies, highlighting the specific drugs and their market dynamics. Growth projections are included.
Other Hormonal Therapies (Chemotherapy): This sub-segment analyzes various chemotherapy regimens, considering both standard and novel approaches. Growth projections are provided.
Key Drivers of Breast Cancer Therapy Market Growth
Several key factors are driving growth in the breast cancer therapy market. These include:
- Rising Breast Cancer Prevalence: The increasing incidence of breast cancer globally is the primary driver.
- Technological Advancements: Innovations in targeted therapies, immunotherapies, and personalized medicine are enhancing treatment effectiveness.
- Favorable Regulatory Environment: Approvals of new therapies by regulatory bodies fuel market growth.
- Increased Healthcare Spending: Higher healthcare expenditure, particularly in developed nations, supports higher drug prices and accessibility to advanced treatments.
Challenges in the Breast Cancer Therapy Market Sector
Several challenges hinder market growth:
- High Drug Costs: The high cost of innovative therapies limits accessibility, particularly in resource-constrained settings.
- Drug Resistance: The development of drug resistance in cancer cells necessitates the development of new therapeutic strategies.
- Regulatory Hurdles: Stringent regulatory processes can delay the market entry of new drugs.
- Side Effects: The side effects associated with some therapies can affect patient compliance and treatment outcomes.
Leading Players in the Breast Cancer Therapy Market Market
- Baxter Healthcare Corporation
- Novartis AG
- Genentech
- Hikma Pharmaceuticals
- AstraZeneca PLC
- FRESENIUS KABI
- Eli Lilly and Company
- Celltrion Healthcare
- Teva Pharmaceutical Industries Ltd
- Viatris Inc
- Halozyme Inc
- Eisai Co Ltd
- Bristol-Myers Squibb Company
- GlaxoSmithKline PLC
- Pfizer Inc
Key Developments in Breast Cancer Therapy Market Sector
- September 2022: Novartis announced extended overall survival benefits with MONALEESA Phase III data in HR+/HER2- advanced breast cancer.
- August 2022: FDA approval of Enhertu (fam-trastuzumab-deruxtecan-nxki) for HER2-low metastatic breast cancer.
Strategic Breast Cancer Therapy Market Market Outlook
The future of the breast cancer therapy market looks promising, driven by continued innovation in targeted therapies, immunotherapies, and personalized medicine. Strategic opportunities exist for companies focusing on developing novel therapies, expanding into emerging markets, and establishing strategic partnerships to accelerate drug development and market access. The market's growth will be further fueled by increasing research and development efforts, leading to the introduction of more effective and safer treatments. The integration of artificial intelligence and big data analytics in drug discovery and clinical trials will also drive future market growth.
Breast Cancer Therapy Market Segmentation
-
1. Therapy
- 1.1. Radiation Therapy
-
1.2. Targeted Therapy
- 1.2.1. Herceptin
- 1.2.2. Tykerb (Lapatinib)
- 1.2.3. Afinitor
- 1.2.4. Other Targeted Therapies
-
1.3. Hormonal Therapy
- 1.3.1. Selective Estrogen - Receptor Modulators
- 1.3.2. Aromatase Inhibitors
- 1.3.3. Other Hormonal Therapies
-
1.4. Chemotherapy
- 1.4.1. Taxanes
- 1.4.2. Anthracyclines
- 1.4.3. Anti-metabolites
- 1.4.4. Alkylating Agents
- 1.4.5. Epothilones
Breast Cancer Therapy Market Segmentation By Geography
-
1. North America
- 1.1. United States
- 1.2. Canada
- 1.3. Mexico
-
2. Europe
- 2.1. Germany
- 2.2. United Kingdom
- 2.3. France
- 2.4. Italy
- 2.5. Spain
- 2.6. Rest of Europe
-
3. Asia Pacific
- 3.1. China
- 3.2. Japan
- 3.3. India
- 3.4. Australia
- 3.5. South Korea
- 3.6. Rest of Asia Pacific
-
4. Middle East and Africa
- 4.1. GCC
- 4.2. South Africa
- 4.3. Rest of Middle East and Africa
-
5. South America
- 5.1. Brazil
- 5.2. Argentina
- 5.3. Rest of South America
Breast Cancer Therapy Market REPORT HIGHLIGHTS
| Aspects | Details |
|---|---|
| Study Period | 2019-2033 |
| Base Year | 2024 |
| Estimated Year | 2025 |
| Forecast Period | 2025-2033 |
| Historical Period | 2019-2024 |
| Growth Rate | CAGR of 8.30% from 2019-2033 |
| Segmentation |
|
Table of Contents
- 1. Introduction
- 1.1. Research Scope
- 1.2. Market Segmentation
- 1.3. Research Methodology
- 1.4. Definitions and Assumptions
- 2. Executive Summary
- 2.1. Introduction
- 3. Market Dynamics
- 3.1. Introduction
- 3.2. Market Drivers
- 3.2.1 High Incidence and Prevalence Rate of Breast Cancer; Increasing Investments in R&D; Advancements in Cancer Biology and Pharmacology
- 3.2.2 Promoting Drug Development
- 3.3. Market Restrains
- 3.3.1. Risk of Adverse Effects of Radiation Exposure; Stringent Regulatory Scenarios
- 3.4. Market Trends
- 3.4.1. Chemotherapy Segment Expected to Witness High Growth Over the Forecast Period
- 4. Market Factor Analysis
- 4.1. Porters Five Forces
- 4.2. Supply/Value Chain
- 4.3. PESTEL analysis
- 4.4. Market Entropy
- 4.5. Patent/Trademark Analysis
- 5. Global Breast Cancer Therapy Market Analysis, Insights and Forecast, 2019-2031
- 5.1. Market Analysis, Insights and Forecast - by Therapy
- 5.1.1. Radiation Therapy
- 5.1.2. Targeted Therapy
- 5.1.2.1. Herceptin
- 5.1.2.2. Tykerb (Lapatinib)
- 5.1.2.3. Afinitor
- 5.1.2.4. Other Targeted Therapies
- 5.1.3. Hormonal Therapy
- 5.1.3.1. Selective Estrogen - Receptor Modulators
- 5.1.3.2. Aromatase Inhibitors
- 5.1.3.3. Other Hormonal Therapies
- 5.1.4. Chemotherapy
- 5.1.4.1. Taxanes
- 5.1.4.2. Anthracyclines
- 5.1.4.3. Anti-metabolites
- 5.1.4.4. Alkylating Agents
- 5.1.4.5. Epothilones
- 5.2. Market Analysis, Insights and Forecast - by Region
- 5.2.1. North America
- 5.2.2. Europe
- 5.2.3. Asia Pacific
- 5.2.4. Middle East and Africa
- 5.2.5. South America
- 5.1. Market Analysis, Insights and Forecast - by Therapy
- 6. North America Breast Cancer Therapy Market Analysis, Insights and Forecast, 2019-2031
- 6.1. Market Analysis, Insights and Forecast - by Therapy
- 6.1.1. Radiation Therapy
- 6.1.2. Targeted Therapy
- 6.1.2.1. Herceptin
- 6.1.2.2. Tykerb (Lapatinib)
- 6.1.2.3. Afinitor
- 6.1.2.4. Other Targeted Therapies
- 6.1.3. Hormonal Therapy
- 6.1.3.1. Selective Estrogen - Receptor Modulators
- 6.1.3.2. Aromatase Inhibitors
- 6.1.3.3. Other Hormonal Therapies
- 6.1.4. Chemotherapy
- 6.1.4.1. Taxanes
- 6.1.4.2. Anthracyclines
- 6.1.4.3. Anti-metabolites
- 6.1.4.4. Alkylating Agents
- 6.1.4.5. Epothilones
- 6.1. Market Analysis, Insights and Forecast - by Therapy
- 7. Europe Breast Cancer Therapy Market Analysis, Insights and Forecast, 2019-2031
- 7.1. Market Analysis, Insights and Forecast - by Therapy
- 7.1.1. Radiation Therapy
- 7.1.2. Targeted Therapy
- 7.1.2.1. Herceptin
- 7.1.2.2. Tykerb (Lapatinib)
- 7.1.2.3. Afinitor
- 7.1.2.4. Other Targeted Therapies
- 7.1.3. Hormonal Therapy
- 7.1.3.1. Selective Estrogen - Receptor Modulators
- 7.1.3.2. Aromatase Inhibitors
- 7.1.3.3. Other Hormonal Therapies
- 7.1.4. Chemotherapy
- 7.1.4.1. Taxanes
- 7.1.4.2. Anthracyclines
- 7.1.4.3. Anti-metabolites
- 7.1.4.4. Alkylating Agents
- 7.1.4.5. Epothilones
- 7.1. Market Analysis, Insights and Forecast - by Therapy
- 8. Asia Pacific Breast Cancer Therapy Market Analysis, Insights and Forecast, 2019-2031
- 8.1. Market Analysis, Insights and Forecast - by Therapy
- 8.1.1. Radiation Therapy
- 8.1.2. Targeted Therapy
- 8.1.2.1. Herceptin
- 8.1.2.2. Tykerb (Lapatinib)
- 8.1.2.3. Afinitor
- 8.1.2.4. Other Targeted Therapies
- 8.1.3. Hormonal Therapy
- 8.1.3.1. Selective Estrogen - Receptor Modulators
- 8.1.3.2. Aromatase Inhibitors
- 8.1.3.3. Other Hormonal Therapies
- 8.1.4. Chemotherapy
- 8.1.4.1. Taxanes
- 8.1.4.2. Anthracyclines
- 8.1.4.3. Anti-metabolites
- 8.1.4.4. Alkylating Agents
- 8.1.4.5. Epothilones
- 8.1. Market Analysis, Insights and Forecast - by Therapy
- 9. Middle East and Africa Breast Cancer Therapy Market Analysis, Insights and Forecast, 2019-2031
- 9.1. Market Analysis, Insights and Forecast - by Therapy
- 9.1.1. Radiation Therapy
- 9.1.2. Targeted Therapy
- 9.1.2.1. Herceptin
- 9.1.2.2. Tykerb (Lapatinib)
- 9.1.2.3. Afinitor
- 9.1.2.4. Other Targeted Therapies
- 9.1.3. Hormonal Therapy
- 9.1.3.1. Selective Estrogen - Receptor Modulators
- 9.1.3.2. Aromatase Inhibitors
- 9.1.3.3. Other Hormonal Therapies
- 9.1.4. Chemotherapy
- 9.1.4.1. Taxanes
- 9.1.4.2. Anthracyclines
- 9.1.4.3. Anti-metabolites
- 9.1.4.4. Alkylating Agents
- 9.1.4.5. Epothilones
- 9.1. Market Analysis, Insights and Forecast - by Therapy
- 10. South America Breast Cancer Therapy Market Analysis, Insights and Forecast, 2019-2031
- 10.1. Market Analysis, Insights and Forecast - by Therapy
- 10.1.1. Radiation Therapy
- 10.1.2. Targeted Therapy
- 10.1.2.1. Herceptin
- 10.1.2.2. Tykerb (Lapatinib)
- 10.1.2.3. Afinitor
- 10.1.2.4. Other Targeted Therapies
- 10.1.3. Hormonal Therapy
- 10.1.3.1. Selective Estrogen - Receptor Modulators
- 10.1.3.2. Aromatase Inhibitors
- 10.1.3.3. Other Hormonal Therapies
- 10.1.4. Chemotherapy
- 10.1.4.1. Taxanes
- 10.1.4.2. Anthracyclines
- 10.1.4.3. Anti-metabolites
- 10.1.4.4. Alkylating Agents
- 10.1.4.5. Epothilones
- 10.1. Market Analysis, Insights and Forecast - by Therapy
- 11. North America Breast Cancer Therapy Market Analysis, Insights and Forecast, 2019-2031
- 11.1. Market Analysis, Insights and Forecast - By Country/Sub-region
- 11.1.1. undefined
- 12. Europe Breast Cancer Therapy Market Analysis, Insights and Forecast, 2019-2031
- 12.1. Market Analysis, Insights and Forecast - By Country/Sub-region
- 12.1.1. undefined
- 13. Asia Pacific Breast Cancer Therapy Market Analysis, Insights and Forecast, 2019-2031
- 13.1. Market Analysis, Insights and Forecast - By Country/Sub-region
- 13.1.1. undefined
- 14. Middle East and Africa Breast Cancer Therapy Market Analysis, Insights and Forecast, 2019-2031
- 14.1. Market Analysis, Insights and Forecast - By Country/Sub-region
- 14.1.1. undefined
- 15. South America Breast Cancer Therapy Market Analysis, Insights and Forecast, 2019-2031
- 15.1. Market Analysis, Insights and Forecast - By Country/Sub-region
- 15.1.1. undefined
- 16. Competitive Analysis
- 16.1. Global Market Share Analysis 2024
- 16.2. Company Profiles
- 16.2.1 Baxter Healthcare Corporation
- 16.2.1.1. Overview
- 16.2.1.2. Products
- 16.2.1.3. SWOT Analysis
- 16.2.1.4. Recent Developments
- 16.2.1.5. Financials (Based on Availability)
- 16.2.2 Novartis AG
- 16.2.2.1. Overview
- 16.2.2.2. Products
- 16.2.2.3. SWOT Analysis
- 16.2.2.4. Recent Developments
- 16.2.2.5. Financials (Based on Availability)
- 16.2.3 Genentech
- 16.2.3.1. Overview
- 16.2.3.2. Products
- 16.2.3.3. SWOT Analysis
- 16.2.3.4. Recent Developments
- 16.2.3.5. Financials (Based on Availability)
- 16.2.4 Hikma Pharmaceuticals
- 16.2.4.1. Overview
- 16.2.4.2. Products
- 16.2.4.3. SWOT Analysis
- 16.2.4.4. Recent Developments
- 16.2.4.5. Financials (Based on Availability)
- 16.2.5 AstraZeneca PLC
- 16.2.5.1. Overview
- 16.2.5.2. Products
- 16.2.5.3. SWOT Analysis
- 16.2.5.4. Recent Developments
- 16.2.5.5. Financials (Based on Availability)
- 16.2.6 FRESENIUS KABI
- 16.2.6.1. Overview
- 16.2.6.2. Products
- 16.2.6.3. SWOT Analysis
- 16.2.6.4. Recent Developments
- 16.2.6.5. Financials (Based on Availability)
- 16.2.7 Eli Lilly and Company
- 16.2.7.1. Overview
- 16.2.7.2. Products
- 16.2.7.3. SWOT Analysis
- 16.2.7.4. Recent Developments
- 16.2.7.5. Financials (Based on Availability)
- 16.2.8 Celltrion Healthcare
- 16.2.8.1. Overview
- 16.2.8.2. Products
- 16.2.8.3. SWOT Analysis
- 16.2.8.4. Recent Developments
- 16.2.8.5. Financials (Based on Availability)
- 16.2.9 Teva Pharmaceutical Industries Ltd
- 16.2.9.1. Overview
- 16.2.9.2. Products
- 16.2.9.3. SWOT Analysis
- 16.2.9.4. Recent Developments
- 16.2.9.5. Financials (Based on Availability)
- 16.2.10 Viatris Inc
- 16.2.10.1. Overview
- 16.2.10.2. Products
- 16.2.10.3. SWOT Analysis
- 16.2.10.4. Recent Developments
- 16.2.10.5. Financials (Based on Availability)
- 16.2.11 Halozyme Inc
- 16.2.11.1. Overview
- 16.2.11.2. Products
- 16.2.11.3. SWOT Analysis
- 16.2.11.4. Recent Developments
- 16.2.11.5. Financials (Based on Availability)
- 16.2.12 Eisai Co Ltd
- 16.2.12.1. Overview
- 16.2.12.2. Products
- 16.2.12.3. SWOT Analysis
- 16.2.12.4. Recent Developments
- 16.2.12.5. Financials (Based on Availability)
- 16.2.13 Bristol-Myers Squibb Company
- 16.2.13.1. Overview
- 16.2.13.2. Products
- 16.2.13.3. SWOT Analysis
- 16.2.13.4. Recent Developments
- 16.2.13.5. Financials (Based on Availability)
- 16.2.14 GlaxoSmithKline PLC
- 16.2.14.1. Overview
- 16.2.14.2. Products
- 16.2.14.3. SWOT Analysis
- 16.2.14.4. Recent Developments
- 16.2.14.5. Financials (Based on Availability)
- 16.2.15 Pfizer Inc
- 16.2.15.1. Overview
- 16.2.15.2. Products
- 16.2.15.3. SWOT Analysis
- 16.2.15.4. Recent Developments
- 16.2.15.5. Financials (Based on Availability)
- 16.2.1 Baxter Healthcare Corporation
List of Figures
- Figure 1: Global Breast Cancer Therapy Market Revenue Breakdown (Million, %) by Region 2024 & 2032
- Figure 2: Global Breast Cancer Therapy Market Volume Breakdown (K Unit, %) by Region 2024 & 2032
- Figure 3: North America Breast Cancer Therapy Market Revenue (Million), by Country 2024 & 2032
- Figure 4: North America Breast Cancer Therapy Market Volume (K Unit), by Country 2024 & 2032
- Figure 5: North America Breast Cancer Therapy Market Revenue Share (%), by Country 2024 & 2032
- Figure 6: North America Breast Cancer Therapy Market Volume Share (%), by Country 2024 & 2032
- Figure 7: Europe Breast Cancer Therapy Market Revenue (Million), by Country 2024 & 2032
- Figure 8: Europe Breast Cancer Therapy Market Volume (K Unit), by Country 2024 & 2032
- Figure 9: Europe Breast Cancer Therapy Market Revenue Share (%), by Country 2024 & 2032
- Figure 10: Europe Breast Cancer Therapy Market Volume Share (%), by Country 2024 & 2032
- Figure 11: Asia Pacific Breast Cancer Therapy Market Revenue (Million), by Country 2024 & 2032
- Figure 12: Asia Pacific Breast Cancer Therapy Market Volume (K Unit), by Country 2024 & 2032
- Figure 13: Asia Pacific Breast Cancer Therapy Market Revenue Share (%), by Country 2024 & 2032
- Figure 14: Asia Pacific Breast Cancer Therapy Market Volume Share (%), by Country 2024 & 2032
- Figure 15: Middle East and Africa Breast Cancer Therapy Market Revenue (Million), by Country 2024 & 2032
- Figure 16: Middle East and Africa Breast Cancer Therapy Market Volume (K Unit), by Country 2024 & 2032
- Figure 17: Middle East and Africa Breast Cancer Therapy Market Revenue Share (%), by Country 2024 & 2032
- Figure 18: Middle East and Africa Breast Cancer Therapy Market Volume Share (%), by Country 2024 & 2032
- Figure 19: South America Breast Cancer Therapy Market Revenue (Million), by Country 2024 & 2032
- Figure 20: South America Breast Cancer Therapy Market Volume (K Unit), by Country 2024 & 2032
- Figure 21: South America Breast Cancer Therapy Market Revenue Share (%), by Country 2024 & 2032
- Figure 22: South America Breast Cancer Therapy Market Volume Share (%), by Country 2024 & 2032
- Figure 23: North America Breast Cancer Therapy Market Revenue (Million), by Therapy 2024 & 2032
- Figure 24: North America Breast Cancer Therapy Market Volume (K Unit), by Therapy 2024 & 2032
- Figure 25: North America Breast Cancer Therapy Market Revenue Share (%), by Therapy 2024 & 2032
- Figure 26: North America Breast Cancer Therapy Market Volume Share (%), by Therapy 2024 & 2032
- Figure 27: North America Breast Cancer Therapy Market Revenue (Million), by Country 2024 & 2032
- Figure 28: North America Breast Cancer Therapy Market Volume (K Unit), by Country 2024 & 2032
- Figure 29: North America Breast Cancer Therapy Market Revenue Share (%), by Country 2024 & 2032
- Figure 30: North America Breast Cancer Therapy Market Volume Share (%), by Country 2024 & 2032
- Figure 31: Europe Breast Cancer Therapy Market Revenue (Million), by Therapy 2024 & 2032
- Figure 32: Europe Breast Cancer Therapy Market Volume (K Unit), by Therapy 2024 & 2032
- Figure 33: Europe Breast Cancer Therapy Market Revenue Share (%), by Therapy 2024 & 2032
- Figure 34: Europe Breast Cancer Therapy Market Volume Share (%), by Therapy 2024 & 2032
- Figure 35: Europe Breast Cancer Therapy Market Revenue (Million), by Country 2024 & 2032
- Figure 36: Europe Breast Cancer Therapy Market Volume (K Unit), by Country 2024 & 2032
- Figure 37: Europe Breast Cancer Therapy Market Revenue Share (%), by Country 2024 & 2032
- Figure 38: Europe Breast Cancer Therapy Market Volume Share (%), by Country 2024 & 2032
- Figure 39: Asia Pacific Breast Cancer Therapy Market Revenue (Million), by Therapy 2024 & 2032
- Figure 40: Asia Pacific Breast Cancer Therapy Market Volume (K Unit), by Therapy 2024 & 2032
- Figure 41: Asia Pacific Breast Cancer Therapy Market Revenue Share (%), by Therapy 2024 & 2032
- Figure 42: Asia Pacific Breast Cancer Therapy Market Volume Share (%), by Therapy 2024 & 2032
- Figure 43: Asia Pacific Breast Cancer Therapy Market Revenue (Million), by Country 2024 & 2032
- Figure 44: Asia Pacific Breast Cancer Therapy Market Volume (K Unit), by Country 2024 & 2032
- Figure 45: Asia Pacific Breast Cancer Therapy Market Revenue Share (%), by Country 2024 & 2032
- Figure 46: Asia Pacific Breast Cancer Therapy Market Volume Share (%), by Country 2024 & 2032
- Figure 47: Middle East and Africa Breast Cancer Therapy Market Revenue (Million), by Therapy 2024 & 2032
- Figure 48: Middle East and Africa Breast Cancer Therapy Market Volume (K Unit), by Therapy 2024 & 2032
- Figure 49: Middle East and Africa Breast Cancer Therapy Market Revenue Share (%), by Therapy 2024 & 2032
- Figure 50: Middle East and Africa Breast Cancer Therapy Market Volume Share (%), by Therapy 2024 & 2032
- Figure 51: Middle East and Africa Breast Cancer Therapy Market Revenue (Million), by Country 2024 & 2032
- Figure 52: Middle East and Africa Breast Cancer Therapy Market Volume (K Unit), by Country 2024 & 2032
- Figure 53: Middle East and Africa Breast Cancer Therapy Market Revenue Share (%), by Country 2024 & 2032
- Figure 54: Middle East and Africa Breast Cancer Therapy Market Volume Share (%), by Country 2024 & 2032
- Figure 55: South America Breast Cancer Therapy Market Revenue (Million), by Therapy 2024 & 2032
- Figure 56: South America Breast Cancer Therapy Market Volume (K Unit), by Therapy 2024 & 2032
- Figure 57: South America Breast Cancer Therapy Market Revenue Share (%), by Therapy 2024 & 2032
- Figure 58: South America Breast Cancer Therapy Market Volume Share (%), by Therapy 2024 & 2032
- Figure 59: South America Breast Cancer Therapy Market Revenue (Million), by Country 2024 & 2032
- Figure 60: South America Breast Cancer Therapy Market Volume (K Unit), by Country 2024 & 2032
- Figure 61: South America Breast Cancer Therapy Market Revenue Share (%), by Country 2024 & 2032
- Figure 62: South America Breast Cancer Therapy Market Volume Share (%), by Country 2024 & 2032
List of Tables
- Table 1: Global Breast Cancer Therapy Market Revenue Million Forecast, by Region 2019 & 2032
- Table 2: Global Breast Cancer Therapy Market Volume K Unit Forecast, by Region 2019 & 2032
- Table 3: Global Breast Cancer Therapy Market Revenue Million Forecast, by Therapy 2019 & 2032
- Table 4: Global Breast Cancer Therapy Market Volume K Unit Forecast, by Therapy 2019 & 2032
- Table 5: Global Breast Cancer Therapy Market Revenue Million Forecast, by Region 2019 & 2032
- Table 6: Global Breast Cancer Therapy Market Volume K Unit Forecast, by Region 2019 & 2032
- Table 7: Global Breast Cancer Therapy Market Revenue Million Forecast, by Country 2019 & 2032
- Table 8: Global Breast Cancer Therapy Market Volume K Unit Forecast, by Country 2019 & 2032
- Table 9: Global Breast Cancer Therapy Market Revenue Million Forecast, by Country 2019 & 2032
- Table 10: Global Breast Cancer Therapy Market Volume K Unit Forecast, by Country 2019 & 2032
- Table 11: Global Breast Cancer Therapy Market Revenue Million Forecast, by Country 2019 & 2032
- Table 12: Global Breast Cancer Therapy Market Volume K Unit Forecast, by Country 2019 & 2032
- Table 13: Global Breast Cancer Therapy Market Revenue Million Forecast, by Country 2019 & 2032
- Table 14: Global Breast Cancer Therapy Market Volume K Unit Forecast, by Country 2019 & 2032
- Table 15: Global Breast Cancer Therapy Market Revenue Million Forecast, by Country 2019 & 2032
- Table 16: Global Breast Cancer Therapy Market Volume K Unit Forecast, by Country 2019 & 2032
- Table 17: Global Breast Cancer Therapy Market Revenue Million Forecast, by Therapy 2019 & 2032
- Table 18: Global Breast Cancer Therapy Market Volume K Unit Forecast, by Therapy 2019 & 2032
- Table 19: Global Breast Cancer Therapy Market Revenue Million Forecast, by Country 2019 & 2032
- Table 20: Global Breast Cancer Therapy Market Volume K Unit Forecast, by Country 2019 & 2032
- Table 21: United States Breast Cancer Therapy Market Revenue (Million) Forecast, by Application 2019 & 2032
- Table 22: United States Breast Cancer Therapy Market Volume (K Unit) Forecast, by Application 2019 & 2032
- Table 23: Canada Breast Cancer Therapy Market Revenue (Million) Forecast, by Application 2019 & 2032
- Table 24: Canada Breast Cancer Therapy Market Volume (K Unit) Forecast, by Application 2019 & 2032
- Table 25: Mexico Breast Cancer Therapy Market Revenue (Million) Forecast, by Application 2019 & 2032
- Table 26: Mexico Breast Cancer Therapy Market Volume (K Unit) Forecast, by Application 2019 & 2032
- Table 27: Global Breast Cancer Therapy Market Revenue Million Forecast, by Therapy 2019 & 2032
- Table 28: Global Breast Cancer Therapy Market Volume K Unit Forecast, by Therapy 2019 & 2032
- Table 29: Global Breast Cancer Therapy Market Revenue Million Forecast, by Country 2019 & 2032
- Table 30: Global Breast Cancer Therapy Market Volume K Unit Forecast, by Country 2019 & 2032
- Table 31: Germany Breast Cancer Therapy Market Revenue (Million) Forecast, by Application 2019 & 2032
- Table 32: Germany Breast Cancer Therapy Market Volume (K Unit) Forecast, by Application 2019 & 2032
- Table 33: United Kingdom Breast Cancer Therapy Market Revenue (Million) Forecast, by Application 2019 & 2032
- Table 34: United Kingdom Breast Cancer Therapy Market Volume (K Unit) Forecast, by Application 2019 & 2032
- Table 35: France Breast Cancer Therapy Market Revenue (Million) Forecast, by Application 2019 & 2032
- Table 36: France Breast Cancer Therapy Market Volume (K Unit) Forecast, by Application 2019 & 2032
- Table 37: Italy Breast Cancer Therapy Market Revenue (Million) Forecast, by Application 2019 & 2032
- Table 38: Italy Breast Cancer Therapy Market Volume (K Unit) Forecast, by Application 2019 & 2032
- Table 39: Spain Breast Cancer Therapy Market Revenue (Million) Forecast, by Application 2019 & 2032
- Table 40: Spain Breast Cancer Therapy Market Volume (K Unit) Forecast, by Application 2019 & 2032
- Table 41: Rest of Europe Breast Cancer Therapy Market Revenue (Million) Forecast, by Application 2019 & 2032
- Table 42: Rest of Europe Breast Cancer Therapy Market Volume (K Unit) Forecast, by Application 2019 & 2032
- Table 43: Global Breast Cancer Therapy Market Revenue Million Forecast, by Therapy 2019 & 2032
- Table 44: Global Breast Cancer Therapy Market Volume K Unit Forecast, by Therapy 2019 & 2032
- Table 45: Global Breast Cancer Therapy Market Revenue Million Forecast, by Country 2019 & 2032
- Table 46: Global Breast Cancer Therapy Market Volume K Unit Forecast, by Country 2019 & 2032
- Table 47: China Breast Cancer Therapy Market Revenue (Million) Forecast, by Application 2019 & 2032
- Table 48: China Breast Cancer Therapy Market Volume (K Unit) Forecast, by Application 2019 & 2032
- Table 49: Japan Breast Cancer Therapy Market Revenue (Million) Forecast, by Application 2019 & 2032
- Table 50: Japan Breast Cancer Therapy Market Volume (K Unit) Forecast, by Application 2019 & 2032
- Table 51: India Breast Cancer Therapy Market Revenue (Million) Forecast, by Application 2019 & 2032
- Table 52: India Breast Cancer Therapy Market Volume (K Unit) Forecast, by Application 2019 & 2032
- Table 53: Australia Breast Cancer Therapy Market Revenue (Million) Forecast, by Application 2019 & 2032
- Table 54: Australia Breast Cancer Therapy Market Volume (K Unit) Forecast, by Application 2019 & 2032
- Table 55: South Korea Breast Cancer Therapy Market Revenue (Million) Forecast, by Application 2019 & 2032
- Table 56: South Korea Breast Cancer Therapy Market Volume (K Unit) Forecast, by Application 2019 & 2032
- Table 57: Rest of Asia Pacific Breast Cancer Therapy Market Revenue (Million) Forecast, by Application 2019 & 2032
- Table 58: Rest of Asia Pacific Breast Cancer Therapy Market Volume (K Unit) Forecast, by Application 2019 & 2032
- Table 59: Global Breast Cancer Therapy Market Revenue Million Forecast, by Therapy 2019 & 2032
- Table 60: Global Breast Cancer Therapy Market Volume K Unit Forecast, by Therapy 2019 & 2032
- Table 61: Global Breast Cancer Therapy Market Revenue Million Forecast, by Country 2019 & 2032
- Table 62: Global Breast Cancer Therapy Market Volume K Unit Forecast, by Country 2019 & 2032
- Table 63: GCC Breast Cancer Therapy Market Revenue (Million) Forecast, by Application 2019 & 2032
- Table 64: GCC Breast Cancer Therapy Market Volume (K Unit) Forecast, by Application 2019 & 2032
- Table 65: South Africa Breast Cancer Therapy Market Revenue (Million) Forecast, by Application 2019 & 2032
- Table 66: South Africa Breast Cancer Therapy Market Volume (K Unit) Forecast, by Application 2019 & 2032
- Table 67: Rest of Middle East and Africa Breast Cancer Therapy Market Revenue (Million) Forecast, by Application 2019 & 2032
- Table 68: Rest of Middle East and Africa Breast Cancer Therapy Market Volume (K Unit) Forecast, by Application 2019 & 2032
- Table 69: Global Breast Cancer Therapy Market Revenue Million Forecast, by Therapy 2019 & 2032
- Table 70: Global Breast Cancer Therapy Market Volume K Unit Forecast, by Therapy 2019 & 2032
- Table 71: Global Breast Cancer Therapy Market Revenue Million Forecast, by Country 2019 & 2032
- Table 72: Global Breast Cancer Therapy Market Volume K Unit Forecast, by Country 2019 & 2032
- Table 73: Brazil Breast Cancer Therapy Market Revenue (Million) Forecast, by Application 2019 & 2032
- Table 74: Brazil Breast Cancer Therapy Market Volume (K Unit) Forecast, by Application 2019 & 2032
- Table 75: Argentina Breast Cancer Therapy Market Revenue (Million) Forecast, by Application 2019 & 2032
- Table 76: Argentina Breast Cancer Therapy Market Volume (K Unit) Forecast, by Application 2019 & 2032
- Table 77: Rest of South America Breast Cancer Therapy Market Revenue (Million) Forecast, by Application 2019 & 2032
- Table 78: Rest of South America Breast Cancer Therapy Market Volume (K Unit) Forecast, by Application 2019 & 2032
Frequently Asked Questions
1. What is the projected Compound Annual Growth Rate (CAGR) of the Breast Cancer Therapy Market?
The projected CAGR is approximately 8.30%.
2. Which companies are prominent players in the Breast Cancer Therapy Market?
Key companies in the market include Baxter Healthcare Corporation, Novartis AG, Genentech, Hikma Pharmaceuticals, AstraZeneca PLC, FRESENIUS KABI, Eli Lilly and Company, Celltrion Healthcare, Teva Pharmaceutical Industries Ltd, Viatris Inc, Halozyme Inc, Eisai Co Ltd, Bristol-Myers Squibb Company, GlaxoSmithKline PLC, Pfizer Inc.
3. What are the main segments of the Breast Cancer Therapy Market?
The market segments include Therapy.
4. Can you provide details about the market size?
The market size is estimated to be USD XX Million as of 2022.
5. What are some drivers contributing to market growth?
High Incidence and Prevalence Rate of Breast Cancer; Increasing Investments in R&D; Advancements in Cancer Biology and Pharmacology. Promoting Drug Development.
6. What are the notable trends driving market growth?
Chemotherapy Segment Expected to Witness High Growth Over the Forecast Period.
7. Are there any restraints impacting market growth?
Risk of Adverse Effects of Radiation Exposure; Stringent Regulatory Scenarios.
8. Can you provide examples of recent developments in the market?
In September 2022, Novartis announced results from a new pooled exploratory analysis across the entire MONALEESA Phase III program, confirming nearly one year of additional overall survival (OS) benefit in a subgroup of patients with aggressive forms of hormone receptor-positive, human epidermal growth factor receptor-2 negative (HR+/HER2-) advanced breast cancer (aBC).
9. What pricing options are available for accessing the report?
Pricing options include single-user, multi-user, and enterprise licenses priced at USD 4750, USD 5250, and USD 8750 respectively.
10. Is the market size provided in terms of value or volume?
The market size is provided in terms of value, measured in Million and volume, measured in K Unit.
11. Are there any specific market keywords associated with the report?
Yes, the market keyword associated with the report is "Breast Cancer Therapy Market," which aids in identifying and referencing the specific market segment covered.
12. How do I determine which pricing option suits my needs best?
The pricing options vary based on user requirements and access needs. Individual users may opt for single-user licenses, while businesses requiring broader access may choose multi-user or enterprise licenses for cost-effective access to the report.
13. Are there any additional resources or data provided in the Breast Cancer Therapy Market report?
While the report offers comprehensive insights, it's advisable to review the specific contents or supplementary materials provided to ascertain if additional resources or data are available.
14. How can I stay updated on further developments or reports in the Breast Cancer Therapy Market?
To stay informed about further developments, trends, and reports in the Breast Cancer Therapy Market, consider subscribing to industry newsletters, following relevant companies and organizations, or regularly checking reputable industry news sources and publications.
Methodology
Step 1 - Identification of Relevant Samples Size from Population Database


Step 2 - Approaches for Defining Global Market Size (Value, Volume* & Price*)

Note*: In applicable scenarios
Step 3 - Data Sources
Primary Research
- Web Analytics
- Survey Reports
- Research Institute
- Latest Research Reports
- Opinion Leaders
Secondary Research
- Annual Reports
- White Paper
- Latest Press Release
- Industry Association
- Paid Database
- Investor Presentations

Step 4 - Data Triangulation
Involves using different sources of information in order to increase the validity of a study
These sources are likely to be stakeholders in a program - participants, other researchers, program staff, other community members, and so on.
Then we put all data in single framework & apply various statistical tools to find out the dynamic on the market.
During the analysis stage, feedback from the stakeholder groups would be compared to determine areas of agreement as well as areas of divergence


