
Key Insights
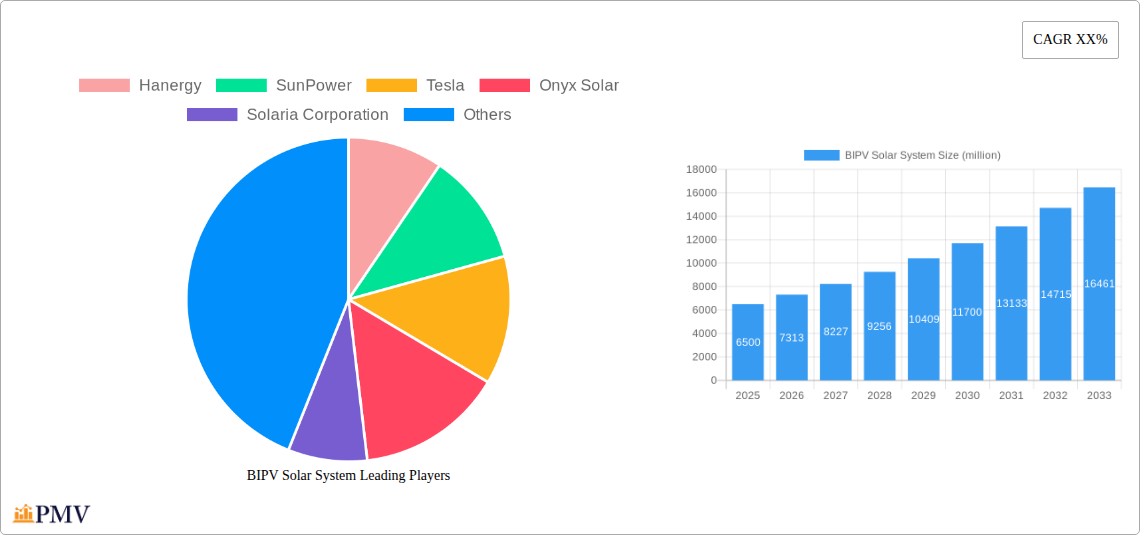
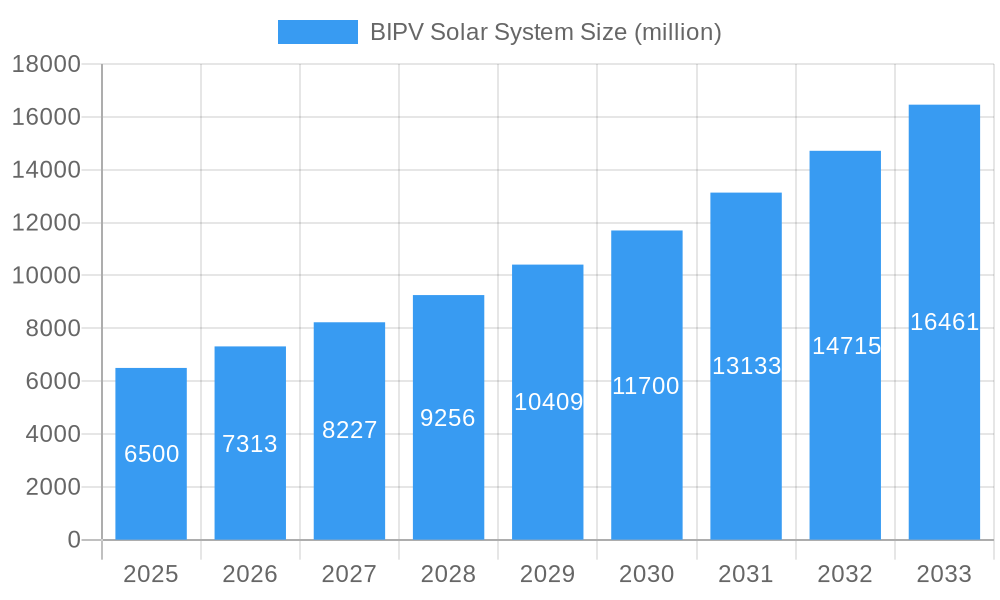
The Building Integrated Photovoltaics (BIPV) Solar System market is poised for substantial expansion, estimated at a current market size of approximately $6,500 million in 2025, with a projected Compound Annual Growth Rate (CAGR) of around 12.5% over the forecast period extending to 2033. This robust growth is propelled by an increasing global emphasis on sustainable construction practices, stringent government regulations promoting renewable energy adoption, and the evolving architectural landscape that embraces aesthetically integrated solar solutions. Drivers such as the rising demand for net-zero energy buildings, coupled with the technological advancements in solar materials and installation techniques, are fueling this upward trajectory. The market is segmented by application, with Residential Buildings and Commercial Buildings emerging as key growth areas due to increasing awareness of energy independence and operational cost savings. Industrial Facilities and Public Infrastructure also represent significant, albeit more nascent, adoption segments.
BIPV Solar System Market Size (In Billion)

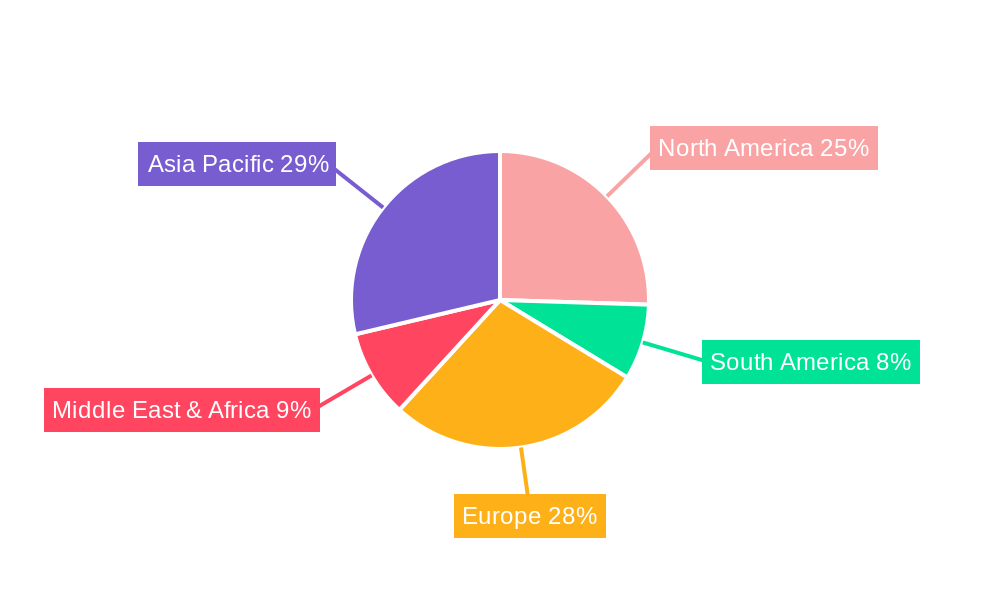
The BIPV market is experiencing a transformative shift driven by innovations in solar technology, leading to the development of diverse product types like Solar Roof Shingles, Solar Windows, Solar Facades, and Solar Canopies. These offerings not only generate clean energy but also contribute to the building's aesthetic appeal and structural integrity, overcoming traditional solar panel limitations. Restraints, such as higher upfront installation costs compared to conventional building materials and a need for specialized installation expertise, are gradually being addressed through technological maturation and economies of scale. Emerging trends like smart grid integration, advancements in energy storage solutions, and the increasing demand for durable and aesthetically pleasing solar building materials are expected to further catalyze market penetration. Geographically, Asia Pacific, led by China and India, is anticipated to dominate the market share, owing to supportive government policies and a rapidly expanding construction sector. North America and Europe follow suit, driven by strong environmental regulations and a high consumer appetite for green technologies.
BIPV Solar System Company Market Share
BIPV Solar System Market: Comprehensive Analysis and Future Outlook (2019-2033)
This in-depth report offers a detailed examination of the Building Integrated Photovoltaic (BIPV) Solar System market, providing actionable insights for stakeholders. Leveraging extensive market data from 2019 through 2033, with a base year of 2025, this report is designed to equip industry professionals with the knowledge to navigate this rapidly evolving sector. We delve into market structure, competitive dynamics, emerging trends, dominant segments, product innovations, key growth drivers, challenges, leading players, significant developments, and a strategic outlook. Our analysis covers applications across Residential Buildings, Commercial Buildings, Industrial Facilities, and Public Infrastructure, alongside product types including Solar Roof Shingles, Solar Windows, Solar Facades, and Solar Canopies.
BIPV Solar System Market Structure & Competitive Dynamics
The BIPV solar system market exhibits a dynamic structure with a growing number of participants driving innovation and competition. Market concentration varies across regions, with some areas dominated by a few key players while others foster a more fragmented landscape. The innovation ecosystem is robust, fueled by continuous research and development in materials science, energy efficiency, and aesthetic integration. Regulatory frameworks play a crucial role in shaping market entry and adoption, with government incentives, building codes, and sustainability mandates influencing investment decisions. Product substitutes, such as traditional construction materials and standalone solar panels, are evolving to compete with the integrated nature of BIPV. End-user trends are increasingly favoring sustainable and aesthetically pleasing building solutions, pushing demand for BIPV systems that offer both energy generation and architectural enhancement. Mergers and acquisitions (M&A) activities are a significant aspect of market consolidation, with strategic partnerships and acquisitions valued in the tens of millions annually, aimed at expanding market reach, acquiring technological expertise, and diversifying product portfolios. For instance, companies are actively pursuing acquisitions to gain access to advanced thin-film BIPV technologies. Market share is a key indicator, with leading companies such as Hanergy and SunPower holding substantial portions in specific segments and regions.
BIPV Solar System Industry Trends & Insights
The BIPV solar system industry is experiencing remarkable growth, propelled by a confluence of technological advancements, growing environmental consciousness, and supportive government policies. The global market is projected to witness a Compound Annual Growth Rate (CAGR) of approximately 18% from 2025 to 2033, a testament to its burgeoning potential. This expansion is largely driven by increasing awareness and adoption of renewable energy solutions, coupled with the dual benefits of energy generation and architectural integration offered by BIPV. Technological disruptions are at the forefront, with ongoing improvements in photovoltaic cell efficiency, energy storage solutions, and the development of novel BIPV materials such as transparent solar cells and flexible solar films. These advancements are making BIPV systems more cost-effective, aesthetically versatile, and easier to integrate into various building designs. Consumer preferences are shifting towards sustainable and energy-efficient buildings, with homeowners and businesses actively seeking solutions that reduce their carbon footprint and lower energy bills. The aesthetic appeal of BIPV is also a significant factor, as modern designs allow for seamless integration into building envelopes, enhancing architectural beauty rather than detracting from it. Competitive dynamics are intensifying, with both established solar manufacturers and new entrants vying for market share. Companies like Tesla, Onyx Solar, and Solaria Corporation are investing heavily in R&D and expanding their production capacities. The market penetration of BIPV systems is still relatively nascent in many regions, indicating substantial headroom for future growth. Market penetration is expected to reach 10% of new construction by 2030, up from the current 3%. The increasing demand for smart buildings and the drive towards net-zero energy buildings further bolster the prospects for BIPV integration. Furthermore, the development of building-integrated energy management systems is enhancing the value proposition of BIPV by enabling better control and optimization of energy production and consumption. The focus on circular economy principles and the use of recyclable materials in BIPV manufacturing is also gaining traction, aligning with global sustainability goals. The projected market size for BIPV systems is expected to surpass $20,000 million by 2033.
Dominant Markets & Segments in BIPV Solar System
The BIPV solar system market's dominance is dictated by a complex interplay of regional policies, economic incentives, construction trends, and technological readiness.
Leading Regions: Europe, particularly Germany and the Netherlands, currently leads in BIPV adoption due to stringent energy efficiency regulations and a mature solar market. North America, driven by supportive policies and growing demand for sustainable buildings, is a rapidly expanding market. Asia-Pacific, with its massive construction output and increasing focus on renewable energy, presents significant future growth opportunities.
Dominant Applications:
- Commercial Buildings: This segment is a major driver of BIPV market growth. The potential for significant energy savings, corporate sustainability initiatives, and the availability of large surface areas for integration make it highly attractive. Many commercial projects are incorporating BIPV to meet LEED certification requirements and reduce operational costs, contributing an estimated $8,000 million to the market in 2025.
- Residential Buildings: While currently a smaller segment compared to commercial, residential adoption is steadily increasing. The rising cost of electricity, growing environmental awareness among homeowners, and the development of more aesthetically appealing BIPV products are fueling this growth. Innovations in solar roof shingles are particularly appealing to homeowners seeking to replace traditional roofing materials with a functional, energy-generating solution. The residential segment is projected to reach $5,000 million by 2033.
- Industrial Facilities: Large industrial complexes offer substantial potential for BIPV integration, particularly through large-scale solar canopies and facades. The high energy consumption of these facilities makes BIPV an attractive investment for reducing operating expenses and improving energy independence. This segment is expected to be worth $4,000 million in 2025.
- Public Infrastructure: This segment includes applications like solar canopies over parking lots, bus shelters, and noise barriers along highways. While still in its early stages, government investments in renewable energy infrastructure are expected to drive growth in this segment, projected to be $3,000 million in 2025.
Dominant Product Types:
- Solar Facades: These are gaining significant traction due to their ability to transform entire building exteriors into energy generators, offering vast application potential and architectural flexibility. Their integration into new builds and retrofits is a key growth driver. The solar facade segment is estimated at $7,000 million in 2025.
- Solar Roof Shingles: Offering a direct replacement for traditional roofing materials, these products are highly desirable for residential and commercial retrofits, blending seamlessly with existing architecture. Their market share is expected to grow considerably. The solar roof shingles segment is estimated at $6,000 million in 2025.
- Solar Windows: These innovative products allow light to pass through while generating electricity, offering a discreet and aesthetically pleasing BIPV solution for high-rise buildings and structures where traditional solar panels are not feasible. The market for solar windows is growing, projected to be $3,000 million in 2025.
- Solar Canopies: Primarily used for carports, walkways, and public spaces, solar canopies provide shade and generate electricity, making them versatile for both public and private infrastructure projects. The solar canopies segment is estimated at $3,000 million in 2025.
BIPV Solar System Product Innovations
Recent BIPV solar system product innovations are significantly enhancing market appeal and performance. Companies are developing highly efficient thin-film photovoltaic cells, transparent solar cells for windows, and flexible solar materials for curved surfaces. Aesthetic integration remains a key focus, with a growing array of colors, textures, and finishes available for solar facades and roof shingles, allowing them to blend seamlessly with traditional building materials. Advancements in energy storage integration are also crucial, enabling BIPV systems to provide reliable power even when the sun isn't shining. These innovations are not only improving energy generation capabilities but also addressing aesthetic concerns and expanding the application range of BIPV solutions.
Report Segmentation & Scope
This comprehensive report segments the BIPV Solar System market across key application and product categories, providing granular analysis for strategic decision-making. The scope encompasses:
Application Segmentation:
- Residential Buildings: Analysis of market penetration, growth projections, and competitive dynamics for BIPV solutions integrated into homes, focusing on residential solar shingles and windows. Market size estimated at $5,000 million by 2033.
- Commercial Buildings: Detailed insights into BIPV adoption in office buildings, retail spaces, and hotels, examining the influence of energy efficiency mandates and corporate sustainability goals. Market size estimated at $8,000 million by 2033.
- Industrial Facilities: Focus on BIPV applications in manufacturing plants and warehouses, including solar facades and canopies, driven by high energy consumption and cost-saving imperatives. Market size estimated at $4,000 million by 2033.
- Public Infrastructure: Examination of BIPV integration in government buildings, transportation hubs, and public amenities like solar canopies over parking lots and bus shelters. Market size estimated at $3,000 million by 2033.
Type Segmentation:
- Solar Roof Shingles: Analysis of market trends, competitive advantages, and adoption rates for BIPV products designed to replace traditional roofing. Growth projections are strong, with a market size estimated at $6,000 million by 2033.
- Solar Windows: Evaluation of the market for transparent photovoltaic cells integrated into windows, focusing on their aesthetic appeal and energy generation potential in urban environments. Market size estimated at $3,000 million by 2033.
- Solar Facades: Comprehensive study of the market for photovoltaic cladding on building exteriors, highlighting design versatility and large-scale application potential. Market size estimated at $7,000 million by 2033.
- Solar Canopies: Assessment of the market for BIPV structures providing shade and power generation over outdoor spaces like parking lots and walkways. Market size estimated at $3,000 million by 2033.
Key Drivers of BIPV Solar System Growth
The BIPV solar system market is propelled by a powerful combination of factors. Government incentives and supportive regulations, such as tax credits, feed-in tariffs, and renewable energy mandates, significantly reduce the upfront cost and improve the return on investment for BIPV installations. Rising electricity prices make energy generation through BIPV increasingly attractive, offering long-term cost savings and energy independence for building owners. Growing environmental awareness and the global push for decarbonization are driving demand for sustainable building solutions, with BIPV offering a tangible way to reduce a building's carbon footprint. Technological advancements in photovoltaic efficiency, material science, and aesthetic integration are making BIPV systems more viable, cost-effective, and visually appealing. Furthermore, the increasing focus on building energy efficiency standards and the concept of net-zero energy buildings creates a direct demand for integrated renewable energy solutions like BIPV.
Challenges in the BIPV Solar System Sector
Despite its promising growth trajectory, the BIPV solar system sector faces several challenges. High upfront installation costs compared to traditional building materials remain a significant barrier, though decreasing with technological advancements and economies of scale. Complex regulatory and permitting processes in some regions can hinder widespread adoption. Limited awareness and understanding among architects, builders, and end-users about the benefits and integration possibilities of BIPV can slow market penetration. Ensuring long-term durability and performance in diverse environmental conditions, along with the availability of skilled labor for installation and maintenance, are crucial considerations. Finally, competition from established rooftop solar solutions and traditional building materials necessitates continuous innovation and cost reduction to maintain market competitiveness. The estimated impact of these challenges could lead to a 15% slower adoption rate in certain markets.
Leading Players in the BIPV Solar System Market
- Hanergy
- SunPower
- Tesla
- Onyx Solar
- Solaria Corporation
- SolTech Energy
- Dow Solar
- MetSolar
- Sinovoltaics Group Limited
- Waaree Energies Ltd
- PLATIO Solar
- Sunket
- Baoding Jiasheng Photovoltaic Technology Co.,Ltd.
- Avenston
- Novergy Solar
Key Developments in BIPV Solar System Sector
- 2023 Q4: SunPower launched a new generation of high-efficiency solar roof tiles with enhanced aesthetic integration capabilities.
- 2024 Q1: Onyx Solar partnered with a major construction firm to integrate BIPV facades into a large-scale commercial development in Spain.
- 2024 Q2: Tesla announced further advancements in its solar roof technology, focusing on improved durability and faster installation times.
- 2024 Q3: Solaria Corporation secured a significant contract for BIPV facade installation on a new mixed-use development in California.
- 2024 Q4: Hanergy showcased its latest advancements in flexible thin-film BIPV for curved building structures.
- 2025 Q1: SolTech Energy reported a 25% increase in BIPV facade projects in the Nordic region.
- 2025 Q2: Dow Solar expanded its BIPV materials research, focusing on next-generation transparent photovoltaic solutions.
- 2025 Q3: MetSolar announced a strategic collaboration to accelerate BIPV adoption in public infrastructure projects.
- 2025 Q4: Sinovoltaics Group Limited reported strong sales growth in their BIPV roof shingle offerings in the Asian market.
- 2026 Q1: Waaree Energies Ltd announced plans to invest $50 million in expanding its BIPV manufacturing capacity.
- 2026 Q2: PLATIO Solar unveiled innovative BIPV solar canopies for urban mobility solutions.
- 2026 Q3: Sunket introduced a cost-effective BIPV solution targeting the residential construction market.
- 2026 Q4: Baoding Jiasheng Photovoltaic Technology Co.,Ltd. expanded its BIPV product line with a focus on high-performance solar windows.
- 2027 Q1: Avenston completed a major BIPV facade project for a landmark skyscraper.
- 2027 Q2: Novergy Solar launched a new range of aesthetically pleasing BIPV solar roof shingles for residential retrofits.
Strategic BIPV Solar System Market Outlook
The strategic outlook for the BIPV solar system market remains exceptionally strong. Future growth will be catalyzed by ongoing technological innovations that enhance efficiency and reduce costs, making BIPV a more competitive and accessible option. The increasing global commitment to sustainability and net-zero buildings will continue to drive demand, particularly in urban centers with high energy consumption and a need for aesthetically integrated renewable solutions. Strategic opportunities lie in developing standardized installation processes, fostering greater collaboration between BIPV manufacturers and the construction industry, and advocating for supportive regulatory frameworks worldwide. Expansion into emerging markets with significant construction activity and a growing focus on renewable energy will also be key growth accelerators. The market is poised for sustained expansion, with BIPV becoming an indispensable component of future sustainable architecture.
BIPV Solar System Segmentation
-
1. Application
- 1.1. Residential Buildings
- 1.2. Commercial Buildings
- 1.3. Industrial Facilities
- 1.4. Public Infrastructure
-
2. Types
- 2.1. Solar Roof Shingles
- 2.2. Solar Windows
- 2.3. Solar Facades
- 2.4. Solar Canopies
BIPV Solar System Segmentation By Geography
-
1. North America
- 1.1. United States
- 1.2. Canada
- 1.3. Mexico
-
2. South America
- 2.1. Brazil
- 2.2. Argentina
- 2.3. Rest of South America
-
3. Europe
- 3.1. United Kingdom
- 3.2. Germany
- 3.3. France
- 3.4. Italy
- 3.5. Spain
- 3.6. Russia
- 3.7. Benelux
- 3.8. Nordics
- 3.9. Rest of Europe
-
4. Middle East & Africa
- 4.1. Turkey
- 4.2. Israel
- 4.3. GCC
- 4.4. North Africa
- 4.5. South Africa
- 4.6. Rest of Middle East & Africa
-
5. Asia Pacific
- 5.1. China
- 5.2. India
- 5.3. Japan
- 5.4. South Korea
- 5.5. ASEAN
- 5.6. Oceania
- 5.7. Rest of Asia Pacific
BIPV Solar System Regional Market Share
Geographic Coverage of BIPV Solar System
BIPV Solar System REPORT HIGHLIGHTS
| Aspects | Details |
|---|---|
| Study Period | 2020-2034 |
| Base Year | 2025 |
| Estimated Year | 2026 |
| Forecast Period | 2026-2034 |
| Historical Period | 2020-2025 |
| Growth Rate | CAGR of XX% from 2020-2034 |
| Segmentation |
|
Table of Contents
- 1. Introduction
- 1.1. Research Scope
- 1.2. Market Segmentation
- 1.3. Research Methodology
- 1.4. Definitions and Assumptions
- 2. Executive Summary
- 2.1. Introduction
- 3. Market Dynamics
- 3.1. Introduction
- 3.2. Market Drivers
- 3.3. Market Restrains
- 3.4. Market Trends
- 4. Market Factor Analysis
- 4.1. Porters Five Forces
- 4.2. Supply/Value Chain
- 4.3. PESTEL analysis
- 4.4. Market Entropy
- 4.5. Patent/Trademark Analysis
- 5. Global BIPV Solar System Analysis, Insights and Forecast, 2020-2032
- 5.1. Market Analysis, Insights and Forecast - by Application
- 5.1.1. Residential Buildings
- 5.1.2. Commercial Buildings
- 5.1.3. Industrial Facilities
- 5.1.4. Public Infrastructure
- 5.2. Market Analysis, Insights and Forecast - by Types
- 5.2.1. Solar Roof Shingles
- 5.2.2. Solar Windows
- 5.2.3. Solar Facades
- 5.2.4. Solar Canopies
- 5.3. Market Analysis, Insights and Forecast - by Region
- 5.3.1. North America
- 5.3.2. South America
- 5.3.3. Europe
- 5.3.4. Middle East & Africa
- 5.3.5. Asia Pacific
- 5.1. Market Analysis, Insights and Forecast - by Application
- 6. North America BIPV Solar System Analysis, Insights and Forecast, 2020-2032
- 6.1. Market Analysis, Insights and Forecast - by Application
- 6.1.1. Residential Buildings
- 6.1.2. Commercial Buildings
- 6.1.3. Industrial Facilities
- 6.1.4. Public Infrastructure
- 6.2. Market Analysis, Insights and Forecast - by Types
- 6.2.1. Solar Roof Shingles
- 6.2.2. Solar Windows
- 6.2.3. Solar Facades
- 6.2.4. Solar Canopies
- 6.1. Market Analysis, Insights and Forecast - by Application
- 7. South America BIPV Solar System Analysis, Insights and Forecast, 2020-2032
- 7.1. Market Analysis, Insights and Forecast - by Application
- 7.1.1. Residential Buildings
- 7.1.2. Commercial Buildings
- 7.1.3. Industrial Facilities
- 7.1.4. Public Infrastructure
- 7.2. Market Analysis, Insights and Forecast - by Types
- 7.2.1. Solar Roof Shingles
- 7.2.2. Solar Windows
- 7.2.3. Solar Facades
- 7.2.4. Solar Canopies
- 7.1. Market Analysis, Insights and Forecast - by Application
- 8. Europe BIPV Solar System Analysis, Insights and Forecast, 2020-2032
- 8.1. Market Analysis, Insights and Forecast - by Application
- 8.1.1. Residential Buildings
- 8.1.2. Commercial Buildings
- 8.1.3. Industrial Facilities
- 8.1.4. Public Infrastructure
- 8.2. Market Analysis, Insights and Forecast - by Types
- 8.2.1. Solar Roof Shingles
- 8.2.2. Solar Windows
- 8.2.3. Solar Facades
- 8.2.4. Solar Canopies
- 8.1. Market Analysis, Insights and Forecast - by Application
- 9. Middle East & Africa BIPV Solar System Analysis, Insights and Forecast, 2020-2032
- 9.1. Market Analysis, Insights and Forecast - by Application
- 9.1.1. Residential Buildings
- 9.1.2. Commercial Buildings
- 9.1.3. Industrial Facilities
- 9.1.4. Public Infrastructure
- 9.2. Market Analysis, Insights and Forecast - by Types
- 9.2.1. Solar Roof Shingles
- 9.2.2. Solar Windows
- 9.2.3. Solar Facades
- 9.2.4. Solar Canopies
- 9.1. Market Analysis, Insights and Forecast - by Application
- 10. Asia Pacific BIPV Solar System Analysis, Insights and Forecast, 2020-2032
- 10.1. Market Analysis, Insights and Forecast - by Application
- 10.1.1. Residential Buildings
- 10.1.2. Commercial Buildings
- 10.1.3. Industrial Facilities
- 10.1.4. Public Infrastructure
- 10.2. Market Analysis, Insights and Forecast - by Types
- 10.2.1. Solar Roof Shingles
- 10.2.2. Solar Windows
- 10.2.3. Solar Facades
- 10.2.4. Solar Canopies
- 10.1. Market Analysis, Insights and Forecast - by Application
- 11. Competitive Analysis
- 11.1. Global Market Share Analysis 2025
- 11.2. Company Profiles
- 11.2.1 Hanergy
- 11.2.1.1. Overview
- 11.2.1.2. Products
- 11.2.1.3. SWOT Analysis
- 11.2.1.4. Recent Developments
- 11.2.1.5. Financials (Based on Availability)
- 11.2.2 SunPower
- 11.2.2.1. Overview
- 11.2.2.2. Products
- 11.2.2.3. SWOT Analysis
- 11.2.2.4. Recent Developments
- 11.2.2.5. Financials (Based on Availability)
- 11.2.3 Tesla
- 11.2.3.1. Overview
- 11.2.3.2. Products
- 11.2.3.3. SWOT Analysis
- 11.2.3.4. Recent Developments
- 11.2.3.5. Financials (Based on Availability)
- 11.2.4 Onyx Solar
- 11.2.4.1. Overview
- 11.2.4.2. Products
- 11.2.4.3. SWOT Analysis
- 11.2.4.4. Recent Developments
- 11.2.4.5. Financials (Based on Availability)
- 11.2.5 Solaria Corporation
- 11.2.5.1. Overview
- 11.2.5.2. Products
- 11.2.5.3. SWOT Analysis
- 11.2.5.4. Recent Developments
- 11.2.5.5. Financials (Based on Availability)
- 11.2.6 SolTech Energy
- 11.2.6.1. Overview
- 11.2.6.2. Products
- 11.2.6.3. SWOT Analysis
- 11.2.6.4. Recent Developments
- 11.2.6.5. Financials (Based on Availability)
- 11.2.7 Dow Solar
- 11.2.7.1. Overview
- 11.2.7.2. Products
- 11.2.7.3. SWOT Analysis
- 11.2.7.4. Recent Developments
- 11.2.7.5. Financials (Based on Availability)
- 11.2.8 MetSolar
- 11.2.8.1. Overview
- 11.2.8.2. Products
- 11.2.8.3. SWOT Analysis
- 11.2.8.4. Recent Developments
- 11.2.8.5. Financials (Based on Availability)
- 11.2.9 Sinovoltaics Group Limited
- 11.2.9.1. Overview
- 11.2.9.2. Products
- 11.2.9.3. SWOT Analysis
- 11.2.9.4. Recent Developments
- 11.2.9.5. Financials (Based on Availability)
- 11.2.10 Waaree Energies Ltd
- 11.2.10.1. Overview
- 11.2.10.2. Products
- 11.2.10.3. SWOT Analysis
- 11.2.10.4. Recent Developments
- 11.2.10.5. Financials (Based on Availability)
- 11.2.11 PLATIO Solar
- 11.2.11.1. Overview
- 11.2.11.2. Products
- 11.2.11.3. SWOT Analysis
- 11.2.11.4. Recent Developments
- 11.2.11.5. Financials (Based on Availability)
- 11.2.12 Sunket
- 11.2.12.1. Overview
- 11.2.12.2. Products
- 11.2.12.3. SWOT Analysis
- 11.2.12.4. Recent Developments
- 11.2.12.5. Financials (Based on Availability)
- 11.2.13 Baoding Jiasheng Photovoltaic Technology Co.
- 11.2.13.1. Overview
- 11.2.13.2. Products
- 11.2.13.3. SWOT Analysis
- 11.2.13.4. Recent Developments
- 11.2.13.5. Financials (Based on Availability)
- 11.2.14 Ltd.
- 11.2.14.1. Overview
- 11.2.14.2. Products
- 11.2.14.3. SWOT Analysis
- 11.2.14.4. Recent Developments
- 11.2.14.5. Financials (Based on Availability)
- 11.2.15 Avenston
- 11.2.15.1. Overview
- 11.2.15.2. Products
- 11.2.15.3. SWOT Analysis
- 11.2.15.4. Recent Developments
- 11.2.15.5. Financials (Based on Availability)
- 11.2.16 Novergy Solar
- 11.2.16.1. Overview
- 11.2.16.2. Products
- 11.2.16.3. SWOT Analysis
- 11.2.16.4. Recent Developments
- 11.2.16.5. Financials (Based on Availability)
- 11.2.1 Hanergy
List of Figures
- Figure 1: Global BIPV Solar System Revenue Breakdown (million, %) by Region 2025 & 2033
- Figure 2: Global BIPV Solar System Volume Breakdown (K, %) by Region 2025 & 2033
- Figure 3: North America BIPV Solar System Revenue (million), by Application 2025 & 2033
- Figure 4: North America BIPV Solar System Volume (K), by Application 2025 & 2033
- Figure 5: North America BIPV Solar System Revenue Share (%), by Application 2025 & 2033
- Figure 6: North America BIPV Solar System Volume Share (%), by Application 2025 & 2033
- Figure 7: North America BIPV Solar System Revenue (million), by Types 2025 & 2033
- Figure 8: North America BIPV Solar System Volume (K), by Types 2025 & 2033
- Figure 9: North America BIPV Solar System Revenue Share (%), by Types 2025 & 2033
- Figure 10: North America BIPV Solar System Volume Share (%), by Types 2025 & 2033
- Figure 11: North America BIPV Solar System Revenue (million), by Country 2025 & 2033
- Figure 12: North America BIPV Solar System Volume (K), by Country 2025 & 2033
- Figure 13: North America BIPV Solar System Revenue Share (%), by Country 2025 & 2033
- Figure 14: North America BIPV Solar System Volume Share (%), by Country 2025 & 2033
- Figure 15: South America BIPV Solar System Revenue (million), by Application 2025 & 2033
- Figure 16: South America BIPV Solar System Volume (K), by Application 2025 & 2033
- Figure 17: South America BIPV Solar System Revenue Share (%), by Application 2025 & 2033
- Figure 18: South America BIPV Solar System Volume Share (%), by Application 2025 & 2033
- Figure 19: South America BIPV Solar System Revenue (million), by Types 2025 & 2033
- Figure 20: South America BIPV Solar System Volume (K), by Types 2025 & 2033
- Figure 21: South America BIPV Solar System Revenue Share (%), by Types 2025 & 2033
- Figure 22: South America BIPV Solar System Volume Share (%), by Types 2025 & 2033
- Figure 23: South America BIPV Solar System Revenue (million), by Country 2025 & 2033
- Figure 24: South America BIPV Solar System Volume (K), by Country 2025 & 2033
- Figure 25: South America BIPV Solar System Revenue Share (%), by Country 2025 & 2033
- Figure 26: South America BIPV Solar System Volume Share (%), by Country 2025 & 2033
- Figure 27: Europe BIPV Solar System Revenue (million), by Application 2025 & 2033
- Figure 28: Europe BIPV Solar System Volume (K), by Application 2025 & 2033
- Figure 29: Europe BIPV Solar System Revenue Share (%), by Application 2025 & 2033
- Figure 30: Europe BIPV Solar System Volume Share (%), by Application 2025 & 2033
- Figure 31: Europe BIPV Solar System Revenue (million), by Types 2025 & 2033
- Figure 32: Europe BIPV Solar System Volume (K), by Types 2025 & 2033
- Figure 33: Europe BIPV Solar System Revenue Share (%), by Types 2025 & 2033
- Figure 34: Europe BIPV Solar System Volume Share (%), by Types 2025 & 2033
- Figure 35: Europe BIPV Solar System Revenue (million), by Country 2025 & 2033
- Figure 36: Europe BIPV Solar System Volume (K), by Country 2025 & 2033
- Figure 37: Europe BIPV Solar System Revenue Share (%), by Country 2025 & 2033
- Figure 38: Europe BIPV Solar System Volume Share (%), by Country 2025 & 2033
- Figure 39: Middle East & Africa BIPV Solar System Revenue (million), by Application 2025 & 2033
- Figure 40: Middle East & Africa BIPV Solar System Volume (K), by Application 2025 & 2033
- Figure 41: Middle East & Africa BIPV Solar System Revenue Share (%), by Application 2025 & 2033
- Figure 42: Middle East & Africa BIPV Solar System Volume Share (%), by Application 2025 & 2033
- Figure 43: Middle East & Africa BIPV Solar System Revenue (million), by Types 2025 & 2033
- Figure 44: Middle East & Africa BIPV Solar System Volume (K), by Types 2025 & 2033
- Figure 45: Middle East & Africa BIPV Solar System Revenue Share (%), by Types 2025 & 2033
- Figure 46: Middle East & Africa BIPV Solar System Volume Share (%), by Types 2025 & 2033
- Figure 47: Middle East & Africa BIPV Solar System Revenue (million), by Country 2025 & 2033
- Figure 48: Middle East & Africa BIPV Solar System Volume (K), by Country 2025 & 2033
- Figure 49: Middle East & Africa BIPV Solar System Revenue Share (%), by Country 2025 & 2033
- Figure 50: Middle East & Africa BIPV Solar System Volume Share (%), by Country 2025 & 2033
- Figure 51: Asia Pacific BIPV Solar System Revenue (million), by Application 2025 & 2033
- Figure 52: Asia Pacific BIPV Solar System Volume (K), by Application 2025 & 2033
- Figure 53: Asia Pacific BIPV Solar System Revenue Share (%), by Application 2025 & 2033
- Figure 54: Asia Pacific BIPV Solar System Volume Share (%), by Application 2025 & 2033
- Figure 55: Asia Pacific BIPV Solar System Revenue (million), by Types 2025 & 2033
- Figure 56: Asia Pacific BIPV Solar System Volume (K), by Types 2025 & 2033
- Figure 57: Asia Pacific BIPV Solar System Revenue Share (%), by Types 2025 & 2033
- Figure 58: Asia Pacific BIPV Solar System Volume Share (%), by Types 2025 & 2033
- Figure 59: Asia Pacific BIPV Solar System Revenue (million), by Country 2025 & 2033
- Figure 60: Asia Pacific BIPV Solar System Volume (K), by Country 2025 & 2033
- Figure 61: Asia Pacific BIPV Solar System Revenue Share (%), by Country 2025 & 2033
- Figure 62: Asia Pacific BIPV Solar System Volume Share (%), by Country 2025 & 2033
List of Tables
- Table 1: Global BIPV Solar System Revenue million Forecast, by Application 2020 & 2033
- Table 2: Global BIPV Solar System Volume K Forecast, by Application 2020 & 2033
- Table 3: Global BIPV Solar System Revenue million Forecast, by Types 2020 & 2033
- Table 4: Global BIPV Solar System Volume K Forecast, by Types 2020 & 2033
- Table 5: Global BIPV Solar System Revenue million Forecast, by Region 2020 & 2033
- Table 6: Global BIPV Solar System Volume K Forecast, by Region 2020 & 2033
- Table 7: Global BIPV Solar System Revenue million Forecast, by Application 2020 & 2033
- Table 8: Global BIPV Solar System Volume K Forecast, by Application 2020 & 2033
- Table 9: Global BIPV Solar System Revenue million Forecast, by Types 2020 & 2033
- Table 10: Global BIPV Solar System Volume K Forecast, by Types 2020 & 2033
- Table 11: Global BIPV Solar System Revenue million Forecast, by Country 2020 & 2033
- Table 12: Global BIPV Solar System Volume K Forecast, by Country 2020 & 2033
- Table 13: United States BIPV Solar System Revenue (million) Forecast, by Application 2020 & 2033
- Table 14: United States BIPV Solar System Volume (K) Forecast, by Application 2020 & 2033
- Table 15: Canada BIPV Solar System Revenue (million) Forecast, by Application 2020 & 2033
- Table 16: Canada BIPV Solar System Volume (K) Forecast, by Application 2020 & 2033
- Table 17: Mexico BIPV Solar System Revenue (million) Forecast, by Application 2020 & 2033
- Table 18: Mexico BIPV Solar System Volume (K) Forecast, by Application 2020 & 2033
- Table 19: Global BIPV Solar System Revenue million Forecast, by Application 2020 & 2033
- Table 20: Global BIPV Solar System Volume K Forecast, by Application 2020 & 2033
- Table 21: Global BIPV Solar System Revenue million Forecast, by Types 2020 & 2033
- Table 22: Global BIPV Solar System Volume K Forecast, by Types 2020 & 2033
- Table 23: Global BIPV Solar System Revenue million Forecast, by Country 2020 & 2033
- Table 24: Global BIPV Solar System Volume K Forecast, by Country 2020 & 2033
- Table 25: Brazil BIPV Solar System Revenue (million) Forecast, by Application 2020 & 2033
- Table 26: Brazil BIPV Solar System Volume (K) Forecast, by Application 2020 & 2033
- Table 27: Argentina BIPV Solar System Revenue (million) Forecast, by Application 2020 & 2033
- Table 28: Argentina BIPV Solar System Volume (K) Forecast, by Application 2020 & 2033
- Table 29: Rest of South America BIPV Solar System Revenue (million) Forecast, by Application 2020 & 2033
- Table 30: Rest of South America BIPV Solar System Volume (K) Forecast, by Application 2020 & 2033
- Table 31: Global BIPV Solar System Revenue million Forecast, by Application 2020 & 2033
- Table 32: Global BIPV Solar System Volume K Forecast, by Application 2020 & 2033
- Table 33: Global BIPV Solar System Revenue million Forecast, by Types 2020 & 2033
- Table 34: Global BIPV Solar System Volume K Forecast, by Types 2020 & 2033
- Table 35: Global BIPV Solar System Revenue million Forecast, by Country 2020 & 2033
- Table 36: Global BIPV Solar System Volume K Forecast, by Country 2020 & 2033
- Table 37: United Kingdom BIPV Solar System Revenue (million) Forecast, by Application 2020 & 2033
- Table 38: United Kingdom BIPV Solar System Volume (K) Forecast, by Application 2020 & 2033
- Table 39: Germany BIPV Solar System Revenue (million) Forecast, by Application 2020 & 2033
- Table 40: Germany BIPV Solar System Volume (K) Forecast, by Application 2020 & 2033
- Table 41: France BIPV Solar System Revenue (million) Forecast, by Application 2020 & 2033
- Table 42: France BIPV Solar System Volume (K) Forecast, by Application 2020 & 2033
- Table 43: Italy BIPV Solar System Revenue (million) Forecast, by Application 2020 & 2033
- Table 44: Italy BIPV Solar System Volume (K) Forecast, by Application 2020 & 2033
- Table 45: Spain BIPV Solar System Revenue (million) Forecast, by Application 2020 & 2033
- Table 46: Spain BIPV Solar System Volume (K) Forecast, by Application 2020 & 2033
- Table 47: Russia BIPV Solar System Revenue (million) Forecast, by Application 2020 & 2033
- Table 48: Russia BIPV Solar System Volume (K) Forecast, by Application 2020 & 2033
- Table 49: Benelux BIPV Solar System Revenue (million) Forecast, by Application 2020 & 2033
- Table 50: Benelux BIPV Solar System Volume (K) Forecast, by Application 2020 & 2033
- Table 51: Nordics BIPV Solar System Revenue (million) Forecast, by Application 2020 & 2033
- Table 52: Nordics BIPV Solar System Volume (K) Forecast, by Application 2020 & 2033
- Table 53: Rest of Europe BIPV Solar System Revenue (million) Forecast, by Application 2020 & 2033
- Table 54: Rest of Europe BIPV Solar System Volume (K) Forecast, by Application 2020 & 2033
- Table 55: Global BIPV Solar System Revenue million Forecast, by Application 2020 & 2033
- Table 56: Global BIPV Solar System Volume K Forecast, by Application 2020 & 2033
- Table 57: Global BIPV Solar System Revenue million Forecast, by Types 2020 & 2033
- Table 58: Global BIPV Solar System Volume K Forecast, by Types 2020 & 2033
- Table 59: Global BIPV Solar System Revenue million Forecast, by Country 2020 & 2033
- Table 60: Global BIPV Solar System Volume K Forecast, by Country 2020 & 2033
- Table 61: Turkey BIPV Solar System Revenue (million) Forecast, by Application 2020 & 2033
- Table 62: Turkey BIPV Solar System Volume (K) Forecast, by Application 2020 & 2033
- Table 63: Israel BIPV Solar System Revenue (million) Forecast, by Application 2020 & 2033
- Table 64: Israel BIPV Solar System Volume (K) Forecast, by Application 2020 & 2033
- Table 65: GCC BIPV Solar System Revenue (million) Forecast, by Application 2020 & 2033
- Table 66: GCC BIPV Solar System Volume (K) Forecast, by Application 2020 & 2033
- Table 67: North Africa BIPV Solar System Revenue (million) Forecast, by Application 2020 & 2033
- Table 68: North Africa BIPV Solar System Volume (K) Forecast, by Application 2020 & 2033
- Table 69: South Africa BIPV Solar System Revenue (million) Forecast, by Application 2020 & 2033
- Table 70: South Africa BIPV Solar System Volume (K) Forecast, by Application 2020 & 2033
- Table 71: Rest of Middle East & Africa BIPV Solar System Revenue (million) Forecast, by Application 2020 & 2033
- Table 72: Rest of Middle East & Africa BIPV Solar System Volume (K) Forecast, by Application 2020 & 2033
- Table 73: Global BIPV Solar System Revenue million Forecast, by Application 2020 & 2033
- Table 74: Global BIPV Solar System Volume K Forecast, by Application 2020 & 2033
- Table 75: Global BIPV Solar System Revenue million Forecast, by Types 2020 & 2033
- Table 76: Global BIPV Solar System Volume K Forecast, by Types 2020 & 2033
- Table 77: Global BIPV Solar System Revenue million Forecast, by Country 2020 & 2033
- Table 78: Global BIPV Solar System Volume K Forecast, by Country 2020 & 2033
- Table 79: China BIPV Solar System Revenue (million) Forecast, by Application 2020 & 2033
- Table 80: China BIPV Solar System Volume (K) Forecast, by Application 2020 & 2033
- Table 81: India BIPV Solar System Revenue (million) Forecast, by Application 2020 & 2033
- Table 82: India BIPV Solar System Volume (K) Forecast, by Application 2020 & 2033
- Table 83: Japan BIPV Solar System Revenue (million) Forecast, by Application 2020 & 2033
- Table 84: Japan BIPV Solar System Volume (K) Forecast, by Application 2020 & 2033
- Table 85: South Korea BIPV Solar System Revenue (million) Forecast, by Application 2020 & 2033
- Table 86: South Korea BIPV Solar System Volume (K) Forecast, by Application 2020 & 2033
- Table 87: ASEAN BIPV Solar System Revenue (million) Forecast, by Application 2020 & 2033
- Table 88: ASEAN BIPV Solar System Volume (K) Forecast, by Application 2020 & 2033
- Table 89: Oceania BIPV Solar System Revenue (million) Forecast, by Application 2020 & 2033
- Table 90: Oceania BIPV Solar System Volume (K) Forecast, by Application 2020 & 2033
- Table 91: Rest of Asia Pacific BIPV Solar System Revenue (million) Forecast, by Application 2020 & 2033
- Table 92: Rest of Asia Pacific BIPV Solar System Volume (K) Forecast, by Application 2020 & 2033
Frequently Asked Questions
1. What is the projected Compound Annual Growth Rate (CAGR) of the BIPV Solar System?
The projected CAGR is approximately XX%.
2. Which companies are prominent players in the BIPV Solar System?
Key companies in the market include Hanergy, SunPower, Tesla, Onyx Solar, Solaria Corporation, SolTech Energy, Dow Solar, MetSolar, Sinovoltaics Group Limited, Waaree Energies Ltd, PLATIO Solar, Sunket, Baoding Jiasheng Photovoltaic Technology Co., Ltd., Avenston, Novergy Solar.
3. What are the main segments of the BIPV Solar System?
The market segments include Application, Types.
4. Can you provide details about the market size?
The market size is estimated to be USD XXX million as of 2022.
5. What are some drivers contributing to market growth?
N/A
6. What are the notable trends driving market growth?
N/A
7. Are there any restraints impacting market growth?
N/A
8. Can you provide examples of recent developments in the market?
N/A
9. What pricing options are available for accessing the report?
Pricing options include single-user, multi-user, and enterprise licenses priced at USD 4350.00, USD 6525.00, and USD 8700.00 respectively.
10. Is the market size provided in terms of value or volume?
The market size is provided in terms of value, measured in million and volume, measured in K.
11. Are there any specific market keywords associated with the report?
Yes, the market keyword associated with the report is "BIPV Solar System," which aids in identifying and referencing the specific market segment covered.
12. How do I determine which pricing option suits my needs best?
The pricing options vary based on user requirements and access needs. Individual users may opt for single-user licenses, while businesses requiring broader access may choose multi-user or enterprise licenses for cost-effective access to the report.
13. Are there any additional resources or data provided in the BIPV Solar System report?
While the report offers comprehensive insights, it's advisable to review the specific contents or supplementary materials provided to ascertain if additional resources or data are available.
14. How can I stay updated on further developments or reports in the BIPV Solar System?
To stay informed about further developments, trends, and reports in the BIPV Solar System, consider subscribing to industry newsletters, following relevant companies and organizations, or regularly checking reputable industry news sources and publications.
Methodology
Step 1 - Identification of Relevant Samples Size from Population Database


Step 2 - Approaches for Defining Global Market Size (Value, Volume* & Price*)

Note*: In applicable scenarios
Step 3 - Data Sources
Primary Research
- Web Analytics
- Survey Reports
- Research Institute
- Latest Research Reports
- Opinion Leaders
Secondary Research
- Annual Reports
- White Paper
- Latest Press Release
- Industry Association
- Paid Database
- Investor Presentations

Step 4 - Data Triangulation
Involves using different sources of information in order to increase the validity of a study
These sources are likely to be stakeholders in a program - participants, other researchers, program staff, other community members, and so on.
Then we put all data in single framework & apply various statistical tools to find out the dynamic on the market.
During the analysis stage, feedback from the stakeholder groups would be compared to determine areas of agreement as well as areas of divergence

