


Key Insights
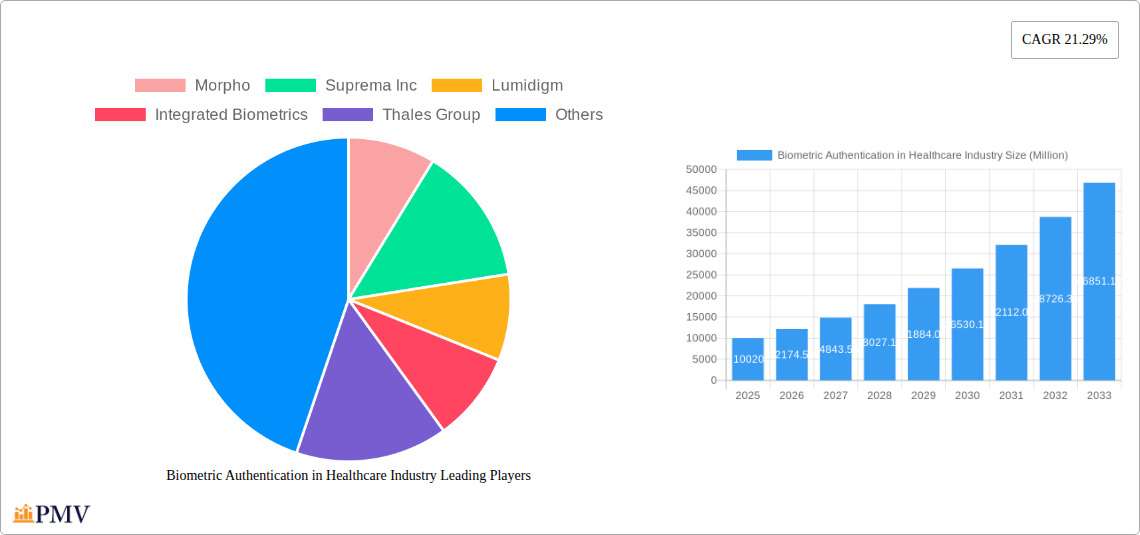
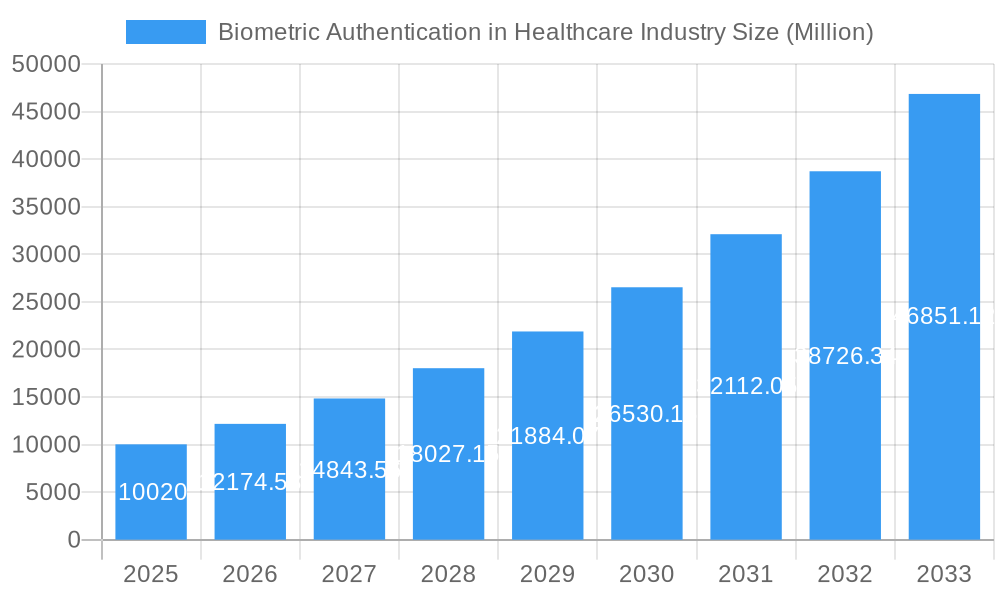
The global biometric authentication in healthcare market is experiencing robust growth, projected to reach \$10.02 billion in 2025 and exhibiting a compound annual growth rate (CAGR) of 21.29% from 2025 to 2033. This expansion is driven by several key factors. Increasing concerns regarding data security and patient privacy within the healthcare sector are fueling demand for robust authentication solutions. Biometrics offer a superior alternative to traditional password-based systems, providing enhanced security and minimizing the risk of unauthorized access to sensitive medical records. Furthermore, the rising adoption of telehealth and remote patient monitoring (RPM) is creating a significant need for secure and reliable patient identification and verification methods, boosting the market's trajectory. The integration of biometric authentication into Electronic Health Records (EHR) systems is streamlining workflows and improving patient care efficiency. Government regulations mandating stronger data protection measures are also contributing to market growth. Growth is further segmented by technology type (single-factor, multi-factor, and other technologies), application (medical record and data center security, patient identification and tracking, care provider authentication, home/remote patient monitoring, and other applications), and end-user (hospitals/clinics, research and clinical laboratories, and other end-users). The market is geographically diverse, with North America currently holding a substantial share, followed by Europe and the Asia-Pacific region.
Biometric Authentication in Healthcare Industry Market Size (In Billion)

The market's growth, however, is not without its challenges. High initial investment costs associated with implementing biometric systems can be a barrier for smaller healthcare providers. Concerns surrounding data privacy and the potential for biometric data breaches need to be addressed through robust security protocols and regulatory compliance. Furthermore, ensuring interoperability between different biometric systems and existing healthcare IT infrastructure presents a significant hurdle. Despite these challenges, the long-term outlook for biometric authentication in healthcare remains highly positive, driven by the increasing demand for secure and efficient patient data management, technological advancements, and evolving regulatory landscapes. The market is expected to witness continuous innovation, including the integration of artificial intelligence (AI) and machine learning (ML) to enhance accuracy and security further.
Biometric Authentication in Healthcare Industry Company Market Share
Biometric Authentication in Healthcare Industry: Market Report 2019-2033
This comprehensive report provides a detailed analysis of the Biometric Authentication in Healthcare Industry market, offering invaluable insights for stakeholders across the value chain. With a study period spanning 2019-2033, a base year of 2025, and a forecast period of 2025-2033, this report leverages rigorous research methodologies to deliver actionable intelligence. The global market is projected to reach xx Million by 2033, showcasing substantial growth potential. This report covers key market segments, competitive dynamics, technological advancements, and future growth opportunities, making it an essential resource for businesses, investors, and researchers in the healthcare and technology sectors.
Biometric Authentication in Healthcare Industry Market Structure & Competitive Dynamics
The Biometric Authentication in Healthcare Industry market is characterized by a moderately consolidated structure with several key players holding significant market share. The market is witnessing a surge in innovation, driven by advancements in biometric technologies and the increasing need for enhanced security and efficiency in healthcare settings. Regulatory frameworks, particularly concerning data privacy and security (e.g., HIPAA), heavily influence market dynamics. Product substitutes, such as traditional password-based authentication systems, are gradually being replaced due to their limitations in security and user experience. End-user trends, such as the rising adoption of telehealth and remote patient monitoring, are fueling demand for secure biometric solutions. M&A activity has been relatively moderate, with deal values totaling approximately xx Million in the past five years. Key players, including Morpho, Suprema Inc, Lumidigm, Integrated Biometrics, and Thales Group, are actively engaged in strategic partnerships and collaborations to expand their market reach and product offerings. Market share is distributed as follows: Morpho (xx%), Suprema Inc (xx%), Lumidigm (xx%), Integrated Biometrics (xx%), Thales Group (xx%), with remaining market share dispersed among other players.
- High Market Concentration: A few major players dominate the market, though smaller companies are also actively participating.
- Technological Advancements: Continuous innovation in biometric technologies is driving market growth.
- Stringent Regulatory Landscape: Compliance with regulations, such as HIPAA, is crucial.
- Growing M&A Activity: Strategic acquisitions and mergers are shaping market dynamics.
- Shifting End-User Preferences: Adoption of telehealth and remote patient monitoring influences market demand.
Biometric Authentication in Healthcare Industry Industry Trends & Insights
The Biometric Authentication in Healthcare Industry is experiencing robust growth, driven by several key factors. The market exhibits a Compound Annual Growth Rate (CAGR) of xx% during the forecast period (2025-2033). Increasing cyber security threats within the healthcare sector are creating a higher demand for advanced authentication systems. Furthermore, the rising adoption of electronic health records (EHRs) and the need for secure access to sensitive patient data are driving growth. Technological advancements, such as the development of more accurate and user-friendly biometric technologies, are also contributing to market expansion. Consumer preference shifts towards convenient and secure authentication methods further boost market penetration. The market penetration rate of biometric authentication systems in healthcare is expected to reach xx% by 2033. Competitive dynamics remain intense, with major players investing heavily in R&D and strategic partnerships to gain a competitive edge.
Dominant Markets & Segments in Biometric Authentication in Healthcare Industry
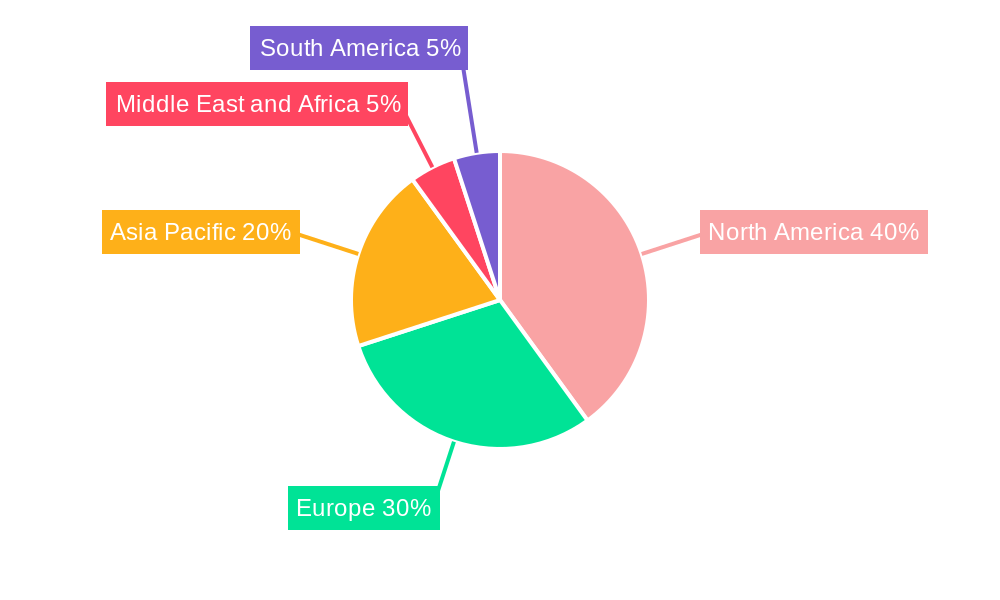
The North American region holds the largest market share in the Biometric Authentication in Healthcare Industry, driven by factors such as stringent regulatory compliance, high technology adoption rates, and substantial investment in healthcare IT infrastructure.
- By Technology: Multi-factor authentication is expected to dominate the market owing to its enhanced security capabilities.
- By Application: Medical record and data center security is a leading segment due to the growing need to protect sensitive patient data.
- By End User: Hospitals and clinics represent the largest end-user segment, driven by their high volume of sensitive data and the necessity for robust security systems.
Key Drivers for Dominant Segments:
- North America: Stringent data privacy regulations, high healthcare IT spending, and early adoption of advanced technologies.
- Multi-factor Authentication: Enhanced security compared to single-factor authentication.
- Medical Record and Data Center Security: The critical need to protect sensitive patient information and healthcare data.
- Hospitals/Clinics: High volume of patient data and stringent security requirements.
Biometric Authentication in Healthcare Industry Product Innovations
Recent product innovations focus on enhancing accuracy, speed, and user experience. For example, the integration of artificial intelligence and machine learning is improving the reliability and security of biometric authentication systems. Miniaturization and improved usability are also key trends. The market is witnessing the emergence of solutions that combine multiple biometric modalities for enhanced security. These innovations align with the growing demand for seamless and secure access to healthcare systems.
Report Segmentation & Scope
This report segments the Biometric Authentication in Healthcare Industry market across various dimensions:
- By Technology: Single-factor authentication, multi-factor authentication, and other technologies. Each segment showcases distinct growth projections and competitive dynamics. Multi-factor authentication is expected to experience the highest growth due to its robust security.
- By Application: Medical record and data center security, patient identification and tracking, care provider authentication, home/remote patient monitoring, and other applications. Each application segment exhibits varying market sizes and growth potentials based on specific security needs.
- By End User: Hospitals/clinics, research and clinical laboratories, and other end users. Growth projections for each end-user segment vary based on their technological adoption rates and security requirements.
Key Drivers of Biometric Authentication in Healthcare Industry Growth
Several factors are driving the growth of the biometric authentication market in healthcare:
- Increasing Cyber Threats: The rising frequency and sophistication of cyberattacks targeting healthcare data.
- Regulatory Compliance: The need to meet stringent data privacy and security regulations (e.g., HIPAA).
- Technological Advancements: Continuous improvements in biometric technologies, such as improved accuracy and speed.
- Rising Adoption of Telehealth: The increasing reliance on remote patient monitoring and telehealth services.
Challenges in the Biometric Authentication in Healthcare Industry Sector
Despite strong growth potential, the Biometric Authentication in Healthcare Industry faces several challenges:
- High Initial Investment Costs: Implementing biometric systems can require significant upfront investment.
- Data Privacy Concerns: Addressing public concerns regarding the privacy and security of biometric data.
- Integration Challenges: Integrating biometric systems with existing healthcare IT infrastructure can be complex.
- Accuracy and Reliability Concerns: Maintaining high accuracy and reliability in diverse healthcare settings.
Leading Players in the Biometric Authentication in Healthcare Industry Market
- Morpho
- Suprema Inc
- Lumidigm
- Integrated Biometrics
- Thales Group
- Fujitsu Limited
- Facetec Inc
- Crossmatch Technologies Inc
- Bio-Key International Inc
- Imprivata Inc
- NEC Corporation
- Zkteco Inc
Key Developments in Biometric Authentication in Healthcare Industry Sector
- March 2022: BioIntelliSense launched its medical-grade BioButton Rechargeable wearable device for continuous multi-parameter monitoring. This significantly expands the applications of biometric data in patient care.
- January 2022: Mitsubishi Electric Corporation unveiled HealthCam, a facial recognition health monitoring system. This showcases the integration of biometric technologies with remote health monitoring capabilities.
Strategic Biometric Authentication in Healthcare Industry Market Outlook
The Biometric Authentication in Healthcare Industry is poised for continued strong growth, driven by increasing security concerns, technological advancements, and rising adoption of remote healthcare services. Strategic opportunities exist for companies that can offer innovative, secure, and user-friendly biometric solutions that address the specific needs of the healthcare sector. Focusing on interoperability, data privacy, and seamless integration with existing healthcare systems will be critical for success. The market presents significant potential for both established players and new entrants that can deliver cutting-edge solutions.
Biometric Authentication in Healthcare Industry Segmentation
-
1. Technology
- 1.1. Single-factor Authentication
- 1.2. Multi-factor Authentication
- 1.3. Other Technologies
-
2. Application
- 2.1. Medical Record and Data Center Security
- 2.2. Patient Identification and Tracking
- 2.3. Care Provider Authentication
- 2.4. Home/Remote Patient Monitoring
- 2.5. Other Applications
-
3. End User
- 3.1. Hospital/Clinics
- 3.2. Research and Clinical Laboratory
- 3.3. Other End Users
Biometric Authentication in Healthcare Industry Segmentation By Geography
-
1. North America
- 1.1. United States
- 1.2. Canada
- 1.3. Mexico
-
2. Europe
- 2.1. Germany
- 2.2. United Kingdom
- 2.3. France
- 2.4. Italy
- 2.5. Spain
- 2.6. Rest of Europe
-
3. Asia Pacific
- 3.1. China
- 3.2. Japan
- 3.3. India
- 3.4. Australia
- 3.5. South Korea
- 3.6. Rest of Asia Pacific
-
4. Middle East and Africa
- 4.1. GCC
- 4.2. South Africa
- 4.3. Rest of Middle East and Africa
-
5. South America
- 5.1. Brazil
- 5.2. Argentina
- 5.3. Rest of South America
Biometric Authentication in Healthcare Industry Regional Market Share
Geographic Coverage of Biometric Authentication in Healthcare Industry
Biometric Authentication in Healthcare Industry REPORT HIGHLIGHTS
| Aspects | Details |
|---|---|
| Study Period | 2020-2034 |
| Base Year | 2025 |
| Estimated Year | 2026 |
| Forecast Period | 2026-2034 |
| Historical Period | 2020-2025 |
| Growth Rate | CAGR of 21.29% from 2020-2034 |
| Segmentation |
|
Table of Contents
- 1. Introduction
- 1.1. Research Scope
- 1.2. Market Segmentation
- 1.3. Research Methodology
- 1.4. Definitions and Assumptions
- 2. Executive Summary
- 2.1. Introduction
- 3. Market Dynamics
- 3.1. Introduction
- 3.2. Market Drivers
- 3.2.1. Implementation of Government Initiatives Supporting the Adoption of Biometrics in Healthcare; Rising Incidence of Healthcare Data Breaches and Medical Identity Theft
- 3.3. Market Restrains
- 3.3.1. High Cost of Biometric Devices; Issues Related to the Use of Biometric Technologies
- 3.4. Market Trends
- 3.4.1. Multifactor-factor Authentication is Expected to Cover a Large Share of the Market Over the Forecast Period
- 4. Market Factor Analysis
- 4.1. Porters Five Forces
- 4.2. Supply/Value Chain
- 4.3. PESTEL analysis
- 4.4. Market Entropy
- 4.5. Patent/Trademark Analysis
- 5. Global Biometric Authentication in Healthcare Industry Analysis, Insights and Forecast, 2020-2032
- 5.1. Market Analysis, Insights and Forecast - by Technology
- 5.1.1. Single-factor Authentication
- 5.1.2. Multi-factor Authentication
- 5.1.3. Other Technologies
- 5.2. Market Analysis, Insights and Forecast - by Application
- 5.2.1. Medical Record and Data Center Security
- 5.2.2. Patient Identification and Tracking
- 5.2.3. Care Provider Authentication
- 5.2.4. Home/Remote Patient Monitoring
- 5.2.5. Other Applications
- 5.3. Market Analysis, Insights and Forecast - by End User
- 5.3.1. Hospital/Clinics
- 5.3.2. Research and Clinical Laboratory
- 5.3.3. Other End Users
- 5.4. Market Analysis, Insights and Forecast - by Region
- 5.4.1. North America
- 5.4.2. Europe
- 5.4.3. Asia Pacific
- 5.4.4. Middle East and Africa
- 5.4.5. South America
- 5.1. Market Analysis, Insights and Forecast - by Technology
- 6. North America Biometric Authentication in Healthcare Industry Analysis, Insights and Forecast, 2020-2032
- 6.1. Market Analysis, Insights and Forecast - by Technology
- 6.1.1. Single-factor Authentication
- 6.1.2. Multi-factor Authentication
- 6.1.3. Other Technologies
- 6.2. Market Analysis, Insights and Forecast - by Application
- 6.2.1. Medical Record and Data Center Security
- 6.2.2. Patient Identification and Tracking
- 6.2.3. Care Provider Authentication
- 6.2.4. Home/Remote Patient Monitoring
- 6.2.5. Other Applications
- 6.3. Market Analysis, Insights and Forecast - by End User
- 6.3.1. Hospital/Clinics
- 6.3.2. Research and Clinical Laboratory
- 6.3.3. Other End Users
- 6.1. Market Analysis, Insights and Forecast - by Technology
- 7. Europe Biometric Authentication in Healthcare Industry Analysis, Insights and Forecast, 2020-2032
- 7.1. Market Analysis, Insights and Forecast - by Technology
- 7.1.1. Single-factor Authentication
- 7.1.2. Multi-factor Authentication
- 7.1.3. Other Technologies
- 7.2. Market Analysis, Insights and Forecast - by Application
- 7.2.1. Medical Record and Data Center Security
- 7.2.2. Patient Identification and Tracking
- 7.2.3. Care Provider Authentication
- 7.2.4. Home/Remote Patient Monitoring
- 7.2.5. Other Applications
- 7.3. Market Analysis, Insights and Forecast - by End User
- 7.3.1. Hospital/Clinics
- 7.3.2. Research and Clinical Laboratory
- 7.3.3. Other End Users
- 7.1. Market Analysis, Insights and Forecast - by Technology
- 8. Asia Pacific Biometric Authentication in Healthcare Industry Analysis, Insights and Forecast, 2020-2032
- 8.1. Market Analysis, Insights and Forecast - by Technology
- 8.1.1. Single-factor Authentication
- 8.1.2. Multi-factor Authentication
- 8.1.3. Other Technologies
- 8.2. Market Analysis, Insights and Forecast - by Application
- 8.2.1. Medical Record and Data Center Security
- 8.2.2. Patient Identification and Tracking
- 8.2.3. Care Provider Authentication
- 8.2.4. Home/Remote Patient Monitoring
- 8.2.5. Other Applications
- 8.3. Market Analysis, Insights and Forecast - by End User
- 8.3.1. Hospital/Clinics
- 8.3.2. Research and Clinical Laboratory
- 8.3.3. Other End Users
- 8.1. Market Analysis, Insights and Forecast - by Technology
- 9. Middle East and Africa Biometric Authentication in Healthcare Industry Analysis, Insights and Forecast, 2020-2032
- 9.1. Market Analysis, Insights and Forecast - by Technology
- 9.1.1. Single-factor Authentication
- 9.1.2. Multi-factor Authentication
- 9.1.3. Other Technologies
- 9.2. Market Analysis, Insights and Forecast - by Application
- 9.2.1. Medical Record and Data Center Security
- 9.2.2. Patient Identification and Tracking
- 9.2.3. Care Provider Authentication
- 9.2.4. Home/Remote Patient Monitoring
- 9.2.5. Other Applications
- 9.3. Market Analysis, Insights and Forecast - by End User
- 9.3.1. Hospital/Clinics
- 9.3.2. Research and Clinical Laboratory
- 9.3.3. Other End Users
- 9.1. Market Analysis, Insights and Forecast - by Technology
- 10. South America Biometric Authentication in Healthcare Industry Analysis, Insights and Forecast, 2020-2032
- 10.1. Market Analysis, Insights and Forecast - by Technology
- 10.1.1. Single-factor Authentication
- 10.1.2. Multi-factor Authentication
- 10.1.3. Other Technologies
- 10.2. Market Analysis, Insights and Forecast - by Application
- 10.2.1. Medical Record and Data Center Security
- 10.2.2. Patient Identification and Tracking
- 10.2.3. Care Provider Authentication
- 10.2.4. Home/Remote Patient Monitoring
- 10.2.5. Other Applications
- 10.3. Market Analysis, Insights and Forecast - by End User
- 10.3.1. Hospital/Clinics
- 10.3.2. Research and Clinical Laboratory
- 10.3.3. Other End Users
- 10.1. Market Analysis, Insights and Forecast - by Technology
- 11. Competitive Analysis
- 11.1. Global Market Share Analysis 2025
- 11.2. Company Profiles
- 11.2.1 Morpho
- 11.2.1.1. Overview
- 11.2.1.2. Products
- 11.2.1.3. SWOT Analysis
- 11.2.1.4. Recent Developments
- 11.2.1.5. Financials (Based on Availability)
- 11.2.2 Suprema Inc
- 11.2.2.1. Overview
- 11.2.2.2. Products
- 11.2.2.3. SWOT Analysis
- 11.2.2.4. Recent Developments
- 11.2.2.5. Financials (Based on Availability)
- 11.2.3 Lumidigm
- 11.2.3.1. Overview
- 11.2.3.2. Products
- 11.2.3.3. SWOT Analysis
- 11.2.3.4. Recent Developments
- 11.2.3.5. Financials (Based on Availability)
- 11.2.4 Integrated Biometrics
- 11.2.4.1. Overview
- 11.2.4.2. Products
- 11.2.4.3. SWOT Analysis
- 11.2.4.4. Recent Developments
- 11.2.4.5. Financials (Based on Availability)
- 11.2.5 Thales Group
- 11.2.5.1. Overview
- 11.2.5.2. Products
- 11.2.5.3. SWOT Analysis
- 11.2.5.4. Recent Developments
- 11.2.5.5. Financials (Based on Availability)
- 11.2.6 Fujitsu Limited
- 11.2.6.1. Overview
- 11.2.6.2. Products
- 11.2.6.3. SWOT Analysis
- 11.2.6.4. Recent Developments
- 11.2.6.5. Financials (Based on Availability)
- 11.2.7 Facetec Inc
- 11.2.7.1. Overview
- 11.2.7.2. Products
- 11.2.7.3. SWOT Analysis
- 11.2.7.4. Recent Developments
- 11.2.7.5. Financials (Based on Availability)
- 11.2.8 Crossmatch Technologies Inc
- 11.2.8.1. Overview
- 11.2.8.2. Products
- 11.2.8.3. SWOT Analysis
- 11.2.8.4. Recent Developments
- 11.2.8.5. Financials (Based on Availability)
- 11.2.9 Bio-Key International Inc
- 11.2.9.1. Overview
- 11.2.9.2. Products
- 11.2.9.3. SWOT Analysis
- 11.2.9.4. Recent Developments
- 11.2.9.5. Financials (Based on Availability)
- 11.2.10 Imprivata Inc
- 11.2.10.1. Overview
- 11.2.10.2. Products
- 11.2.10.3. SWOT Analysis
- 11.2.10.4. Recent Developments
- 11.2.10.5. Financials (Based on Availability)
- 11.2.11 NEC Corporation
- 11.2.11.1. Overview
- 11.2.11.2. Products
- 11.2.11.3. SWOT Analysis
- 11.2.11.4. Recent Developments
- 11.2.11.5. Financials (Based on Availability)
- 11.2.12 Zkteco Inc
- 11.2.12.1. Overview
- 11.2.12.2. Products
- 11.2.12.3. SWOT Analysis
- 11.2.12.4. Recent Developments
- 11.2.12.5. Financials (Based on Availability)
- 11.2.1 Morpho
List of Figures
- Figure 1: Global Biometric Authentication in Healthcare Industry Revenue Breakdown (Million, %) by Region 2025 & 2033
- Figure 2: Global Biometric Authentication in Healthcare Industry Volume Breakdown (K Unit, %) by Region 2025 & 2033
- Figure 3: North America Biometric Authentication in Healthcare Industry Revenue (Million), by Technology 2025 & 2033
- Figure 4: North America Biometric Authentication in Healthcare Industry Volume (K Unit), by Technology 2025 & 2033
- Figure 5: North America Biometric Authentication in Healthcare Industry Revenue Share (%), by Technology 2025 & 2033
- Figure 6: North America Biometric Authentication in Healthcare Industry Volume Share (%), by Technology 2025 & 2033
- Figure 7: North America Biometric Authentication in Healthcare Industry Revenue (Million), by Application 2025 & 2033
- Figure 8: North America Biometric Authentication in Healthcare Industry Volume (K Unit), by Application 2025 & 2033
- Figure 9: North America Biometric Authentication in Healthcare Industry Revenue Share (%), by Application 2025 & 2033
- Figure 10: North America Biometric Authentication in Healthcare Industry Volume Share (%), by Application 2025 & 2033
- Figure 11: North America Biometric Authentication in Healthcare Industry Revenue (Million), by End User 2025 & 2033
- Figure 12: North America Biometric Authentication in Healthcare Industry Volume (K Unit), by End User 2025 & 2033
- Figure 13: North America Biometric Authentication in Healthcare Industry Revenue Share (%), by End User 2025 & 2033
- Figure 14: North America Biometric Authentication in Healthcare Industry Volume Share (%), by End User 2025 & 2033
- Figure 15: North America Biometric Authentication in Healthcare Industry Revenue (Million), by Country 2025 & 2033
- Figure 16: North America Biometric Authentication in Healthcare Industry Volume (K Unit), by Country 2025 & 2033
- Figure 17: North America Biometric Authentication in Healthcare Industry Revenue Share (%), by Country 2025 & 2033
- Figure 18: North America Biometric Authentication in Healthcare Industry Volume Share (%), by Country 2025 & 2033
- Figure 19: Europe Biometric Authentication in Healthcare Industry Revenue (Million), by Technology 2025 & 2033
- Figure 20: Europe Biometric Authentication in Healthcare Industry Volume (K Unit), by Technology 2025 & 2033
- Figure 21: Europe Biometric Authentication in Healthcare Industry Revenue Share (%), by Technology 2025 & 2033
- Figure 22: Europe Biometric Authentication in Healthcare Industry Volume Share (%), by Technology 2025 & 2033
- Figure 23: Europe Biometric Authentication in Healthcare Industry Revenue (Million), by Application 2025 & 2033
- Figure 24: Europe Biometric Authentication in Healthcare Industry Volume (K Unit), by Application 2025 & 2033
- Figure 25: Europe Biometric Authentication in Healthcare Industry Revenue Share (%), by Application 2025 & 2033
- Figure 26: Europe Biometric Authentication in Healthcare Industry Volume Share (%), by Application 2025 & 2033
- Figure 27: Europe Biometric Authentication in Healthcare Industry Revenue (Million), by End User 2025 & 2033
- Figure 28: Europe Biometric Authentication in Healthcare Industry Volume (K Unit), by End User 2025 & 2033
- Figure 29: Europe Biometric Authentication in Healthcare Industry Revenue Share (%), by End User 2025 & 2033
- Figure 30: Europe Biometric Authentication in Healthcare Industry Volume Share (%), by End User 2025 & 2033
- Figure 31: Europe Biometric Authentication in Healthcare Industry Revenue (Million), by Country 2025 & 2033
- Figure 32: Europe Biometric Authentication in Healthcare Industry Volume (K Unit), by Country 2025 & 2033
- Figure 33: Europe Biometric Authentication in Healthcare Industry Revenue Share (%), by Country 2025 & 2033
- Figure 34: Europe Biometric Authentication in Healthcare Industry Volume Share (%), by Country 2025 & 2033
- Figure 35: Asia Pacific Biometric Authentication in Healthcare Industry Revenue (Million), by Technology 2025 & 2033
- Figure 36: Asia Pacific Biometric Authentication in Healthcare Industry Volume (K Unit), by Technology 2025 & 2033
- Figure 37: Asia Pacific Biometric Authentication in Healthcare Industry Revenue Share (%), by Technology 2025 & 2033
- Figure 38: Asia Pacific Biometric Authentication in Healthcare Industry Volume Share (%), by Technology 2025 & 2033
- Figure 39: Asia Pacific Biometric Authentication in Healthcare Industry Revenue (Million), by Application 2025 & 2033
- Figure 40: Asia Pacific Biometric Authentication in Healthcare Industry Volume (K Unit), by Application 2025 & 2033
- Figure 41: Asia Pacific Biometric Authentication in Healthcare Industry Revenue Share (%), by Application 2025 & 2033
- Figure 42: Asia Pacific Biometric Authentication in Healthcare Industry Volume Share (%), by Application 2025 & 2033
- Figure 43: Asia Pacific Biometric Authentication in Healthcare Industry Revenue (Million), by End User 2025 & 2033
- Figure 44: Asia Pacific Biometric Authentication in Healthcare Industry Volume (K Unit), by End User 2025 & 2033
- Figure 45: Asia Pacific Biometric Authentication in Healthcare Industry Revenue Share (%), by End User 2025 & 2033
- Figure 46: Asia Pacific Biometric Authentication in Healthcare Industry Volume Share (%), by End User 2025 & 2033
- Figure 47: Asia Pacific Biometric Authentication in Healthcare Industry Revenue (Million), by Country 2025 & 2033
- Figure 48: Asia Pacific Biometric Authentication in Healthcare Industry Volume (K Unit), by Country 2025 & 2033
- Figure 49: Asia Pacific Biometric Authentication in Healthcare Industry Revenue Share (%), by Country 2025 & 2033
- Figure 50: Asia Pacific Biometric Authentication in Healthcare Industry Volume Share (%), by Country 2025 & 2033
- Figure 51: Middle East and Africa Biometric Authentication in Healthcare Industry Revenue (Million), by Technology 2025 & 2033
- Figure 52: Middle East and Africa Biometric Authentication in Healthcare Industry Volume (K Unit), by Technology 2025 & 2033
- Figure 53: Middle East and Africa Biometric Authentication in Healthcare Industry Revenue Share (%), by Technology 2025 & 2033
- Figure 54: Middle East and Africa Biometric Authentication in Healthcare Industry Volume Share (%), by Technology 2025 & 2033
- Figure 55: Middle East and Africa Biometric Authentication in Healthcare Industry Revenue (Million), by Application 2025 & 2033
- Figure 56: Middle East and Africa Biometric Authentication in Healthcare Industry Volume (K Unit), by Application 2025 & 2033
- Figure 57: Middle East and Africa Biometric Authentication in Healthcare Industry Revenue Share (%), by Application 2025 & 2033
- Figure 58: Middle East and Africa Biometric Authentication in Healthcare Industry Volume Share (%), by Application 2025 & 2033
- Figure 59: Middle East and Africa Biometric Authentication in Healthcare Industry Revenue (Million), by End User 2025 & 2033
- Figure 60: Middle East and Africa Biometric Authentication in Healthcare Industry Volume (K Unit), by End User 2025 & 2033
- Figure 61: Middle East and Africa Biometric Authentication in Healthcare Industry Revenue Share (%), by End User 2025 & 2033
- Figure 62: Middle East and Africa Biometric Authentication in Healthcare Industry Volume Share (%), by End User 2025 & 2033
- Figure 63: Middle East and Africa Biometric Authentication in Healthcare Industry Revenue (Million), by Country 2025 & 2033
- Figure 64: Middle East and Africa Biometric Authentication in Healthcare Industry Volume (K Unit), by Country 2025 & 2033
- Figure 65: Middle East and Africa Biometric Authentication in Healthcare Industry Revenue Share (%), by Country 2025 & 2033
- Figure 66: Middle East and Africa Biometric Authentication in Healthcare Industry Volume Share (%), by Country 2025 & 2033
- Figure 67: South America Biometric Authentication in Healthcare Industry Revenue (Million), by Technology 2025 & 2033
- Figure 68: South America Biometric Authentication in Healthcare Industry Volume (K Unit), by Technology 2025 & 2033
- Figure 69: South America Biometric Authentication in Healthcare Industry Revenue Share (%), by Technology 2025 & 2033
- Figure 70: South America Biometric Authentication in Healthcare Industry Volume Share (%), by Technology 2025 & 2033
- Figure 71: South America Biometric Authentication in Healthcare Industry Revenue (Million), by Application 2025 & 2033
- Figure 72: South America Biometric Authentication in Healthcare Industry Volume (K Unit), by Application 2025 & 2033
- Figure 73: South America Biometric Authentication in Healthcare Industry Revenue Share (%), by Application 2025 & 2033
- Figure 74: South America Biometric Authentication in Healthcare Industry Volume Share (%), by Application 2025 & 2033
- Figure 75: South America Biometric Authentication in Healthcare Industry Revenue (Million), by End User 2025 & 2033
- Figure 76: South America Biometric Authentication in Healthcare Industry Volume (K Unit), by End User 2025 & 2033
- Figure 77: South America Biometric Authentication in Healthcare Industry Revenue Share (%), by End User 2025 & 2033
- Figure 78: South America Biometric Authentication in Healthcare Industry Volume Share (%), by End User 2025 & 2033
- Figure 79: South America Biometric Authentication in Healthcare Industry Revenue (Million), by Country 2025 & 2033
- Figure 80: South America Biometric Authentication in Healthcare Industry Volume (K Unit), by Country 2025 & 2033
- Figure 81: South America Biometric Authentication in Healthcare Industry Revenue Share (%), by Country 2025 & 2033
- Figure 82: South America Biometric Authentication in Healthcare Industry Volume Share (%), by Country 2025 & 2033
List of Tables
- Table 1: Global Biometric Authentication in Healthcare Industry Revenue Million Forecast, by Technology 2020 & 2033
- Table 2: Global Biometric Authentication in Healthcare Industry Volume K Unit Forecast, by Technology 2020 & 2033
- Table 3: Global Biometric Authentication in Healthcare Industry Revenue Million Forecast, by Application 2020 & 2033
- Table 4: Global Biometric Authentication in Healthcare Industry Volume K Unit Forecast, by Application 2020 & 2033
- Table 5: Global Biometric Authentication in Healthcare Industry Revenue Million Forecast, by End User 2020 & 2033
- Table 6: Global Biometric Authentication in Healthcare Industry Volume K Unit Forecast, by End User 2020 & 2033
- Table 7: Global Biometric Authentication in Healthcare Industry Revenue Million Forecast, by Region 2020 & 2033
- Table 8: Global Biometric Authentication in Healthcare Industry Volume K Unit Forecast, by Region 2020 & 2033
- Table 9: Global Biometric Authentication in Healthcare Industry Revenue Million Forecast, by Technology 2020 & 2033
- Table 10: Global Biometric Authentication in Healthcare Industry Volume K Unit Forecast, by Technology 2020 & 2033
- Table 11: Global Biometric Authentication in Healthcare Industry Revenue Million Forecast, by Application 2020 & 2033
- Table 12: Global Biometric Authentication in Healthcare Industry Volume K Unit Forecast, by Application 2020 & 2033
- Table 13: Global Biometric Authentication in Healthcare Industry Revenue Million Forecast, by End User 2020 & 2033
- Table 14: Global Biometric Authentication in Healthcare Industry Volume K Unit Forecast, by End User 2020 & 2033
- Table 15: Global Biometric Authentication in Healthcare Industry Revenue Million Forecast, by Country 2020 & 2033
- Table 16: Global Biometric Authentication in Healthcare Industry Volume K Unit Forecast, by Country 2020 & 2033
- Table 17: United States Biometric Authentication in Healthcare Industry Revenue (Million) Forecast, by Application 2020 & 2033
- Table 18: United States Biometric Authentication in Healthcare Industry Volume (K Unit) Forecast, by Application 2020 & 2033
- Table 19: Canada Biometric Authentication in Healthcare Industry Revenue (Million) Forecast, by Application 2020 & 2033
- Table 20: Canada Biometric Authentication in Healthcare Industry Volume (K Unit) Forecast, by Application 2020 & 2033
- Table 21: Mexico Biometric Authentication in Healthcare Industry Revenue (Million) Forecast, by Application 2020 & 2033
- Table 22: Mexico Biometric Authentication in Healthcare Industry Volume (K Unit) Forecast, by Application 2020 & 2033
- Table 23: Global Biometric Authentication in Healthcare Industry Revenue Million Forecast, by Technology 2020 & 2033
- Table 24: Global Biometric Authentication in Healthcare Industry Volume K Unit Forecast, by Technology 2020 & 2033
- Table 25: Global Biometric Authentication in Healthcare Industry Revenue Million Forecast, by Application 2020 & 2033
- Table 26: Global Biometric Authentication in Healthcare Industry Volume K Unit Forecast, by Application 2020 & 2033
- Table 27: Global Biometric Authentication in Healthcare Industry Revenue Million Forecast, by End User 2020 & 2033
- Table 28: Global Biometric Authentication in Healthcare Industry Volume K Unit Forecast, by End User 2020 & 2033
- Table 29: Global Biometric Authentication in Healthcare Industry Revenue Million Forecast, by Country 2020 & 2033
- Table 30: Global Biometric Authentication in Healthcare Industry Volume K Unit Forecast, by Country 2020 & 2033
- Table 31: Germany Biometric Authentication in Healthcare Industry Revenue (Million) Forecast, by Application 2020 & 2033
- Table 32: Germany Biometric Authentication in Healthcare Industry Volume (K Unit) Forecast, by Application 2020 & 2033
- Table 33: United Kingdom Biometric Authentication in Healthcare Industry Revenue (Million) Forecast, by Application 2020 & 2033
- Table 34: United Kingdom Biometric Authentication in Healthcare Industry Volume (K Unit) Forecast, by Application 2020 & 2033
- Table 35: France Biometric Authentication in Healthcare Industry Revenue (Million) Forecast, by Application 2020 & 2033
- Table 36: France Biometric Authentication in Healthcare Industry Volume (K Unit) Forecast, by Application 2020 & 2033
- Table 37: Italy Biometric Authentication in Healthcare Industry Revenue (Million) Forecast, by Application 2020 & 2033
- Table 38: Italy Biometric Authentication in Healthcare Industry Volume (K Unit) Forecast, by Application 2020 & 2033
- Table 39: Spain Biometric Authentication in Healthcare Industry Revenue (Million) Forecast, by Application 2020 & 2033
- Table 40: Spain Biometric Authentication in Healthcare Industry Volume (K Unit) Forecast, by Application 2020 & 2033
- Table 41: Rest of Europe Biometric Authentication in Healthcare Industry Revenue (Million) Forecast, by Application 2020 & 2033
- Table 42: Rest of Europe Biometric Authentication in Healthcare Industry Volume (K Unit) Forecast, by Application 2020 & 2033
- Table 43: Global Biometric Authentication in Healthcare Industry Revenue Million Forecast, by Technology 2020 & 2033
- Table 44: Global Biometric Authentication in Healthcare Industry Volume K Unit Forecast, by Technology 2020 & 2033
- Table 45: Global Biometric Authentication in Healthcare Industry Revenue Million Forecast, by Application 2020 & 2033
- Table 46: Global Biometric Authentication in Healthcare Industry Volume K Unit Forecast, by Application 2020 & 2033
- Table 47: Global Biometric Authentication in Healthcare Industry Revenue Million Forecast, by End User 2020 & 2033
- Table 48: Global Biometric Authentication in Healthcare Industry Volume K Unit Forecast, by End User 2020 & 2033
- Table 49: Global Biometric Authentication in Healthcare Industry Revenue Million Forecast, by Country 2020 & 2033
- Table 50: Global Biometric Authentication in Healthcare Industry Volume K Unit Forecast, by Country 2020 & 2033
- Table 51: China Biometric Authentication in Healthcare Industry Revenue (Million) Forecast, by Application 2020 & 2033
- Table 52: China Biometric Authentication in Healthcare Industry Volume (K Unit) Forecast, by Application 2020 & 2033
- Table 53: Japan Biometric Authentication in Healthcare Industry Revenue (Million) Forecast, by Application 2020 & 2033
- Table 54: Japan Biometric Authentication in Healthcare Industry Volume (K Unit) Forecast, by Application 2020 & 2033
- Table 55: India Biometric Authentication in Healthcare Industry Revenue (Million) Forecast, by Application 2020 & 2033
- Table 56: India Biometric Authentication in Healthcare Industry Volume (K Unit) Forecast, by Application 2020 & 2033
- Table 57: Australia Biometric Authentication in Healthcare Industry Revenue (Million) Forecast, by Application 2020 & 2033
- Table 58: Australia Biometric Authentication in Healthcare Industry Volume (K Unit) Forecast, by Application 2020 & 2033
- Table 59: South Korea Biometric Authentication in Healthcare Industry Revenue (Million) Forecast, by Application 2020 & 2033
- Table 60: South Korea Biometric Authentication in Healthcare Industry Volume (K Unit) Forecast, by Application 2020 & 2033
- Table 61: Rest of Asia Pacific Biometric Authentication in Healthcare Industry Revenue (Million) Forecast, by Application 2020 & 2033
- Table 62: Rest of Asia Pacific Biometric Authentication in Healthcare Industry Volume (K Unit) Forecast, by Application 2020 & 2033
- Table 63: Global Biometric Authentication in Healthcare Industry Revenue Million Forecast, by Technology 2020 & 2033
- Table 64: Global Biometric Authentication in Healthcare Industry Volume K Unit Forecast, by Technology 2020 & 2033
- Table 65: Global Biometric Authentication in Healthcare Industry Revenue Million Forecast, by Application 2020 & 2033
- Table 66: Global Biometric Authentication in Healthcare Industry Volume K Unit Forecast, by Application 2020 & 2033
- Table 67: Global Biometric Authentication in Healthcare Industry Revenue Million Forecast, by End User 2020 & 2033
- Table 68: Global Biometric Authentication in Healthcare Industry Volume K Unit Forecast, by End User 2020 & 2033
- Table 69: Global Biometric Authentication in Healthcare Industry Revenue Million Forecast, by Country 2020 & 2033
- Table 70: Global Biometric Authentication in Healthcare Industry Volume K Unit Forecast, by Country 2020 & 2033
- Table 71: GCC Biometric Authentication in Healthcare Industry Revenue (Million) Forecast, by Application 2020 & 2033
- Table 72: GCC Biometric Authentication in Healthcare Industry Volume (K Unit) Forecast, by Application 2020 & 2033
- Table 73: South Africa Biometric Authentication in Healthcare Industry Revenue (Million) Forecast, by Application 2020 & 2033
- Table 74: South Africa Biometric Authentication in Healthcare Industry Volume (K Unit) Forecast, by Application 2020 & 2033
- Table 75: Rest of Middle East and Africa Biometric Authentication in Healthcare Industry Revenue (Million) Forecast, by Application 2020 & 2033
- Table 76: Rest of Middle East and Africa Biometric Authentication in Healthcare Industry Volume (K Unit) Forecast, by Application 2020 & 2033
- Table 77: Global Biometric Authentication in Healthcare Industry Revenue Million Forecast, by Technology 2020 & 2033
- Table 78: Global Biometric Authentication in Healthcare Industry Volume K Unit Forecast, by Technology 2020 & 2033
- Table 79: Global Biometric Authentication in Healthcare Industry Revenue Million Forecast, by Application 2020 & 2033
- Table 80: Global Biometric Authentication in Healthcare Industry Volume K Unit Forecast, by Application 2020 & 2033
- Table 81: Global Biometric Authentication in Healthcare Industry Revenue Million Forecast, by End User 2020 & 2033
- Table 82: Global Biometric Authentication in Healthcare Industry Volume K Unit Forecast, by End User 2020 & 2033
- Table 83: Global Biometric Authentication in Healthcare Industry Revenue Million Forecast, by Country 2020 & 2033
- Table 84: Global Biometric Authentication in Healthcare Industry Volume K Unit Forecast, by Country 2020 & 2033
- Table 85: Brazil Biometric Authentication in Healthcare Industry Revenue (Million) Forecast, by Application 2020 & 2033
- Table 86: Brazil Biometric Authentication in Healthcare Industry Volume (K Unit) Forecast, by Application 2020 & 2033
- Table 87: Argentina Biometric Authentication in Healthcare Industry Revenue (Million) Forecast, by Application 2020 & 2033
- Table 88: Argentina Biometric Authentication in Healthcare Industry Volume (K Unit) Forecast, by Application 2020 & 2033
- Table 89: Rest of South America Biometric Authentication in Healthcare Industry Revenue (Million) Forecast, by Application 2020 & 2033
- Table 90: Rest of South America Biometric Authentication in Healthcare Industry Volume (K Unit) Forecast, by Application 2020 & 2033
Frequently Asked Questions
1. What is the projected Compound Annual Growth Rate (CAGR) of the Biometric Authentication in Healthcare Industry?
The projected CAGR is approximately 21.29%.
2. Which companies are prominent players in the Biometric Authentication in Healthcare Industry?
Key companies in the market include Morpho, Suprema Inc, Lumidigm, Integrated Biometrics, Thales Group, Fujitsu Limited, Facetec Inc , Crossmatch Technologies Inc, Bio-Key International Inc, Imprivata Inc, NEC Corporation, Zkteco Inc.
3. What are the main segments of the Biometric Authentication in Healthcare Industry?
The market segments include Technology, Application, End User.
4. Can you provide details about the market size?
The market size is estimated to be USD 10.02 Million as of 2022.
5. What are some drivers contributing to market growth?
Implementation of Government Initiatives Supporting the Adoption of Biometrics in Healthcare; Rising Incidence of Healthcare Data Breaches and Medical Identity Theft.
6. What are the notable trends driving market growth?
Multifactor-factor Authentication is Expected to Cover a Large Share of the Market Over the Forecast Period.
7. Are there any restraints impacting market growth?
High Cost of Biometric Devices; Issues Related to the Use of Biometric Technologies.
8. Can you provide examples of recent developments in the market?
In March 2022, BioIntelliSense, has launched its medical-grade BioButton Rechargeable wearable device. The new BioButton Rechargeable device allows for continuous multi-parameter monitoring of a broad range of 20+ vital signs and physiologic biometrics for up to 30 days on a single charge, based on configuration.
9. What pricing options are available for accessing the report?
Pricing options include single-user, multi-user, and enterprise licenses priced at USD 4750, USD 5250, and USD 8750 respectively.
10. Is the market size provided in terms of value or volume?
The market size is provided in terms of value, measured in Million and volume, measured in K Unit.
11. Are there any specific market keywords associated with the report?
Yes, the market keyword associated with the report is "Biometric Authentication in Healthcare Industry," which aids in identifying and referencing the specific market segment covered.
12. How do I determine which pricing option suits my needs best?
The pricing options vary based on user requirements and access needs. Individual users may opt for single-user licenses, while businesses requiring broader access may choose multi-user or enterprise licenses for cost-effective access to the report.
13. Are there any additional resources or data provided in the Biometric Authentication in Healthcare Industry report?
While the report offers comprehensive insights, it's advisable to review the specific contents or supplementary materials provided to ascertain if additional resources or data are available.
14. How can I stay updated on further developments or reports in the Biometric Authentication in Healthcare Industry?
To stay informed about further developments, trends, and reports in the Biometric Authentication in Healthcare Industry, consider subscribing to industry newsletters, following relevant companies and organizations, or regularly checking reputable industry news sources and publications.
Methodology
Step 1 - Identification of Relevant Samples Size from Population Database


Step 2 - Approaches for Defining Global Market Size (Value, Volume* & Price*)

Note*: In applicable scenarios
Step 3 - Data Sources
Primary Research
- Web Analytics
- Survey Reports
- Research Institute
- Latest Research Reports
- Opinion Leaders
Secondary Research
- Annual Reports
- White Paper
- Latest Press Release
- Industry Association
- Paid Database
- Investor Presentations

Step 4 - Data Triangulation
Involves using different sources of information in order to increase the validity of a study
These sources are likely to be stakeholders in a program - participants, other researchers, program staff, other community members, and so on.
Then we put all data in single framework & apply various statistical tools to find out the dynamic on the market.
During the analysis stage, feedback from the stakeholder groups would be compared to determine areas of agreement as well as areas of divergence