
Key Insights
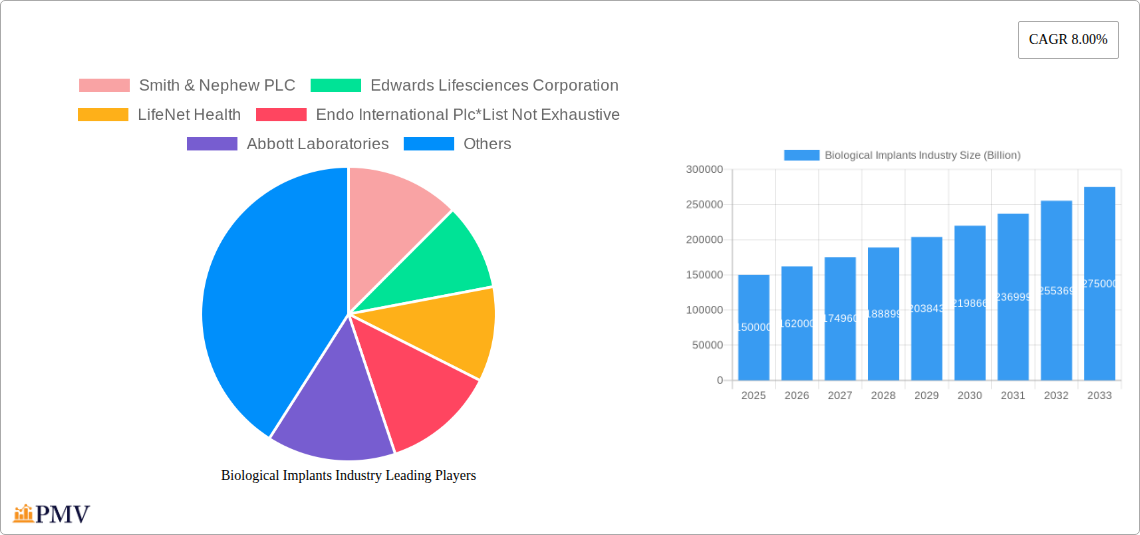
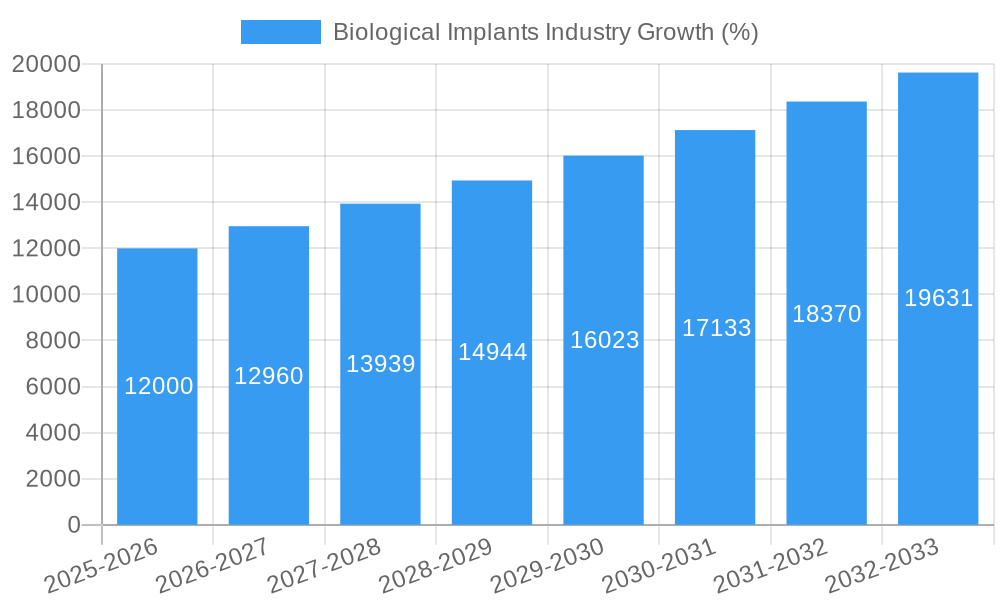
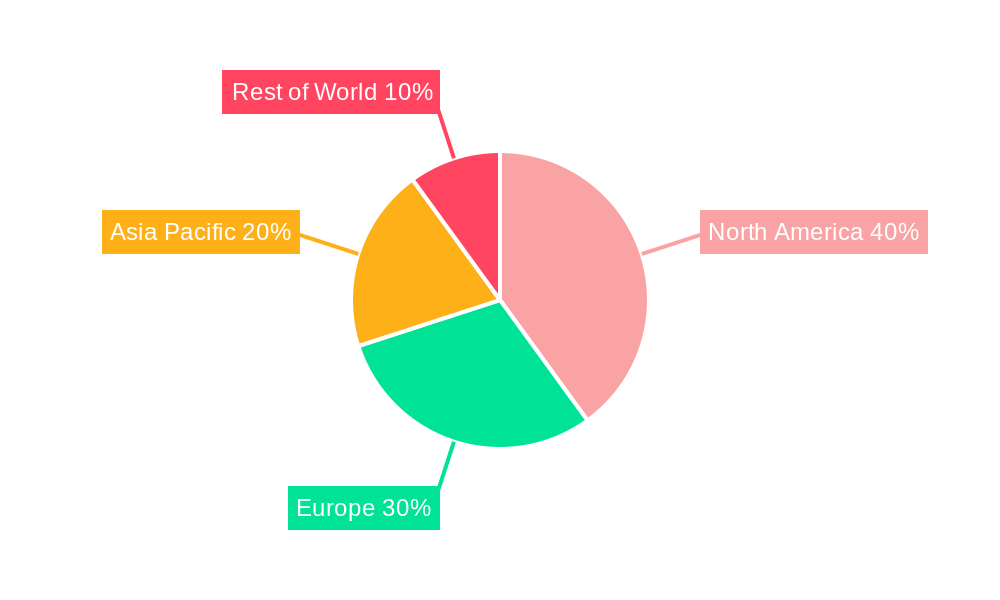
The global biological implants market is experiencing robust growth, projected to reach a substantial size driven by several key factors. An 8% CAGR from 2019 to 2033 indicates a significant expansion, fueled by the increasing prevalence of chronic diseases like osteoarthritis and cardiovascular ailments necessitating implant procedures. Technological advancements in biomaterials, leading to improved implant biocompatibility, longevity, and functionality, further contribute to market expansion. The aging global population, with its higher susceptibility to age-related conditions requiring implants, significantly boosts demand. The market is segmented by implant type (cardiovascular, spinal, orthopedic, dental, ophthalmic, and others) and material (biomaterial metals and alloys, polymers, and others), reflecting diverse application areas and material choices influencing market dynamics. Cardiovascular implants currently hold a leading market share due to rising heart disease prevalence, while orthopedic implants are also a major segment, driven by the increasing incidence of trauma and age-related joint degeneration. Growth is geographically diverse, with North America and Europe currently dominating due to advanced healthcare infrastructure and higher adoption rates, while Asia-Pacific shows high growth potential driven by rising disposable incomes and improving healthcare access. However, high implant costs, stringent regulatory approvals, and potential complications associated with implant procedures remain key restraints.
Despite these challenges, the market is expected to witness substantial growth. The development of minimally invasive surgical techniques is lowering procedure-related risks and improving patient outcomes, further stimulating market expansion. Furthermore, ongoing research into bio-integrated implants, focusing on enhanced biocompatibility and reducing the risk of rejection, will likely drive innovation and expand market opportunities. Companies involved in the manufacturing, distribution, and research and development of bio-implants are strategic players in this market, constantly striving to innovate and meet the growing demand. The market’s future trajectory will likely be influenced by further technological breakthroughs, evolving regulatory landscapes, and changing patient demographics. The focus on personalized medicine and customized implants is also expected to play a vital role in shaping market trends over the next decade.
Biological Implants Industry: Market Analysis & Forecast Report (2019-2033)
This comprehensive report provides a detailed analysis of the global Biological Implants market, offering invaluable insights for stakeholders across the industry. With a study period spanning 2019-2033, a base year of 2025, and an estimated and forecast period of 2025-2033, this report utilizes a robust methodology to project future market trends. The market is expected to reach a value of XX Billion by 2033, exhibiting a CAGR of XX% during the forecast period. The report segments the market by type of bio-implants and material, providing a granular understanding of the market dynamics. Key players like Smith & Nephew PLC, Edwards Lifesciences Corporation, and Stryker Corporation are profiled, showcasing their market positioning and strategic initiatives.
Biological Implants Industry Market Structure & Competitive Dynamics
The Biological Implants industry is characterized by a moderately concentrated market structure, with several large multinational corporations holding significant market share. The market share distribution is dynamic, shaped by continuous innovation, strategic acquisitions, and regulatory changes. Innovation ecosystems are robust, driven by collaborations between research institutions, medical device companies, and regulatory bodies. Stringent regulatory frameworks, particularly those involving FDA approvals in major markets, significantly impact market entry and product lifecycle management. Product substitutes, while limited, are emerging, creating competitive pressure. End-user trends lean toward minimally invasive procedures and personalized medicine, leading to demand for advanced implant technologies. M&A activities remain prevalent, with deal values in the billions reflecting the industry's consolidation and pursuit of technological advancements. For instance, in 2024, the total value of M&A deals in this sector reached approximately XX Billion.
- Market Concentration: High, with top 10 players controlling approximately XX% of the market.
- Innovation Ecosystem: Strong, featuring collaborations across academia, industry, and regulatory agencies.
- Regulatory Frameworks: Stringent, emphasizing safety and efficacy, impacting time-to-market for new products.
- M&A Activity: Significant, with a growing number of acquisitions and mergers driving market consolidation and technological advancements. The total value of such deals in 2024 was approximately XX Billion.
Biological Implants Industry Industry Trends & Insights
The Biological Implants market is experiencing robust growth, driven primarily by an aging global population, rising prevalence of chronic diseases requiring implants, and technological advancements leading to improved implant designs and surgical techniques. The increasing demand for minimally invasive procedures contributes significantly to market expansion. Technological disruptions, such as the adoption of 3D printing for customized implants and the development of biocompatible materials, are reshaping the competitive landscape. Consumer preferences are shifting towards implants with improved biocompatibility, longer lifespan, and reduced complications. The competitive dynamics are intense, characterized by continuous innovation, strategic partnerships, and geographic expansion. The market penetration of advanced implants is gradually increasing, driven by technological advancements and rising healthcare expenditure.
Dominant Markets & Segments in Biological Implants Industry
The global biological implants market is dominated by North America and Europe, accounting for approximately XX Billion in revenue in 2024. Within these regions, the United States and Germany stand out as key markets due to strong healthcare infrastructure, high technological adoption, and significant investments in medical research. However, the Asia-Pacific region is projected to exhibit the fastest growth during the forecast period, driven by factors such as a rapidly expanding elderly population, rising disposable incomes, and improving healthcare infrastructure in several emerging economies.
By Type of Bio-implants:
- Orthopedic Implants: Largest segment, driven by rising incidence of osteoarthritis and trauma-related injuries.
- Cardiovascular Implants: Significant market share, fueled by the increasing prevalence of cardiovascular diseases.
- Dental Implants: Growing steadily, driven by the rising demand for cosmetic dentistry and improved dental implant technology.
By Material:
- Biomaterial Metal and Alloys: Dominant segment due to strength, durability, and biocompatibility.
- Polymers: Growing segment, due to increasing demand for flexible and bioabsorbable materials.
Key Drivers:
- Strong healthcare infrastructure and high healthcare expenditure.
- Technological advancements leading to improved implant designs and surgical techniques.
- Aging population and rising prevalence of chronic diseases.
- Government initiatives and favorable regulatory environment.
Biological Implants Industry Product Innovations
Recent innovations in biological implants focus on enhanced biocompatibility, improved longevity, and minimally invasive surgical techniques. 3D printing technologies allow for the creation of highly customized implants tailored to individual patient needs, leading to better outcomes and faster recovery times. Bioabsorbable materials are gaining traction, reducing the need for a second surgery for implant removal. These advancements are driving market growth by improving patient outcomes and reducing the overall cost of treatment.
Report Segmentation & Scope
This report provides a comprehensive segmentation of the Biological Implants market based on type of bio-implants and material.
By Type of Bio-implants: The report analyzes Cardiovascular Implants (projected XX Billion in 2033), Spinal Implants (projected XX Billion in 2033), Orthopedic Implants (projected XX Billion in 2033), Dental Implants (projected XX Billion in 2033), Ophthalmic Implants (projected XX Billion in 2033), and Other Implants (projected XX Billion in 2033). Each segment's market size, growth projections, and competitive dynamics are thoroughly examined.
By Material: The market is segmented into Biomaterial Metal and Alloys, Polymers, and Other Materials. The report details the market size, growth trajectory, and competitive landscape of each material category.
Key Drivers of Biological Implants Industry Growth
Several factors propel the growth of the Biological Implants industry. These include:
- Technological advancements: Development of biocompatible materials, minimally invasive surgical techniques, and 3D printing for customized implants.
- Rising prevalence of chronic diseases: Aging populations and increased incidence of conditions like osteoarthritis, cardiovascular disease, and spinal disorders drive demand.
- Favorable regulatory environment: Government support for medical technology innovation and improved healthcare infrastructure.
Challenges in the Biological Implants Industry Sector
The Biological Implants industry faces several challenges, including:
- Stringent regulatory approvals: Lengthy and costly approval processes can delay product launches.
- High manufacturing costs: Advanced materials and complex manufacturing processes result in high production costs.
- Intense competition: The presence of numerous established players creates a highly competitive market.
- Supply chain disruptions: Global events can impact the availability of raw materials and components.
Leading Players in the Biological Implants Industry Market
- Smith & Nephew PLC
- Edwards Lifesciences Corporation
- LifeNet Health
- Endo International Plc
- Abbott Laboratories
- Bausch & Lomb Incorporated
- MiMeDX
- Stryker Corporation
- BIOTRONIK Inc
- Boston Scientific Corporation
- Zimmer Biomet
- aap Implantate AG
Key Developments in Biological Implants Industry Sector
- June 2022: ZimVie launched the FDA-cleared T3 pro tampered implant and Encode emergence Healing Abutment in the United States. This launch expanded their product portfolio and strengthened their position in the market.
- April 2022: The Orthopaedic Implant Company (OIC) received FDA clearance and launched the high-valve dorsal scanning plate. This broadened OIC's orthopedic trauma portfolio, enhancing its competitiveness.
Strategic Biological Implants Industry Market Outlook
The Biological Implants market exhibits significant future potential, driven by continued technological advancements, rising healthcare expenditure, and the growing prevalence of chronic diseases. Strategic opportunities lie in developing innovative implant designs, expanding into emerging markets, and forging strategic partnerships to accelerate product development and market penetration. The focus on personalized medicine and minimally invasive procedures will continue to drive market growth, creating opportunities for companies that can deliver innovative and patient-centric solutions.
Biological Implants Industry Segmentation
-
1. Type of Bio-implants
- 1.1. Cardiovascular Implants
- 1.2. Spinal implants
- 1.3. Orthopedic Implants
- 1.4. Dental Implants
- 1.5. Ophthalmic Implants
- 1.6. Other Implants
-
2. Material
- 2.1. Biomaterial Metal and Alloys
- 2.2. Polymers
- 2.3. Other Materials
Biological Implants Industry Segmentation By Geography
-
1. North America
- 1.1. United States
- 1.2. Canada
- 1.3. Mexico
-
2. Europe
- 2.1. Germany
- 2.2. United Kingdom
- 2.3. France
- 2.4. Italy
- 2.5. Spain
- 2.6. Rest of Europe
-
3. Asia Pacific
- 3.1. China
- 3.2. Japan
- 3.3. India
- 3.4. Australia
- 3.5. South Korea
- 3.6. Rest of Asia Pacific
-
4. Middle East and Africa
- 4.1. GCC
- 4.2. South Africa
- 4.3. Rest of Middle East and Africa
-
5. South America
- 5.1. Brazil
- 5.2. Argentina
- 5.3. Rest of South America
Biological Implants Industry REPORT HIGHLIGHTS
| Aspects | Details |
|---|---|
| Study Period | 2019-2033 |
| Base Year | 2024 |
| Estimated Year | 2025 |
| Forecast Period | 2025-2033 |
| Historical Period | 2019-2024 |
| Growth Rate | CAGR of 8.00% from 2019-2033 |
| Segmentation |
|
Table of Contents
- 1. Introduction
- 1.1. Research Scope
- 1.2. Market Segmentation
- 1.3. Research Methodology
- 1.4. Definitions and Assumptions
- 2. Executive Summary
- 2.1. Introduction
- 3. Market Dynamics
- 3.1. Introduction
- 3.2. Market Drivers
- 3.2.1. Increasing Burden of Chronic Diseases and Lifestyle Disorders; Rising Preference toward Minimally Invasive Surgeries
- 3.3. Market Restrains
- 3.3.1. High Cost of Bio-implants; Unfavorable Reimbursement Policies
- 3.4. Market Trends
- 3.4.1. Cardiovascular Implants Segment is Expected to Hold the Large Share in the Bio-Implant Market Over the Forecast Period.
- 4. Market Factor Analysis
- 4.1. Porters Five Forces
- 4.2. Supply/Value Chain
- 4.3. PESTEL analysis
- 4.4. Market Entropy
- 4.5. Patent/Trademark Analysis
- 5. Global Biological Implants Industry Analysis, Insights and Forecast, 2019-2031
- 5.1. Market Analysis, Insights and Forecast - by Type of Bio-implants
- 5.1.1. Cardiovascular Implants
- 5.1.2. Spinal implants
- 5.1.3. Orthopedic Implants
- 5.1.4. Dental Implants
- 5.1.5. Ophthalmic Implants
- 5.1.6. Other Implants
- 5.2. Market Analysis, Insights and Forecast - by Material
- 5.2.1. Biomaterial Metal and Alloys
- 5.2.2. Polymers
- 5.2.3. Other Materials
- 5.3. Market Analysis, Insights and Forecast - by Region
- 5.3.1. North America
- 5.3.2. Europe
- 5.3.3. Asia Pacific
- 5.3.4. Middle East and Africa
- 5.3.5. South America
- 5.1. Market Analysis, Insights and Forecast - by Type of Bio-implants
- 6. North America Biological Implants Industry Analysis, Insights and Forecast, 2019-2031
- 6.1. Market Analysis, Insights and Forecast - by Type of Bio-implants
- 6.1.1. Cardiovascular Implants
- 6.1.2. Spinal implants
- 6.1.3. Orthopedic Implants
- 6.1.4. Dental Implants
- 6.1.5. Ophthalmic Implants
- 6.1.6. Other Implants
- 6.2. Market Analysis, Insights and Forecast - by Material
- 6.2.1. Biomaterial Metal and Alloys
- 6.2.2. Polymers
- 6.2.3. Other Materials
- 6.1. Market Analysis, Insights and Forecast - by Type of Bio-implants
- 7. Europe Biological Implants Industry Analysis, Insights and Forecast, 2019-2031
- 7.1. Market Analysis, Insights and Forecast - by Type of Bio-implants
- 7.1.1. Cardiovascular Implants
- 7.1.2. Spinal implants
- 7.1.3. Orthopedic Implants
- 7.1.4. Dental Implants
- 7.1.5. Ophthalmic Implants
- 7.1.6. Other Implants
- 7.2. Market Analysis, Insights and Forecast - by Material
- 7.2.1. Biomaterial Metal and Alloys
- 7.2.2. Polymers
- 7.2.3. Other Materials
- 7.1. Market Analysis, Insights and Forecast - by Type of Bio-implants
- 8. Asia Pacific Biological Implants Industry Analysis, Insights and Forecast, 2019-2031
- 8.1. Market Analysis, Insights and Forecast - by Type of Bio-implants
- 8.1.1. Cardiovascular Implants
- 8.1.2. Spinal implants
- 8.1.3. Orthopedic Implants
- 8.1.4. Dental Implants
- 8.1.5. Ophthalmic Implants
- 8.1.6. Other Implants
- 8.2. Market Analysis, Insights and Forecast - by Material
- 8.2.1. Biomaterial Metal and Alloys
- 8.2.2. Polymers
- 8.2.3. Other Materials
- 8.1. Market Analysis, Insights and Forecast - by Type of Bio-implants
- 9. Middle East and Africa Biological Implants Industry Analysis, Insights and Forecast, 2019-2031
- 9.1. Market Analysis, Insights and Forecast - by Type of Bio-implants
- 9.1.1. Cardiovascular Implants
- 9.1.2. Spinal implants
- 9.1.3. Orthopedic Implants
- 9.1.4. Dental Implants
- 9.1.5. Ophthalmic Implants
- 9.1.6. Other Implants
- 9.2. Market Analysis, Insights and Forecast - by Material
- 9.2.1. Biomaterial Metal and Alloys
- 9.2.2. Polymers
- 9.2.3. Other Materials
- 9.1. Market Analysis, Insights and Forecast - by Type of Bio-implants
- 10. South America Biological Implants Industry Analysis, Insights and Forecast, 2019-2031
- 10.1. Market Analysis, Insights and Forecast - by Type of Bio-implants
- 10.1.1. Cardiovascular Implants
- 10.1.2. Spinal implants
- 10.1.3. Orthopedic Implants
- 10.1.4. Dental Implants
- 10.1.5. Ophthalmic Implants
- 10.1.6. Other Implants
- 10.2. Market Analysis, Insights and Forecast - by Material
- 10.2.1. Biomaterial Metal and Alloys
- 10.2.2. Polymers
- 10.2.3. Other Materials
- 10.1. Market Analysis, Insights and Forecast - by Type of Bio-implants
- 11. North Americ Biological Implants Industry Analysis, Insights and Forecast, 2019-2031
- 11.1. Market Analysis, Insights and Forecast - By Country/Sub-region
- 11.1.1 United States
- 11.1.2 Canada
- 11.1.3 Mexico
- 12. South America Biological Implants Industry Analysis, Insights and Forecast, 2019-2031
- 12.1. Market Analysis, Insights and Forecast - By Country/Sub-region
- 12.1.1 Brazil
- 12.1.2 Mexico
- 12.1.3 Rest of South America
- 13. Europe Biological Implants Industry Analysis, Insights and Forecast, 2019-2031
- 13.1. Market Analysis, Insights and Forecast - By Country/Sub-region
- 13.1.1 Germany
- 13.1.2 United Kingdom
- 13.1.3 France
- 13.1.4 Italy
- 13.1.5 Spain
- 13.1.6 Rest of Europe
- 14. Asia Pacific Biological Implants Industry Analysis, Insights and Forecast, 2019-2031
- 14.1. Market Analysis, Insights and Forecast - By Country/Sub-region
- 14.1.1 China
- 14.1.2 Japan
- 14.1.3 India
- 14.1.4 South Korea
- 14.1.5 Taiwan
- 14.1.6 Australia
- 14.1.7 Rest of Asia-Pacific
- 15. MEA Biological Implants Industry Analysis, Insights and Forecast, 2019-2031
- 15.1. Market Analysis, Insights and Forecast - By Country/Sub-region
- 15.1.1 Middle East
- 15.1.2 Africa
- 16. Competitive Analysis
- 16.1. Global Market Share Analysis 2024
- 16.2. Company Profiles
- 16.2.1 Smith & Nephew PLC
- 16.2.1.1. Overview
- 16.2.1.2. Products
- 16.2.1.3. SWOT Analysis
- 16.2.1.4. Recent Developments
- 16.2.1.5. Financials (Based on Availability)
- 16.2.2 Edwards Lifesciences Corporation
- 16.2.2.1. Overview
- 16.2.2.2. Products
- 16.2.2.3. SWOT Analysis
- 16.2.2.4. Recent Developments
- 16.2.2.5. Financials (Based on Availability)
- 16.2.3 LifeNet Health
- 16.2.3.1. Overview
- 16.2.3.2. Products
- 16.2.3.3. SWOT Analysis
- 16.2.3.4. Recent Developments
- 16.2.3.5. Financials (Based on Availability)
- 16.2.4 Endo International Plc*List Not Exhaustive
- 16.2.4.1. Overview
- 16.2.4.2. Products
- 16.2.4.3. SWOT Analysis
- 16.2.4.4. Recent Developments
- 16.2.4.5. Financials (Based on Availability)
- 16.2.5 Abbott Laboratories
- 16.2.5.1. Overview
- 16.2.5.2. Products
- 16.2.5.3. SWOT Analysis
- 16.2.5.4. Recent Developments
- 16.2.5.5. Financials (Based on Availability)
- 16.2.6 Bausch & Lomb Incorporated
- 16.2.6.1. Overview
- 16.2.6.2. Products
- 16.2.6.3. SWOT Analysis
- 16.2.6.4. Recent Developments
- 16.2.6.5. Financials (Based on Availability)
- 16.2.7 MiMeDX
- 16.2.7.1. Overview
- 16.2.7.2. Products
- 16.2.7.3. SWOT Analysis
- 16.2.7.4. Recent Developments
- 16.2.7.5. Financials (Based on Availability)
- 16.2.8 Stryker Corporation
- 16.2.8.1. Overview
- 16.2.8.2. Products
- 16.2.8.3. SWOT Analysis
- 16.2.8.4. Recent Developments
- 16.2.8.5. Financials (Based on Availability)
- 16.2.9 BIOTRONIK Inc
- 16.2.9.1. Overview
- 16.2.9.2. Products
- 16.2.9.3. SWOT Analysis
- 16.2.9.4. Recent Developments
- 16.2.9.5. Financials (Based on Availability)
- 16.2.10 Boston Scientific Corporation
- 16.2.10.1. Overview
- 16.2.10.2. Products
- 16.2.10.3. SWOT Analysis
- 16.2.10.4. Recent Developments
- 16.2.10.5. Financials (Based on Availability)
- 16.2.11 Zimmer Biomet
- 16.2.11.1. Overview
- 16.2.11.2. Products
- 16.2.11.3. SWOT Analysis
- 16.2.11.4. Recent Developments
- 16.2.11.5. Financials (Based on Availability)
- 16.2.12 aap Implantate AG
- 16.2.12.1. Overview
- 16.2.12.2. Products
- 16.2.12.3. SWOT Analysis
- 16.2.12.4. Recent Developments
- 16.2.12.5. Financials (Based on Availability)
- 16.2.1 Smith & Nephew PLC
List of Figures
- Figure 1: Global Biological Implants Industry Revenue Breakdown (Billion, %) by Region 2024 & 2032
- Figure 2: North Americ Biological Implants Industry Revenue (Billion), by Country 2024 & 2032
- Figure 3: North Americ Biological Implants Industry Revenue Share (%), by Country 2024 & 2032
- Figure 4: South America Biological Implants Industry Revenue (Billion), by Country 2024 & 2032
- Figure 5: South America Biological Implants Industry Revenue Share (%), by Country 2024 & 2032
- Figure 6: Europe Biological Implants Industry Revenue (Billion), by Country 2024 & 2032
- Figure 7: Europe Biological Implants Industry Revenue Share (%), by Country 2024 & 2032
- Figure 8: Asia Pacific Biological Implants Industry Revenue (Billion), by Country 2024 & 2032
- Figure 9: Asia Pacific Biological Implants Industry Revenue Share (%), by Country 2024 & 2032
- Figure 10: MEA Biological Implants Industry Revenue (Billion), by Country 2024 & 2032
- Figure 11: MEA Biological Implants Industry Revenue Share (%), by Country 2024 & 2032
- Figure 12: North America Biological Implants Industry Revenue (Billion), by Type of Bio-implants 2024 & 2032
- Figure 13: North America Biological Implants Industry Revenue Share (%), by Type of Bio-implants 2024 & 2032
- Figure 14: North America Biological Implants Industry Revenue (Billion), by Material 2024 & 2032
- Figure 15: North America Biological Implants Industry Revenue Share (%), by Material 2024 & 2032
- Figure 16: North America Biological Implants Industry Revenue (Billion), by Country 2024 & 2032
- Figure 17: North America Biological Implants Industry Revenue Share (%), by Country 2024 & 2032
- Figure 18: Europe Biological Implants Industry Revenue (Billion), by Type of Bio-implants 2024 & 2032
- Figure 19: Europe Biological Implants Industry Revenue Share (%), by Type of Bio-implants 2024 & 2032
- Figure 20: Europe Biological Implants Industry Revenue (Billion), by Material 2024 & 2032
- Figure 21: Europe Biological Implants Industry Revenue Share (%), by Material 2024 & 2032
- Figure 22: Europe Biological Implants Industry Revenue (Billion), by Country 2024 & 2032
- Figure 23: Europe Biological Implants Industry Revenue Share (%), by Country 2024 & 2032
- Figure 24: Asia Pacific Biological Implants Industry Revenue (Billion), by Type of Bio-implants 2024 & 2032
- Figure 25: Asia Pacific Biological Implants Industry Revenue Share (%), by Type of Bio-implants 2024 & 2032
- Figure 26: Asia Pacific Biological Implants Industry Revenue (Billion), by Material 2024 & 2032
- Figure 27: Asia Pacific Biological Implants Industry Revenue Share (%), by Material 2024 & 2032
- Figure 28: Asia Pacific Biological Implants Industry Revenue (Billion), by Country 2024 & 2032
- Figure 29: Asia Pacific Biological Implants Industry Revenue Share (%), by Country 2024 & 2032
- Figure 30: Middle East and Africa Biological Implants Industry Revenue (Billion), by Type of Bio-implants 2024 & 2032
- Figure 31: Middle East and Africa Biological Implants Industry Revenue Share (%), by Type of Bio-implants 2024 & 2032
- Figure 32: Middle East and Africa Biological Implants Industry Revenue (Billion), by Material 2024 & 2032
- Figure 33: Middle East and Africa Biological Implants Industry Revenue Share (%), by Material 2024 & 2032
- Figure 34: Middle East and Africa Biological Implants Industry Revenue (Billion), by Country 2024 & 2032
- Figure 35: Middle East and Africa Biological Implants Industry Revenue Share (%), by Country 2024 & 2032
- Figure 36: South America Biological Implants Industry Revenue (Billion), by Type of Bio-implants 2024 & 2032
- Figure 37: South America Biological Implants Industry Revenue Share (%), by Type of Bio-implants 2024 & 2032
- Figure 38: South America Biological Implants Industry Revenue (Billion), by Material 2024 & 2032
- Figure 39: South America Biological Implants Industry Revenue Share (%), by Material 2024 & 2032
- Figure 40: South America Biological Implants Industry Revenue (Billion), by Country 2024 & 2032
- Figure 41: South America Biological Implants Industry Revenue Share (%), by Country 2024 & 2032
List of Tables
- Table 1: Global Biological Implants Industry Revenue Billion Forecast, by Region 2019 & 2032
- Table 2: Global Biological Implants Industry Revenue Billion Forecast, by Type of Bio-implants 2019 & 2032
- Table 3: Global Biological Implants Industry Revenue Billion Forecast, by Material 2019 & 2032
- Table 4: Global Biological Implants Industry Revenue Billion Forecast, by Region 2019 & 2032
- Table 5: Global Biological Implants Industry Revenue Billion Forecast, by Country 2019 & 2032
- Table 6: United States Biological Implants Industry Revenue (Billion) Forecast, by Application 2019 & 2032
- Table 7: Canada Biological Implants Industry Revenue (Billion) Forecast, by Application 2019 & 2032
- Table 8: Mexico Biological Implants Industry Revenue (Billion) Forecast, by Application 2019 & 2032
- Table 9: Global Biological Implants Industry Revenue Billion Forecast, by Country 2019 & 2032
- Table 10: Brazil Biological Implants Industry Revenue (Billion) Forecast, by Application 2019 & 2032
- Table 11: Mexico Biological Implants Industry Revenue (Billion) Forecast, by Application 2019 & 2032
- Table 12: Rest of South America Biological Implants Industry Revenue (Billion) Forecast, by Application 2019 & 2032
- Table 13: Global Biological Implants Industry Revenue Billion Forecast, by Country 2019 & 2032
- Table 14: Germany Biological Implants Industry Revenue (Billion) Forecast, by Application 2019 & 2032
- Table 15: United Kingdom Biological Implants Industry Revenue (Billion) Forecast, by Application 2019 & 2032
- Table 16: France Biological Implants Industry Revenue (Billion) Forecast, by Application 2019 & 2032
- Table 17: Italy Biological Implants Industry Revenue (Billion) Forecast, by Application 2019 & 2032
- Table 18: Spain Biological Implants Industry Revenue (Billion) Forecast, by Application 2019 & 2032
- Table 19: Rest of Europe Biological Implants Industry Revenue (Billion) Forecast, by Application 2019 & 2032
- Table 20: Global Biological Implants Industry Revenue Billion Forecast, by Country 2019 & 2032
- Table 21: China Biological Implants Industry Revenue (Billion) Forecast, by Application 2019 & 2032
- Table 22: Japan Biological Implants Industry Revenue (Billion) Forecast, by Application 2019 & 2032
- Table 23: India Biological Implants Industry Revenue (Billion) Forecast, by Application 2019 & 2032
- Table 24: South Korea Biological Implants Industry Revenue (Billion) Forecast, by Application 2019 & 2032
- Table 25: Taiwan Biological Implants Industry Revenue (Billion) Forecast, by Application 2019 & 2032
- Table 26: Australia Biological Implants Industry Revenue (Billion) Forecast, by Application 2019 & 2032
- Table 27: Rest of Asia-Pacific Biological Implants Industry Revenue (Billion) Forecast, by Application 2019 & 2032
- Table 28: Global Biological Implants Industry Revenue Billion Forecast, by Country 2019 & 2032
- Table 29: Middle East Biological Implants Industry Revenue (Billion) Forecast, by Application 2019 & 2032
- Table 30: Africa Biological Implants Industry Revenue (Billion) Forecast, by Application 2019 & 2032
- Table 31: Global Biological Implants Industry Revenue Billion Forecast, by Type of Bio-implants 2019 & 2032
- Table 32: Global Biological Implants Industry Revenue Billion Forecast, by Material 2019 & 2032
- Table 33: Global Biological Implants Industry Revenue Billion Forecast, by Country 2019 & 2032
- Table 34: United States Biological Implants Industry Revenue (Billion) Forecast, by Application 2019 & 2032
- Table 35: Canada Biological Implants Industry Revenue (Billion) Forecast, by Application 2019 & 2032
- Table 36: Mexico Biological Implants Industry Revenue (Billion) Forecast, by Application 2019 & 2032
- Table 37: Global Biological Implants Industry Revenue Billion Forecast, by Type of Bio-implants 2019 & 2032
- Table 38: Global Biological Implants Industry Revenue Billion Forecast, by Material 2019 & 2032
- Table 39: Global Biological Implants Industry Revenue Billion Forecast, by Country 2019 & 2032
- Table 40: Germany Biological Implants Industry Revenue (Billion) Forecast, by Application 2019 & 2032
- Table 41: United Kingdom Biological Implants Industry Revenue (Billion) Forecast, by Application 2019 & 2032
- Table 42: France Biological Implants Industry Revenue (Billion) Forecast, by Application 2019 & 2032
- Table 43: Italy Biological Implants Industry Revenue (Billion) Forecast, by Application 2019 & 2032
- Table 44: Spain Biological Implants Industry Revenue (Billion) Forecast, by Application 2019 & 2032
- Table 45: Rest of Europe Biological Implants Industry Revenue (Billion) Forecast, by Application 2019 & 2032
- Table 46: Global Biological Implants Industry Revenue Billion Forecast, by Type of Bio-implants 2019 & 2032
- Table 47: Global Biological Implants Industry Revenue Billion Forecast, by Material 2019 & 2032
- Table 48: Global Biological Implants Industry Revenue Billion Forecast, by Country 2019 & 2032
- Table 49: China Biological Implants Industry Revenue (Billion) Forecast, by Application 2019 & 2032
- Table 50: Japan Biological Implants Industry Revenue (Billion) Forecast, by Application 2019 & 2032
- Table 51: India Biological Implants Industry Revenue (Billion) Forecast, by Application 2019 & 2032
- Table 52: Australia Biological Implants Industry Revenue (Billion) Forecast, by Application 2019 & 2032
- Table 53: South Korea Biological Implants Industry Revenue (Billion) Forecast, by Application 2019 & 2032
- Table 54: Rest of Asia Pacific Biological Implants Industry Revenue (Billion) Forecast, by Application 2019 & 2032
- Table 55: Global Biological Implants Industry Revenue Billion Forecast, by Type of Bio-implants 2019 & 2032
- Table 56: Global Biological Implants Industry Revenue Billion Forecast, by Material 2019 & 2032
- Table 57: Global Biological Implants Industry Revenue Billion Forecast, by Country 2019 & 2032
- Table 58: GCC Biological Implants Industry Revenue (Billion) Forecast, by Application 2019 & 2032
- Table 59: South Africa Biological Implants Industry Revenue (Billion) Forecast, by Application 2019 & 2032
- Table 60: Rest of Middle East and Africa Biological Implants Industry Revenue (Billion) Forecast, by Application 2019 & 2032
- Table 61: Global Biological Implants Industry Revenue Billion Forecast, by Type of Bio-implants 2019 & 2032
- Table 62: Global Biological Implants Industry Revenue Billion Forecast, by Material 2019 & 2032
- Table 63: Global Biological Implants Industry Revenue Billion Forecast, by Country 2019 & 2032
- Table 64: Brazil Biological Implants Industry Revenue (Billion) Forecast, by Application 2019 & 2032
- Table 65: Argentina Biological Implants Industry Revenue (Billion) Forecast, by Application 2019 & 2032
- Table 66: Rest of South America Biological Implants Industry Revenue (Billion) Forecast, by Application 2019 & 2032
Frequently Asked Questions
1. What is the projected Compound Annual Growth Rate (CAGR) of the Biological Implants Industry?
The projected CAGR is approximately 8.00%.
2. Which companies are prominent players in the Biological Implants Industry?
Key companies in the market include Smith & Nephew PLC, Edwards Lifesciences Corporation, LifeNet Health, Endo International Plc*List Not Exhaustive, Abbott Laboratories, Bausch & Lomb Incorporated, MiMeDX, Stryker Corporation, BIOTRONIK Inc, Boston Scientific Corporation, Zimmer Biomet, aap Implantate AG.
3. What are the main segments of the Biological Implants Industry?
The market segments include Type of Bio-implants, Material.
4. Can you provide details about the market size?
The market size is estimated to be USD XX Billion as of 2022.
5. What are some drivers contributing to market growth?
Increasing Burden of Chronic Diseases and Lifestyle Disorders; Rising Preference toward Minimally Invasive Surgeries.
6. What are the notable trends driving market growth?
Cardiovascular Implants Segment is Expected to Hold the Large Share in the Bio-Implant Market Over the Forecast Period..
7. Are there any restraints impacting market growth?
High Cost of Bio-implants; Unfavorable Reimbursement Policies.
8. Can you provide examples of recent developments in the market?
June 2022: ZimVie launched the Food and Drug Administration cleared T3 pro tampered implant and Encode emergence Healing Abutment in the United States.
9. What pricing options are available for accessing the report?
Pricing options include single-user, multi-user, and enterprise licenses priced at USD 4750, USD 5250, and USD 8750 respectively.
10. Is the market size provided in terms of value or volume?
The market size is provided in terms of value, measured in Billion.
11. Are there any specific market keywords associated with the report?
Yes, the market keyword associated with the report is "Biological Implants Industry," which aids in identifying and referencing the specific market segment covered.
12. How do I determine which pricing option suits my needs best?
The pricing options vary based on user requirements and access needs. Individual users may opt for single-user licenses, while businesses requiring broader access may choose multi-user or enterprise licenses for cost-effective access to the report.
13. Are there any additional resources or data provided in the Biological Implants Industry report?
While the report offers comprehensive insights, it's advisable to review the specific contents or supplementary materials provided to ascertain if additional resources or data are available.
14. How can I stay updated on further developments or reports in the Biological Implants Industry?
To stay informed about further developments, trends, and reports in the Biological Implants Industry, consider subscribing to industry newsletters, following relevant companies and organizations, or regularly checking reputable industry news sources and publications.
Methodology
Step 1 - Identification of Relevant Samples Size from Population Database


Step 2 - Approaches for Defining Global Market Size (Value, Volume* & Price*)

Note*: In applicable scenarios
Step 3 - Data Sources
Primary Research
- Web Analytics
- Survey Reports
- Research Institute
- Latest Research Reports
- Opinion Leaders
Secondary Research
- Annual Reports
- White Paper
- Latest Press Release
- Industry Association
- Paid Database
- Investor Presentations

Step 4 - Data Triangulation
Involves using different sources of information in order to increase the validity of a study
These sources are likely to be stakeholders in a program - participants, other researchers, program staff, other community members, and so on.
Then we put all data in single framework & apply various statistical tools to find out the dynamic on the market.
During the analysis stage, feedback from the stakeholder groups would be compared to determine areas of agreement as well as areas of divergence


