
Key Insights
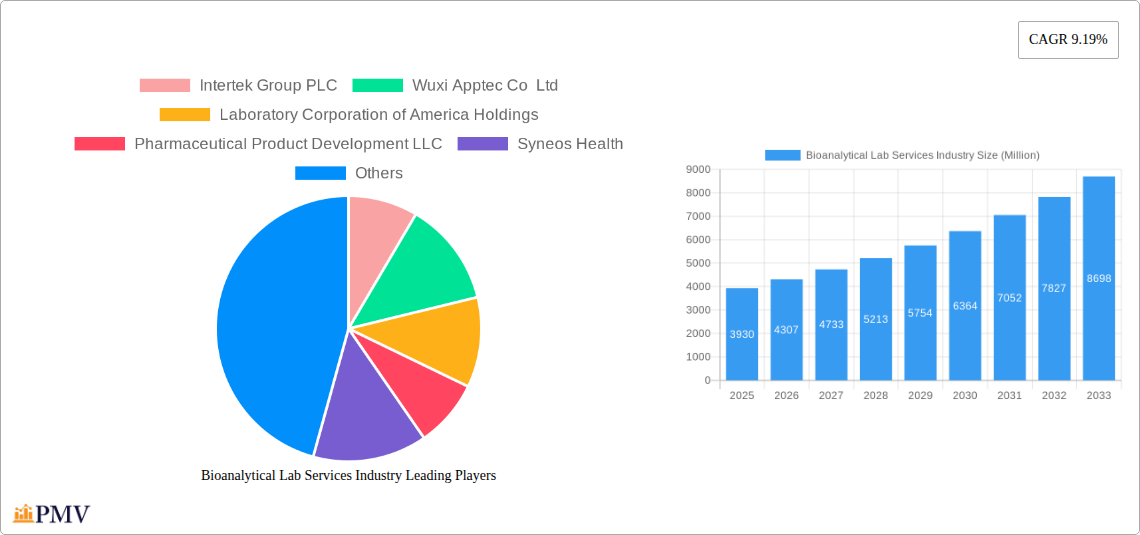
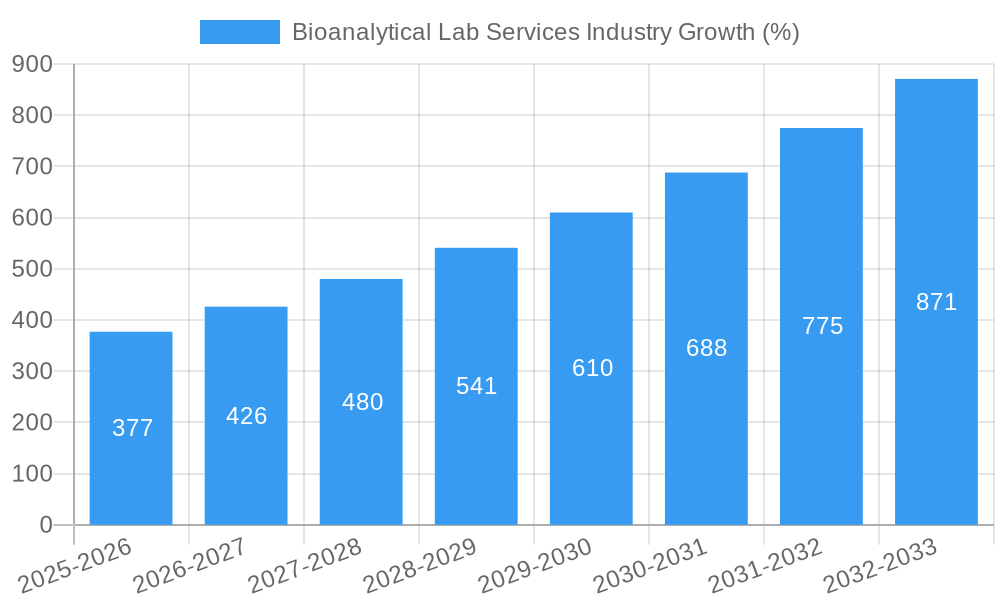
The global bioanalytical lab services market, valued at $3.93 billion in 2025, is projected to experience robust growth, driven by the increasing demand for new drug development and the rising prevalence of chronic diseases. This necessitates extensive bioanalytical testing throughout the drug lifecycle, from pre-clinical studies to post-market surveillance. Key drivers include the burgeoning pharmaceutical and biotechnology industries, growing investments in research and development (R&D), and the increasing adoption of advanced analytical techniques like LC-MS/MS and bioassays. The market is segmented by molecule type (small and large molecules) and test type (bioavailability and bioequivalence studies, pharmacokinetics, pharmacodynamics, and others). Large molecule testing is experiencing particularly rapid growth due to the increasing development of biologics and biosimilars. Furthermore, outsourcing of bioanalytical services is gaining traction as pharmaceutical companies focus on core competencies, leading to increased demand for contract research organizations (CROs). Geographic expansion is also a notable trend, with regions like Asia Pacific showing significant growth potential driven by increasing R&D investments and a large patient population. Regulatory changes and stringent quality control standards act as potential restraints, demanding robust infrastructure and experienced personnel.
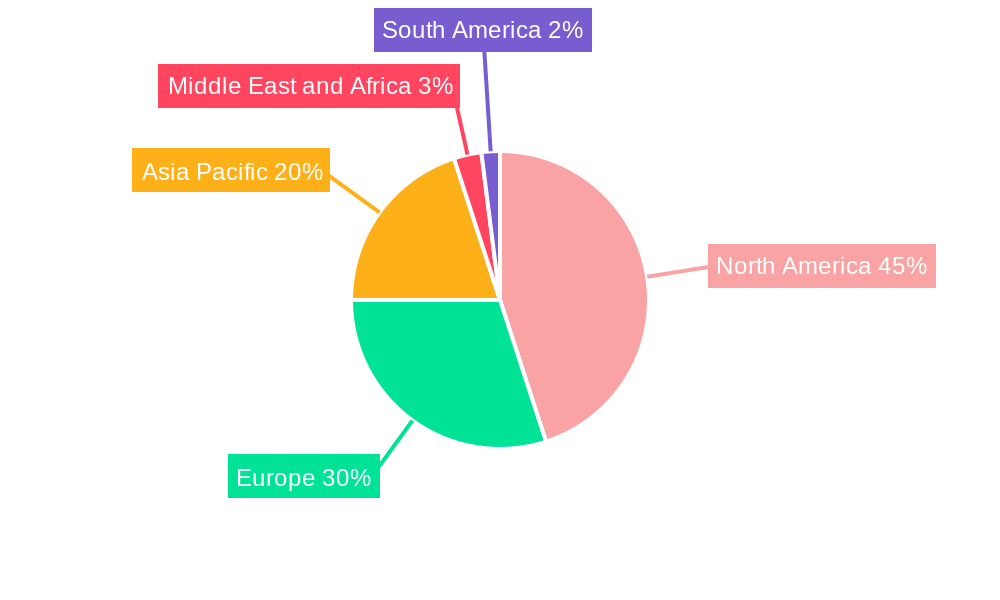
The competitive landscape is characterized by both large multinational corporations and smaller specialized companies. Key players like Intertek, Wuxi AppTec, and Charles River Laboratories are leveraging their established expertise and global reach to capture significant market share. However, the market is also witnessing increasing competition from smaller niche players specializing in specific analytical techniques or therapeutic areas. Given the 9.19% CAGR, the market is expected to surpass $7 billion by 2033, reflecting a significant expansion across all segments and regions. North America currently dominates the market due to high R&D expenditure and a mature pharmaceutical sector, but Asia-Pacific is anticipated to witness the most substantial growth over the forecast period. The continued evolution of analytical technologies, coupled with increasing clinical trial activity, will further fuel market expansion in the coming years.
Bioanalytical Lab Services Industry: A Comprehensive Market Report (2019-2033)
This comprehensive report provides an in-depth analysis of the Bioanalytical Lab Services industry, offering invaluable insights for stakeholders, investors, and industry professionals. The study covers the period 2019-2033, with a focus on the forecast period 2025-2033, using 2025 as the base and estimated year. The report projects a market value exceeding $XX Million by 2033, showcasing significant growth potential.
Bioanalytical Lab Services Industry Market Structure & Competitive Dynamics
The global bioanalytical lab services market exhibits a moderately consolidated structure, with several key players holding significant market share. Intertek Group PLC, Wuxi Apptec Co Ltd, Laboratory Corporation of America Holdings, Pharmaceutical Product Development LLC, Syneos Health, ICON PLC, Charles River Laboratories International Inc, SGS SA, and Toxikon Corporation are among the dominant players, collectively accounting for an estimated xx% of the market in 2025. Market concentration is influenced by factors including economies of scale, technological capabilities, and regulatory compliance. The industry's innovation ecosystem is robust, driven by continuous advancements in analytical techniques and a growing demand for sophisticated bioanalytical testing. Stringent regulatory frameworks, particularly from agencies like the FDA and EMA, significantly impact operational procedures and market access. Product substitutes are limited, primarily due to the specialized nature of bioanalytical testing. End-user trends, predominantly driven by the pharmaceutical and biotechnology sectors, favor providers with advanced capabilities in high-throughput screening and complex bioanalytical assays. M&A activity has been significant in recent years, with deal values exceeding $XX Million annually. Notable acquisitions have focused on expanding service portfolios, geographical reach, and technological expertise. For instance, in 2024, Company A acquired Company B for $XX Million, bolstering its capabilities in large molecule analysis.
Bioanalytical Lab Services Industry Industry Trends & Insights
The bioanalytical lab services market is experiencing robust growth, driven by several key factors. The rising prevalence of chronic diseases, coupled with the increasing demand for novel therapeutics, fuels the need for comprehensive bioanalytical testing. The market's compound annual growth rate (CAGR) is projected to be xx% during the forecast period (2025-2033), exceeding previous growth rates (Historical Period CAGR: xx%). Technological disruptions, particularly the adoption of automation, AI, and advanced analytical techniques (e.g., LC-MS/MS, mass spectrometry), are enhancing efficiency and accuracy, driving market penetration. Consumer preferences increasingly lean toward outsourcing bioanalytical testing due to cost-effectiveness and access to specialized expertise. Competitive dynamics remain intense, with companies striving to differentiate their services through technological innovation, faster turnaround times, and data-driven insights. The market penetration of advanced analytical techniques like liquid chromatography-mass spectrometry (LC-MS) is steadily increasing, reaching an estimated xx% in 2025.
Dominant Markets & Segments in Bioanalytical Lab Services Industry
North America currently holds the largest market share in the bioanalytical lab services industry, driven by robust pharmaceutical R&D spending, a well-established regulatory framework, and the presence of major players. Within North America, the United States is the leading market.
By Molecule Type: The small molecule segment dominates, accounting for approximately xx% of the market in 2025, primarily due to the large number of small molecule drugs under development. The large molecule segment is growing rapidly, fueled by the increasing popularity of biologics and biosimilars.
By Test Type: Bioavailability and bioequivalence studies represent the largest segment, driven by regulatory requirements for demonstrating drug efficacy and safety. Pharmacokinetics (PK) and pharmacodynamics (PD) studies are also significant segments, providing crucial data for drug development and optimization. Other test types, including immunogenicity and metabolite identification, are experiencing substantial growth due to increasing demand.
Key drivers for North America's dominance include:
- Strong government support for pharmaceutical research and development.
- High concentration of pharmaceutical and biotechnology companies.
- Advanced technological infrastructure.
- Well-established regulatory framework.
Bioanalytical Lab Services Industry Product Innovations
Recent product innovations in the bioanalytical lab services sector primarily focus on enhancing efficiency, accuracy, and throughput. This includes the integration of automation, advanced software analytics, and sophisticated instrumentation. Miniaturization techniques and development of high-throughput assays are gaining traction, offering substantial cost savings and faster turnaround times. These advancements create a competitive advantage by enabling faster drug development timelines and improved data quality. The market is also witnessing the rise of specialized services catering to specific therapeutic areas, such as oncology and immunology.
Report Segmentation & Scope
This report segments the bioanalytical lab services market by molecule type (small molecules and large molecules) and test type (bioavailability and bioequivalence studies, pharmacokinetics, pharmacodynamics, and other test types). Each segment is analyzed in detail, providing insights into market size, growth projections, and competitive dynamics. The small molecule segment is expected to grow at a CAGR of xx% during the forecast period, while the large molecule segment is projected to experience a CAGR of xx%. Within the test types, bioavailability and bioequivalence studies are anticipated to grow steadily, driven by stringent regulatory requirements. The pharmacokinetics and pharmacodynamics segments are also expected to exhibit significant growth. The "other test types" segment represents a growing area offering specialized and niche analytical services that cater to various therapeutic areas and clinical trial requirements.
Key Drivers of Bioanalytical Lab Services Industry Growth
The bioanalytical lab services industry's growth is propelled by several key drivers. Firstly, the burgeoning pharmaceutical and biotechnology industries, fueled by rising investments in research and development, significantly increase demand for bioanalytical testing services. Secondly, stringent regulatory requirements for drug approval necessitate accurate and reliable bioanalytical data. Thirdly, technological advancements, such as automation and advanced analytical techniques, are increasing the efficiency and accuracy of bioanalytical testing. Finally, the growing prevalence of chronic diseases globally fuels the need for new and improved therapies, further stimulating demand for bioanalytical services.
Challenges in the Bioanalytical Lab Services Industry Sector
The bioanalytical lab services industry faces several key challenges. Stringent regulatory requirements and compliance costs can be substantial, posing a barrier to entry for smaller companies. Supply chain disruptions and scarcity of skilled labor can affect operational efficiency and service delivery. Finally, intense competition among established players and new entrants exerts pressure on pricing and profit margins. These challenges can impact market growth and profitability, hence necessitate strategic adaptation by industry players. The cumulative impact of these challenges is estimated to reduce the industry's projected growth by approximately xx% by 2033.
Leading Players in the Bioanalytical Lab Services Industry Market
- Intertek Group PLC
- Wuxi Apptec Co Ltd
- Laboratory Corporation of America Holdings
- Pharmaceutical Product Development LLC
- Syneos Health
- ICON PLC
- Charles River Laboratories International Inc
- SGS SA
- Toxikon Corporation
Key Developments in Bioanalytical Lab Services Industry Sector
- January 2023: Company X launched a new high-throughput bioanalytical platform, significantly increasing its testing capacity.
- June 2022: Company Y acquired Company Z, expanding its service portfolio into large molecule analysis.
- November 2021: New FDA guidelines on bioanalytical method validation were released, impacting industry practices.
- March 2020: The COVID-19 pandemic impacted laboratory operations, causing temporary delays in project timelines.
Strategic Bioanalytical Lab Services Industry Market Outlook
The bioanalytical lab services industry is poised for sustained growth, driven by the ongoing development of novel therapeutics, the increasing prevalence of chronic diseases, and continuous technological advancements. Strategic opportunities lie in expanding into emerging markets, developing specialized services for niche therapeutic areas, and investing in cutting-edge technologies like AI and automation. Companies that can adapt to evolving regulatory landscapes and demonstrate high levels of quality and efficiency will be best positioned for success in this dynamic market. Further consolidation through M&A activity is anticipated, leading to a more concentrated market structure.
Bioanalytical Lab Services Industry Segmentation
-
1. Molecule Type
- 1.1. Small Molecules
- 1.2. Large Molecules
-
2. Test Type
- 2.1. Bioavailability and Bioequivalence Studies
- 2.2. Pharmacokinetics
- 2.3. Pharmacodynamics
- 2.4. Other Test Types
Bioanalytical Lab Services Industry Segmentation By Geography
-
1. North America
- 1.1. US
- 1.2. Canada
- 1.3. Mexico
-
2. Europe
- 2.1. Germany
- 2.2. UK
- 2.3. France
- 2.4. Italy
- 2.5. Spain
- 2.6. Rest of Europe
-
3. Asia Pacific
- 3.1. China
- 3.2. Japan
- 3.3. India
- 3.4. Australia
- 3.5. South Korea
- 3.6. Rest of Asia Pacific
-
4. Middle East and Africa
- 4.1. GCC
- 4.2. South Africa
- 4.3. Rest of Middle East and Africa
-
5. South America
- 5.1. Brazil
- 5.2. Argentina
- 5.3. Rest of South America
Bioanalytical Lab Services Industry REPORT HIGHLIGHTS
| Aspects | Details |
|---|---|
| Study Period | 2019-2033 |
| Base Year | 2024 |
| Estimated Year | 2025 |
| Forecast Period | 2025-2033 |
| Historical Period | 2019-2024 |
| Growth Rate | CAGR of 9.19% from 2019-2033 |
| Segmentation |
|
Table of Contents
- 1. Introduction
- 1.1. Research Scope
- 1.2. Market Segmentation
- 1.3. Research Methodology
- 1.4. Definitions and Assumptions
- 2. Executive Summary
- 2.1. Introduction
- 3. Market Dynamics
- 3.1. Introduction
- 3.2. Market Drivers
- 3.2.1. Increased Necessity of Specific Types of Tests in R&D Activities; Increased Trend of Outsourcing Laboratory Testing Services
- 3.3. Market Restrains
- 3.3.1. Complex Regulatory Framework for Maintaining Laboratories; Challenges in the Development of Proper Analytical Techniques
- 3.4. Market Trends
- 3.4.1. Small Molecule Sub-segment Expected to Show Better Growth in the Bioanalytical Testing Services Market
- 4. Market Factor Analysis
- 4.1. Porters Five Forces
- 4.2. Supply/Value Chain
- 4.3. PESTEL analysis
- 4.4. Market Entropy
- 4.5. Patent/Trademark Analysis
- 5. Global Bioanalytical Lab Services Industry Analysis, Insights and Forecast, 2019-2031
- 5.1. Market Analysis, Insights and Forecast - by Molecule Type
- 5.1.1. Small Molecules
- 5.1.2. Large Molecules
- 5.2. Market Analysis, Insights and Forecast - by Test Type
- 5.2.1. Bioavailability and Bioequivalence Studies
- 5.2.2. Pharmacokinetics
- 5.2.3. Pharmacodynamics
- 5.2.4. Other Test Types
- 5.3. Market Analysis, Insights and Forecast - by Region
- 5.3.1. North America
- 5.3.2. Europe
- 5.3.3. Asia Pacific
- 5.3.4. Middle East and Africa
- 5.3.5. South America
- 5.1. Market Analysis, Insights and Forecast - by Molecule Type
- 6. North America Bioanalytical Lab Services Industry Analysis, Insights and Forecast, 2019-2031
- 6.1. Market Analysis, Insights and Forecast - by Molecule Type
- 6.1.1. Small Molecules
- 6.1.2. Large Molecules
- 6.2. Market Analysis, Insights and Forecast - by Test Type
- 6.2.1. Bioavailability and Bioequivalence Studies
- 6.2.2. Pharmacokinetics
- 6.2.3. Pharmacodynamics
- 6.2.4. Other Test Types
- 6.1. Market Analysis, Insights and Forecast - by Molecule Type
- 7. Europe Bioanalytical Lab Services Industry Analysis, Insights and Forecast, 2019-2031
- 7.1. Market Analysis, Insights and Forecast - by Molecule Type
- 7.1.1. Small Molecules
- 7.1.2. Large Molecules
- 7.2. Market Analysis, Insights and Forecast - by Test Type
- 7.2.1. Bioavailability and Bioequivalence Studies
- 7.2.2. Pharmacokinetics
- 7.2.3. Pharmacodynamics
- 7.2.4. Other Test Types
- 7.1. Market Analysis, Insights and Forecast - by Molecule Type
- 8. Asia Pacific Bioanalytical Lab Services Industry Analysis, Insights and Forecast, 2019-2031
- 8.1. Market Analysis, Insights and Forecast - by Molecule Type
- 8.1.1. Small Molecules
- 8.1.2. Large Molecules
- 8.2. Market Analysis, Insights and Forecast - by Test Type
- 8.2.1. Bioavailability and Bioequivalence Studies
- 8.2.2. Pharmacokinetics
- 8.2.3. Pharmacodynamics
- 8.2.4. Other Test Types
- 8.1. Market Analysis, Insights and Forecast - by Molecule Type
- 9. Middle East and Africa Bioanalytical Lab Services Industry Analysis, Insights and Forecast, 2019-2031
- 9.1. Market Analysis, Insights and Forecast - by Molecule Type
- 9.1.1. Small Molecules
- 9.1.2. Large Molecules
- 9.2. Market Analysis, Insights and Forecast - by Test Type
- 9.2.1. Bioavailability and Bioequivalence Studies
- 9.2.2. Pharmacokinetics
- 9.2.3. Pharmacodynamics
- 9.2.4. Other Test Types
- 9.1. Market Analysis, Insights and Forecast - by Molecule Type
- 10. South America Bioanalytical Lab Services Industry Analysis, Insights and Forecast, 2019-2031
- 10.1. Market Analysis, Insights and Forecast - by Molecule Type
- 10.1.1. Small Molecules
- 10.1.2. Large Molecules
- 10.2. Market Analysis, Insights and Forecast - by Test Type
- 10.2.1. Bioavailability and Bioequivalence Studies
- 10.2.2. Pharmacokinetics
- 10.2.3. Pharmacodynamics
- 10.2.4. Other Test Types
- 10.1. Market Analysis, Insights and Forecast - by Molecule Type
- 11. North America Bioanalytical Lab Services Industry Analysis, Insights and Forecast, 2019-2031
- 11.1. Market Analysis, Insights and Forecast - By Country/Sub-region
- 11.1.1 US
- 11.1.2 Canada
- 11.1.3 Mexico
- 12. Europe Bioanalytical Lab Services Industry Analysis, Insights and Forecast, 2019-2031
- 12.1. Market Analysis, Insights and Forecast - By Country/Sub-region
- 12.1.1 Germany
- 12.1.2 UK
- 12.1.3 France
- 12.1.4 Italy
- 12.1.5 Spain
- 12.1.6 Rest of Europe
- 13. Asia Pacific Bioanalytical Lab Services Industry Analysis, Insights and Forecast, 2019-2031
- 13.1. Market Analysis, Insights and Forecast - By Country/Sub-region
- 13.1.1 China
- 13.1.2 Japan
- 13.1.3 India
- 13.1.4 Australia
- 13.1.5 South Korea
- 13.1.6 Rest of Asia Pacific
- 14. Middle East and Africa Bioanalytical Lab Services Industry Analysis, Insights and Forecast, 2019-2031
- 14.1. Market Analysis, Insights and Forecast - By Country/Sub-region
- 14.1.1 GCC
- 14.1.2 South Africa
- 14.1.3 Rest of Middle East and Africa
- 15. South America Bioanalytical Lab Services Industry Analysis, Insights and Forecast, 2019-2031
- 15.1. Market Analysis, Insights and Forecast - By Country/Sub-region
- 15.1.1 Brazil
- 15.1.2 Argentina
- 15.1.3 Rest of South America
- 16. Competitive Analysis
- 16.1. Global Market Share Analysis 2024
- 16.2. Company Profiles
- 16.2.1 Intertek Group PLC
- 16.2.1.1. Overview
- 16.2.1.2. Products
- 16.2.1.3. SWOT Analysis
- 16.2.1.4. Recent Developments
- 16.2.1.5. Financials (Based on Availability)
- 16.2.2 Wuxi Apptec Co Ltd
- 16.2.2.1. Overview
- 16.2.2.2. Products
- 16.2.2.3. SWOT Analysis
- 16.2.2.4. Recent Developments
- 16.2.2.5. Financials (Based on Availability)
- 16.2.3 Laboratory Corporation of America Holdings
- 16.2.3.1. Overview
- 16.2.3.2. Products
- 16.2.3.3. SWOT Analysis
- 16.2.3.4. Recent Developments
- 16.2.3.5. Financials (Based on Availability)
- 16.2.4 Pharmaceutical Product Development LLC
- 16.2.4.1. Overview
- 16.2.4.2. Products
- 16.2.4.3. SWOT Analysis
- 16.2.4.4. Recent Developments
- 16.2.4.5. Financials (Based on Availability)
- 16.2.5 Syneos Health
- 16.2.5.1. Overview
- 16.2.5.2. Products
- 16.2.5.3. SWOT Analysis
- 16.2.5.4. Recent Developments
- 16.2.5.5. Financials (Based on Availability)
- 16.2.6 ICON PLC
- 16.2.6.1. Overview
- 16.2.6.2. Products
- 16.2.6.3. SWOT Analysis
- 16.2.6.4. Recent Developments
- 16.2.6.5. Financials (Based on Availability)
- 16.2.7 Charles River Laboratories International Inc
- 16.2.7.1. Overview
- 16.2.7.2. Products
- 16.2.7.3. SWOT Analysis
- 16.2.7.4. Recent Developments
- 16.2.7.5. Financials (Based on Availability)
- 16.2.8 SGS SA
- 16.2.8.1. Overview
- 16.2.8.2. Products
- 16.2.8.3. SWOT Analysis
- 16.2.8.4. Recent Developments
- 16.2.8.5. Financials (Based on Availability)
- 16.2.9 Toxikon Corporation
- 16.2.9.1. Overview
- 16.2.9.2. Products
- 16.2.9.3. SWOT Analysis
- 16.2.9.4. Recent Developments
- 16.2.9.5. Financials (Based on Availability)
- 16.2.1 Intertek Group PLC
List of Figures
- Figure 1: Global Bioanalytical Lab Services Industry Revenue Breakdown (Million, %) by Region 2024 & 2032
- Figure 2: Global Bioanalytical Lab Services Industry Volume Breakdown (K Unit, %) by Region 2024 & 2032
- Figure 3: North America Bioanalytical Lab Services Industry Revenue (Million), by Country 2024 & 2032
- Figure 4: North America Bioanalytical Lab Services Industry Volume (K Unit), by Country 2024 & 2032
- Figure 5: North America Bioanalytical Lab Services Industry Revenue Share (%), by Country 2024 & 2032
- Figure 6: North America Bioanalytical Lab Services Industry Volume Share (%), by Country 2024 & 2032
- Figure 7: Europe Bioanalytical Lab Services Industry Revenue (Million), by Country 2024 & 2032
- Figure 8: Europe Bioanalytical Lab Services Industry Volume (K Unit), by Country 2024 & 2032
- Figure 9: Europe Bioanalytical Lab Services Industry Revenue Share (%), by Country 2024 & 2032
- Figure 10: Europe Bioanalytical Lab Services Industry Volume Share (%), by Country 2024 & 2032
- Figure 11: Asia Pacific Bioanalytical Lab Services Industry Revenue (Million), by Country 2024 & 2032
- Figure 12: Asia Pacific Bioanalytical Lab Services Industry Volume (K Unit), by Country 2024 & 2032
- Figure 13: Asia Pacific Bioanalytical Lab Services Industry Revenue Share (%), by Country 2024 & 2032
- Figure 14: Asia Pacific Bioanalytical Lab Services Industry Volume Share (%), by Country 2024 & 2032
- Figure 15: Middle East and Africa Bioanalytical Lab Services Industry Revenue (Million), by Country 2024 & 2032
- Figure 16: Middle East and Africa Bioanalytical Lab Services Industry Volume (K Unit), by Country 2024 & 2032
- Figure 17: Middle East and Africa Bioanalytical Lab Services Industry Revenue Share (%), by Country 2024 & 2032
- Figure 18: Middle East and Africa Bioanalytical Lab Services Industry Volume Share (%), by Country 2024 & 2032
- Figure 19: South America Bioanalytical Lab Services Industry Revenue (Million), by Country 2024 & 2032
- Figure 20: South America Bioanalytical Lab Services Industry Volume (K Unit), by Country 2024 & 2032
- Figure 21: South America Bioanalytical Lab Services Industry Revenue Share (%), by Country 2024 & 2032
- Figure 22: South America Bioanalytical Lab Services Industry Volume Share (%), by Country 2024 & 2032
- Figure 23: North America Bioanalytical Lab Services Industry Revenue (Million), by Molecule Type 2024 & 2032
- Figure 24: North America Bioanalytical Lab Services Industry Volume (K Unit), by Molecule Type 2024 & 2032
- Figure 25: North America Bioanalytical Lab Services Industry Revenue Share (%), by Molecule Type 2024 & 2032
- Figure 26: North America Bioanalytical Lab Services Industry Volume Share (%), by Molecule Type 2024 & 2032
- Figure 27: North America Bioanalytical Lab Services Industry Revenue (Million), by Test Type 2024 & 2032
- Figure 28: North America Bioanalytical Lab Services Industry Volume (K Unit), by Test Type 2024 & 2032
- Figure 29: North America Bioanalytical Lab Services Industry Revenue Share (%), by Test Type 2024 & 2032
- Figure 30: North America Bioanalytical Lab Services Industry Volume Share (%), by Test Type 2024 & 2032
- Figure 31: North America Bioanalytical Lab Services Industry Revenue (Million), by Country 2024 & 2032
- Figure 32: North America Bioanalytical Lab Services Industry Volume (K Unit), by Country 2024 & 2032
- Figure 33: North America Bioanalytical Lab Services Industry Revenue Share (%), by Country 2024 & 2032
- Figure 34: North America Bioanalytical Lab Services Industry Volume Share (%), by Country 2024 & 2032
- Figure 35: Europe Bioanalytical Lab Services Industry Revenue (Million), by Molecule Type 2024 & 2032
- Figure 36: Europe Bioanalytical Lab Services Industry Volume (K Unit), by Molecule Type 2024 & 2032
- Figure 37: Europe Bioanalytical Lab Services Industry Revenue Share (%), by Molecule Type 2024 & 2032
- Figure 38: Europe Bioanalytical Lab Services Industry Volume Share (%), by Molecule Type 2024 & 2032
- Figure 39: Europe Bioanalytical Lab Services Industry Revenue (Million), by Test Type 2024 & 2032
- Figure 40: Europe Bioanalytical Lab Services Industry Volume (K Unit), by Test Type 2024 & 2032
- Figure 41: Europe Bioanalytical Lab Services Industry Revenue Share (%), by Test Type 2024 & 2032
- Figure 42: Europe Bioanalytical Lab Services Industry Volume Share (%), by Test Type 2024 & 2032
- Figure 43: Europe Bioanalytical Lab Services Industry Revenue (Million), by Country 2024 & 2032
- Figure 44: Europe Bioanalytical Lab Services Industry Volume (K Unit), by Country 2024 & 2032
- Figure 45: Europe Bioanalytical Lab Services Industry Revenue Share (%), by Country 2024 & 2032
- Figure 46: Europe Bioanalytical Lab Services Industry Volume Share (%), by Country 2024 & 2032
- Figure 47: Asia Pacific Bioanalytical Lab Services Industry Revenue (Million), by Molecule Type 2024 & 2032
- Figure 48: Asia Pacific Bioanalytical Lab Services Industry Volume (K Unit), by Molecule Type 2024 & 2032
- Figure 49: Asia Pacific Bioanalytical Lab Services Industry Revenue Share (%), by Molecule Type 2024 & 2032
- Figure 50: Asia Pacific Bioanalytical Lab Services Industry Volume Share (%), by Molecule Type 2024 & 2032
- Figure 51: Asia Pacific Bioanalytical Lab Services Industry Revenue (Million), by Test Type 2024 & 2032
- Figure 52: Asia Pacific Bioanalytical Lab Services Industry Volume (K Unit), by Test Type 2024 & 2032
- Figure 53: Asia Pacific Bioanalytical Lab Services Industry Revenue Share (%), by Test Type 2024 & 2032
- Figure 54: Asia Pacific Bioanalytical Lab Services Industry Volume Share (%), by Test Type 2024 & 2032
- Figure 55: Asia Pacific Bioanalytical Lab Services Industry Revenue (Million), by Country 2024 & 2032
- Figure 56: Asia Pacific Bioanalytical Lab Services Industry Volume (K Unit), by Country 2024 & 2032
- Figure 57: Asia Pacific Bioanalytical Lab Services Industry Revenue Share (%), by Country 2024 & 2032
- Figure 58: Asia Pacific Bioanalytical Lab Services Industry Volume Share (%), by Country 2024 & 2032
- Figure 59: Middle East and Africa Bioanalytical Lab Services Industry Revenue (Million), by Molecule Type 2024 & 2032
- Figure 60: Middle East and Africa Bioanalytical Lab Services Industry Volume (K Unit), by Molecule Type 2024 & 2032
- Figure 61: Middle East and Africa Bioanalytical Lab Services Industry Revenue Share (%), by Molecule Type 2024 & 2032
- Figure 62: Middle East and Africa Bioanalytical Lab Services Industry Volume Share (%), by Molecule Type 2024 & 2032
- Figure 63: Middle East and Africa Bioanalytical Lab Services Industry Revenue (Million), by Test Type 2024 & 2032
- Figure 64: Middle East and Africa Bioanalytical Lab Services Industry Volume (K Unit), by Test Type 2024 & 2032
- Figure 65: Middle East and Africa Bioanalytical Lab Services Industry Revenue Share (%), by Test Type 2024 & 2032
- Figure 66: Middle East and Africa Bioanalytical Lab Services Industry Volume Share (%), by Test Type 2024 & 2032
- Figure 67: Middle East and Africa Bioanalytical Lab Services Industry Revenue (Million), by Country 2024 & 2032
- Figure 68: Middle East and Africa Bioanalytical Lab Services Industry Volume (K Unit), by Country 2024 & 2032
- Figure 69: Middle East and Africa Bioanalytical Lab Services Industry Revenue Share (%), by Country 2024 & 2032
- Figure 70: Middle East and Africa Bioanalytical Lab Services Industry Volume Share (%), by Country 2024 & 2032
- Figure 71: South America Bioanalytical Lab Services Industry Revenue (Million), by Molecule Type 2024 & 2032
- Figure 72: South America Bioanalytical Lab Services Industry Volume (K Unit), by Molecule Type 2024 & 2032
- Figure 73: South America Bioanalytical Lab Services Industry Revenue Share (%), by Molecule Type 2024 & 2032
- Figure 74: South America Bioanalytical Lab Services Industry Volume Share (%), by Molecule Type 2024 & 2032
- Figure 75: South America Bioanalytical Lab Services Industry Revenue (Million), by Test Type 2024 & 2032
- Figure 76: South America Bioanalytical Lab Services Industry Volume (K Unit), by Test Type 2024 & 2032
- Figure 77: South America Bioanalytical Lab Services Industry Revenue Share (%), by Test Type 2024 & 2032
- Figure 78: South America Bioanalytical Lab Services Industry Volume Share (%), by Test Type 2024 & 2032
- Figure 79: South America Bioanalytical Lab Services Industry Revenue (Million), by Country 2024 & 2032
- Figure 80: South America Bioanalytical Lab Services Industry Volume (K Unit), by Country 2024 & 2032
- Figure 81: South America Bioanalytical Lab Services Industry Revenue Share (%), by Country 2024 & 2032
- Figure 82: South America Bioanalytical Lab Services Industry Volume Share (%), by Country 2024 & 2032
List of Tables
- Table 1: Global Bioanalytical Lab Services Industry Revenue Million Forecast, by Region 2019 & 2032
- Table 2: Global Bioanalytical Lab Services Industry Volume K Unit Forecast, by Region 2019 & 2032
- Table 3: Global Bioanalytical Lab Services Industry Revenue Million Forecast, by Molecule Type 2019 & 2032
- Table 4: Global Bioanalytical Lab Services Industry Volume K Unit Forecast, by Molecule Type 2019 & 2032
- Table 5: Global Bioanalytical Lab Services Industry Revenue Million Forecast, by Test Type 2019 & 2032
- Table 6: Global Bioanalytical Lab Services Industry Volume K Unit Forecast, by Test Type 2019 & 2032
- Table 7: Global Bioanalytical Lab Services Industry Revenue Million Forecast, by Region 2019 & 2032
- Table 8: Global Bioanalytical Lab Services Industry Volume K Unit Forecast, by Region 2019 & 2032
- Table 9: Global Bioanalytical Lab Services Industry Revenue Million Forecast, by Country 2019 & 2032
- Table 10: Global Bioanalytical Lab Services Industry Volume K Unit Forecast, by Country 2019 & 2032
- Table 11: US Bioanalytical Lab Services Industry Revenue (Million) Forecast, by Application 2019 & 2032
- Table 12: US Bioanalytical Lab Services Industry Volume (K Unit) Forecast, by Application 2019 & 2032
- Table 13: Canada Bioanalytical Lab Services Industry Revenue (Million) Forecast, by Application 2019 & 2032
- Table 14: Canada Bioanalytical Lab Services Industry Volume (K Unit) Forecast, by Application 2019 & 2032
- Table 15: Mexico Bioanalytical Lab Services Industry Revenue (Million) Forecast, by Application 2019 & 2032
- Table 16: Mexico Bioanalytical Lab Services Industry Volume (K Unit) Forecast, by Application 2019 & 2032
- Table 17: Global Bioanalytical Lab Services Industry Revenue Million Forecast, by Country 2019 & 2032
- Table 18: Global Bioanalytical Lab Services Industry Volume K Unit Forecast, by Country 2019 & 2032
- Table 19: Germany Bioanalytical Lab Services Industry Revenue (Million) Forecast, by Application 2019 & 2032
- Table 20: Germany Bioanalytical Lab Services Industry Volume (K Unit) Forecast, by Application 2019 & 2032
- Table 21: UK Bioanalytical Lab Services Industry Revenue (Million) Forecast, by Application 2019 & 2032
- Table 22: UK Bioanalytical Lab Services Industry Volume (K Unit) Forecast, by Application 2019 & 2032
- Table 23: France Bioanalytical Lab Services Industry Revenue (Million) Forecast, by Application 2019 & 2032
- Table 24: France Bioanalytical Lab Services Industry Volume (K Unit) Forecast, by Application 2019 & 2032
- Table 25: Italy Bioanalytical Lab Services Industry Revenue (Million) Forecast, by Application 2019 & 2032
- Table 26: Italy Bioanalytical Lab Services Industry Volume (K Unit) Forecast, by Application 2019 & 2032
- Table 27: Spain Bioanalytical Lab Services Industry Revenue (Million) Forecast, by Application 2019 & 2032
- Table 28: Spain Bioanalytical Lab Services Industry Volume (K Unit) Forecast, by Application 2019 & 2032
- Table 29: Rest of Europe Bioanalytical Lab Services Industry Revenue (Million) Forecast, by Application 2019 & 2032
- Table 30: Rest of Europe Bioanalytical Lab Services Industry Volume (K Unit) Forecast, by Application 2019 & 2032
- Table 31: Global Bioanalytical Lab Services Industry Revenue Million Forecast, by Country 2019 & 2032
- Table 32: Global Bioanalytical Lab Services Industry Volume K Unit Forecast, by Country 2019 & 2032
- Table 33: China Bioanalytical Lab Services Industry Revenue (Million) Forecast, by Application 2019 & 2032
- Table 34: China Bioanalytical Lab Services Industry Volume (K Unit) Forecast, by Application 2019 & 2032
- Table 35: Japan Bioanalytical Lab Services Industry Revenue (Million) Forecast, by Application 2019 & 2032
- Table 36: Japan Bioanalytical Lab Services Industry Volume (K Unit) Forecast, by Application 2019 & 2032
- Table 37: India Bioanalytical Lab Services Industry Revenue (Million) Forecast, by Application 2019 & 2032
- Table 38: India Bioanalytical Lab Services Industry Volume (K Unit) Forecast, by Application 2019 & 2032
- Table 39: Australia Bioanalytical Lab Services Industry Revenue (Million) Forecast, by Application 2019 & 2032
- Table 40: Australia Bioanalytical Lab Services Industry Volume (K Unit) Forecast, by Application 2019 & 2032
- Table 41: South Korea Bioanalytical Lab Services Industry Revenue (Million) Forecast, by Application 2019 & 2032
- Table 42: South Korea Bioanalytical Lab Services Industry Volume (K Unit) Forecast, by Application 2019 & 2032
- Table 43: Rest of Asia Pacific Bioanalytical Lab Services Industry Revenue (Million) Forecast, by Application 2019 & 2032
- Table 44: Rest of Asia Pacific Bioanalytical Lab Services Industry Volume (K Unit) Forecast, by Application 2019 & 2032
- Table 45: Global Bioanalytical Lab Services Industry Revenue Million Forecast, by Country 2019 & 2032
- Table 46: Global Bioanalytical Lab Services Industry Volume K Unit Forecast, by Country 2019 & 2032
- Table 47: GCC Bioanalytical Lab Services Industry Revenue (Million) Forecast, by Application 2019 & 2032
- Table 48: GCC Bioanalytical Lab Services Industry Volume (K Unit) Forecast, by Application 2019 & 2032
- Table 49: South Africa Bioanalytical Lab Services Industry Revenue (Million) Forecast, by Application 2019 & 2032
- Table 50: South Africa Bioanalytical Lab Services Industry Volume (K Unit) Forecast, by Application 2019 & 2032
- Table 51: Rest of Middle East and Africa Bioanalytical Lab Services Industry Revenue (Million) Forecast, by Application 2019 & 2032
- Table 52: Rest of Middle East and Africa Bioanalytical Lab Services Industry Volume (K Unit) Forecast, by Application 2019 & 2032
- Table 53: Global Bioanalytical Lab Services Industry Revenue Million Forecast, by Country 2019 & 2032
- Table 54: Global Bioanalytical Lab Services Industry Volume K Unit Forecast, by Country 2019 & 2032
- Table 55: Brazil Bioanalytical Lab Services Industry Revenue (Million) Forecast, by Application 2019 & 2032
- Table 56: Brazil Bioanalytical Lab Services Industry Volume (K Unit) Forecast, by Application 2019 & 2032
- Table 57: Argentina Bioanalytical Lab Services Industry Revenue (Million) Forecast, by Application 2019 & 2032
- Table 58: Argentina Bioanalytical Lab Services Industry Volume (K Unit) Forecast, by Application 2019 & 2032
- Table 59: Rest of South America Bioanalytical Lab Services Industry Revenue (Million) Forecast, by Application 2019 & 2032
- Table 60: Rest of South America Bioanalytical Lab Services Industry Volume (K Unit) Forecast, by Application 2019 & 2032
- Table 61: Global Bioanalytical Lab Services Industry Revenue Million Forecast, by Molecule Type 2019 & 2032
- Table 62: Global Bioanalytical Lab Services Industry Volume K Unit Forecast, by Molecule Type 2019 & 2032
- Table 63: Global Bioanalytical Lab Services Industry Revenue Million Forecast, by Test Type 2019 & 2032
- Table 64: Global Bioanalytical Lab Services Industry Volume K Unit Forecast, by Test Type 2019 & 2032
- Table 65: Global Bioanalytical Lab Services Industry Revenue Million Forecast, by Country 2019 & 2032
- Table 66: Global Bioanalytical Lab Services Industry Volume K Unit Forecast, by Country 2019 & 2032
- Table 67: US Bioanalytical Lab Services Industry Revenue (Million) Forecast, by Application 2019 & 2032
- Table 68: US Bioanalytical Lab Services Industry Volume (K Unit) Forecast, by Application 2019 & 2032
- Table 69: Canada Bioanalytical Lab Services Industry Revenue (Million) Forecast, by Application 2019 & 2032
- Table 70: Canada Bioanalytical Lab Services Industry Volume (K Unit) Forecast, by Application 2019 & 2032
- Table 71: Mexico Bioanalytical Lab Services Industry Revenue (Million) Forecast, by Application 2019 & 2032
- Table 72: Mexico Bioanalytical Lab Services Industry Volume (K Unit) Forecast, by Application 2019 & 2032
- Table 73: Global Bioanalytical Lab Services Industry Revenue Million Forecast, by Molecule Type 2019 & 2032
- Table 74: Global Bioanalytical Lab Services Industry Volume K Unit Forecast, by Molecule Type 2019 & 2032
- Table 75: Global Bioanalytical Lab Services Industry Revenue Million Forecast, by Test Type 2019 & 2032
- Table 76: Global Bioanalytical Lab Services Industry Volume K Unit Forecast, by Test Type 2019 & 2032
- Table 77: Global Bioanalytical Lab Services Industry Revenue Million Forecast, by Country 2019 & 2032
- Table 78: Global Bioanalytical Lab Services Industry Volume K Unit Forecast, by Country 2019 & 2032
- Table 79: Germany Bioanalytical Lab Services Industry Revenue (Million) Forecast, by Application 2019 & 2032
- Table 80: Germany Bioanalytical Lab Services Industry Volume (K Unit) Forecast, by Application 2019 & 2032
- Table 81: UK Bioanalytical Lab Services Industry Revenue (Million) Forecast, by Application 2019 & 2032
- Table 82: UK Bioanalytical Lab Services Industry Volume (K Unit) Forecast, by Application 2019 & 2032
- Table 83: France Bioanalytical Lab Services Industry Revenue (Million) Forecast, by Application 2019 & 2032
- Table 84: France Bioanalytical Lab Services Industry Volume (K Unit) Forecast, by Application 2019 & 2032
- Table 85: Italy Bioanalytical Lab Services Industry Revenue (Million) Forecast, by Application 2019 & 2032
- Table 86: Italy Bioanalytical Lab Services Industry Volume (K Unit) Forecast, by Application 2019 & 2032
- Table 87: Spain Bioanalytical Lab Services Industry Revenue (Million) Forecast, by Application 2019 & 2032
- Table 88: Spain Bioanalytical Lab Services Industry Volume (K Unit) Forecast, by Application 2019 & 2032
- Table 89: Rest of Europe Bioanalytical Lab Services Industry Revenue (Million) Forecast, by Application 2019 & 2032
- Table 90: Rest of Europe Bioanalytical Lab Services Industry Volume (K Unit) Forecast, by Application 2019 & 2032
- Table 91: Global Bioanalytical Lab Services Industry Revenue Million Forecast, by Molecule Type 2019 & 2032
- Table 92: Global Bioanalytical Lab Services Industry Volume K Unit Forecast, by Molecule Type 2019 & 2032
- Table 93: Global Bioanalytical Lab Services Industry Revenue Million Forecast, by Test Type 2019 & 2032
- Table 94: Global Bioanalytical Lab Services Industry Volume K Unit Forecast, by Test Type 2019 & 2032
- Table 95: Global Bioanalytical Lab Services Industry Revenue Million Forecast, by Country 2019 & 2032
- Table 96: Global Bioanalytical Lab Services Industry Volume K Unit Forecast, by Country 2019 & 2032
- Table 97: China Bioanalytical Lab Services Industry Revenue (Million) Forecast, by Application 2019 & 2032
- Table 98: China Bioanalytical Lab Services Industry Volume (K Unit) Forecast, by Application 2019 & 2032
- Table 99: Japan Bioanalytical Lab Services Industry Revenue (Million) Forecast, by Application 2019 & 2032
- Table 100: Japan Bioanalytical Lab Services Industry Volume (K Unit) Forecast, by Application 2019 & 2032
- Table 101: India Bioanalytical Lab Services Industry Revenue (Million) Forecast, by Application 2019 & 2032
- Table 102: India Bioanalytical Lab Services Industry Volume (K Unit) Forecast, by Application 2019 & 2032
- Table 103: Australia Bioanalytical Lab Services Industry Revenue (Million) Forecast, by Application 2019 & 2032
- Table 104: Australia Bioanalytical Lab Services Industry Volume (K Unit) Forecast, by Application 2019 & 2032
- Table 105: South Korea Bioanalytical Lab Services Industry Revenue (Million) Forecast, by Application 2019 & 2032
- Table 106: South Korea Bioanalytical Lab Services Industry Volume (K Unit) Forecast, by Application 2019 & 2032
- Table 107: Rest of Asia Pacific Bioanalytical Lab Services Industry Revenue (Million) Forecast, by Application 2019 & 2032
- Table 108: Rest of Asia Pacific Bioanalytical Lab Services Industry Volume (K Unit) Forecast, by Application 2019 & 2032
- Table 109: Global Bioanalytical Lab Services Industry Revenue Million Forecast, by Molecule Type 2019 & 2032
- Table 110: Global Bioanalytical Lab Services Industry Volume K Unit Forecast, by Molecule Type 2019 & 2032
- Table 111: Global Bioanalytical Lab Services Industry Revenue Million Forecast, by Test Type 2019 & 2032
- Table 112: Global Bioanalytical Lab Services Industry Volume K Unit Forecast, by Test Type 2019 & 2032
- Table 113: Global Bioanalytical Lab Services Industry Revenue Million Forecast, by Country 2019 & 2032
- Table 114: Global Bioanalytical Lab Services Industry Volume K Unit Forecast, by Country 2019 & 2032
- Table 115: GCC Bioanalytical Lab Services Industry Revenue (Million) Forecast, by Application 2019 & 2032
- Table 116: GCC Bioanalytical Lab Services Industry Volume (K Unit) Forecast, by Application 2019 & 2032
- Table 117: South Africa Bioanalytical Lab Services Industry Revenue (Million) Forecast, by Application 2019 & 2032
- Table 118: South Africa Bioanalytical Lab Services Industry Volume (K Unit) Forecast, by Application 2019 & 2032
- Table 119: Rest of Middle East and Africa Bioanalytical Lab Services Industry Revenue (Million) Forecast, by Application 2019 & 2032
- Table 120: Rest of Middle East and Africa Bioanalytical Lab Services Industry Volume (K Unit) Forecast, by Application 2019 & 2032
- Table 121: Global Bioanalytical Lab Services Industry Revenue Million Forecast, by Molecule Type 2019 & 2032
- Table 122: Global Bioanalytical Lab Services Industry Volume K Unit Forecast, by Molecule Type 2019 & 2032
- Table 123: Global Bioanalytical Lab Services Industry Revenue Million Forecast, by Test Type 2019 & 2032
- Table 124: Global Bioanalytical Lab Services Industry Volume K Unit Forecast, by Test Type 2019 & 2032
- Table 125: Global Bioanalytical Lab Services Industry Revenue Million Forecast, by Country 2019 & 2032
- Table 126: Global Bioanalytical Lab Services Industry Volume K Unit Forecast, by Country 2019 & 2032
- Table 127: Brazil Bioanalytical Lab Services Industry Revenue (Million) Forecast, by Application 2019 & 2032
- Table 128: Brazil Bioanalytical Lab Services Industry Volume (K Unit) Forecast, by Application 2019 & 2032
- Table 129: Argentina Bioanalytical Lab Services Industry Revenue (Million) Forecast, by Application 2019 & 2032
- Table 130: Argentina Bioanalytical Lab Services Industry Volume (K Unit) Forecast, by Application 2019 & 2032
- Table 131: Rest of South America Bioanalytical Lab Services Industry Revenue (Million) Forecast, by Application 2019 & 2032
- Table 132: Rest of South America Bioanalytical Lab Services Industry Volume (K Unit) Forecast, by Application 2019 & 2032
Frequently Asked Questions
1. What is the projected Compound Annual Growth Rate (CAGR) of the Bioanalytical Lab Services Industry?
The projected CAGR is approximately 9.19%.
2. Which companies are prominent players in the Bioanalytical Lab Services Industry?
Key companies in the market include Intertek Group PLC, Wuxi Apptec Co Ltd, Laboratory Corporation of America Holdings, Pharmaceutical Product Development LLC, Syneos Health, ICON PLC, Charles River Laboratories International Inc, SGS SA, Toxikon Corporation.
3. What are the main segments of the Bioanalytical Lab Services Industry?
The market segments include Molecule Type, Test Type.
4. Can you provide details about the market size?
The market size is estimated to be USD 3.93 Million as of 2022.
5. What are some drivers contributing to market growth?
Increased Necessity of Specific Types of Tests in R&D Activities; Increased Trend of Outsourcing Laboratory Testing Services.
6. What are the notable trends driving market growth?
Small Molecule Sub-segment Expected to Show Better Growth in the Bioanalytical Testing Services Market.
7. Are there any restraints impacting market growth?
Complex Regulatory Framework for Maintaining Laboratories; Challenges in the Development of Proper Analytical Techniques.
8. Can you provide examples of recent developments in the market?
N/A
9. What pricing options are available for accessing the report?
Pricing options include single-user, multi-user, and enterprise licenses priced at USD 4750, USD 5250, and USD 8750 respectively.
10. Is the market size provided in terms of value or volume?
The market size is provided in terms of value, measured in Million and volume, measured in K Unit.
11. Are there any specific market keywords associated with the report?
Yes, the market keyword associated with the report is "Bioanalytical Lab Services Industry," which aids in identifying and referencing the specific market segment covered.
12. How do I determine which pricing option suits my needs best?
The pricing options vary based on user requirements and access needs. Individual users may opt for single-user licenses, while businesses requiring broader access may choose multi-user or enterprise licenses for cost-effective access to the report.
13. Are there any additional resources or data provided in the Bioanalytical Lab Services Industry report?
While the report offers comprehensive insights, it's advisable to review the specific contents or supplementary materials provided to ascertain if additional resources or data are available.
14. How can I stay updated on further developments or reports in the Bioanalytical Lab Services Industry?
To stay informed about further developments, trends, and reports in the Bioanalytical Lab Services Industry, consider subscribing to industry newsletters, following relevant companies and organizations, or regularly checking reputable industry news sources and publications.
Methodology
Step 1 - Identification of Relevant Samples Size from Population Database


Step 2 - Approaches for Defining Global Market Size (Value, Volume* & Price*)

Note*: In applicable scenarios
Step 3 - Data Sources
Primary Research
- Web Analytics
- Survey Reports
- Research Institute
- Latest Research Reports
- Opinion Leaders
Secondary Research
- Annual Reports
- White Paper
- Latest Press Release
- Industry Association
- Paid Database
- Investor Presentations

Step 4 - Data Triangulation
Involves using different sources of information in order to increase the validity of a study
These sources are likely to be stakeholders in a program - participants, other researchers, program staff, other community members, and so on.
Then we put all data in single framework & apply various statistical tools to find out the dynamic on the market.
During the analysis stage, feedback from the stakeholder groups would be compared to determine areas of agreement as well as areas of divergence


