
Key Insights
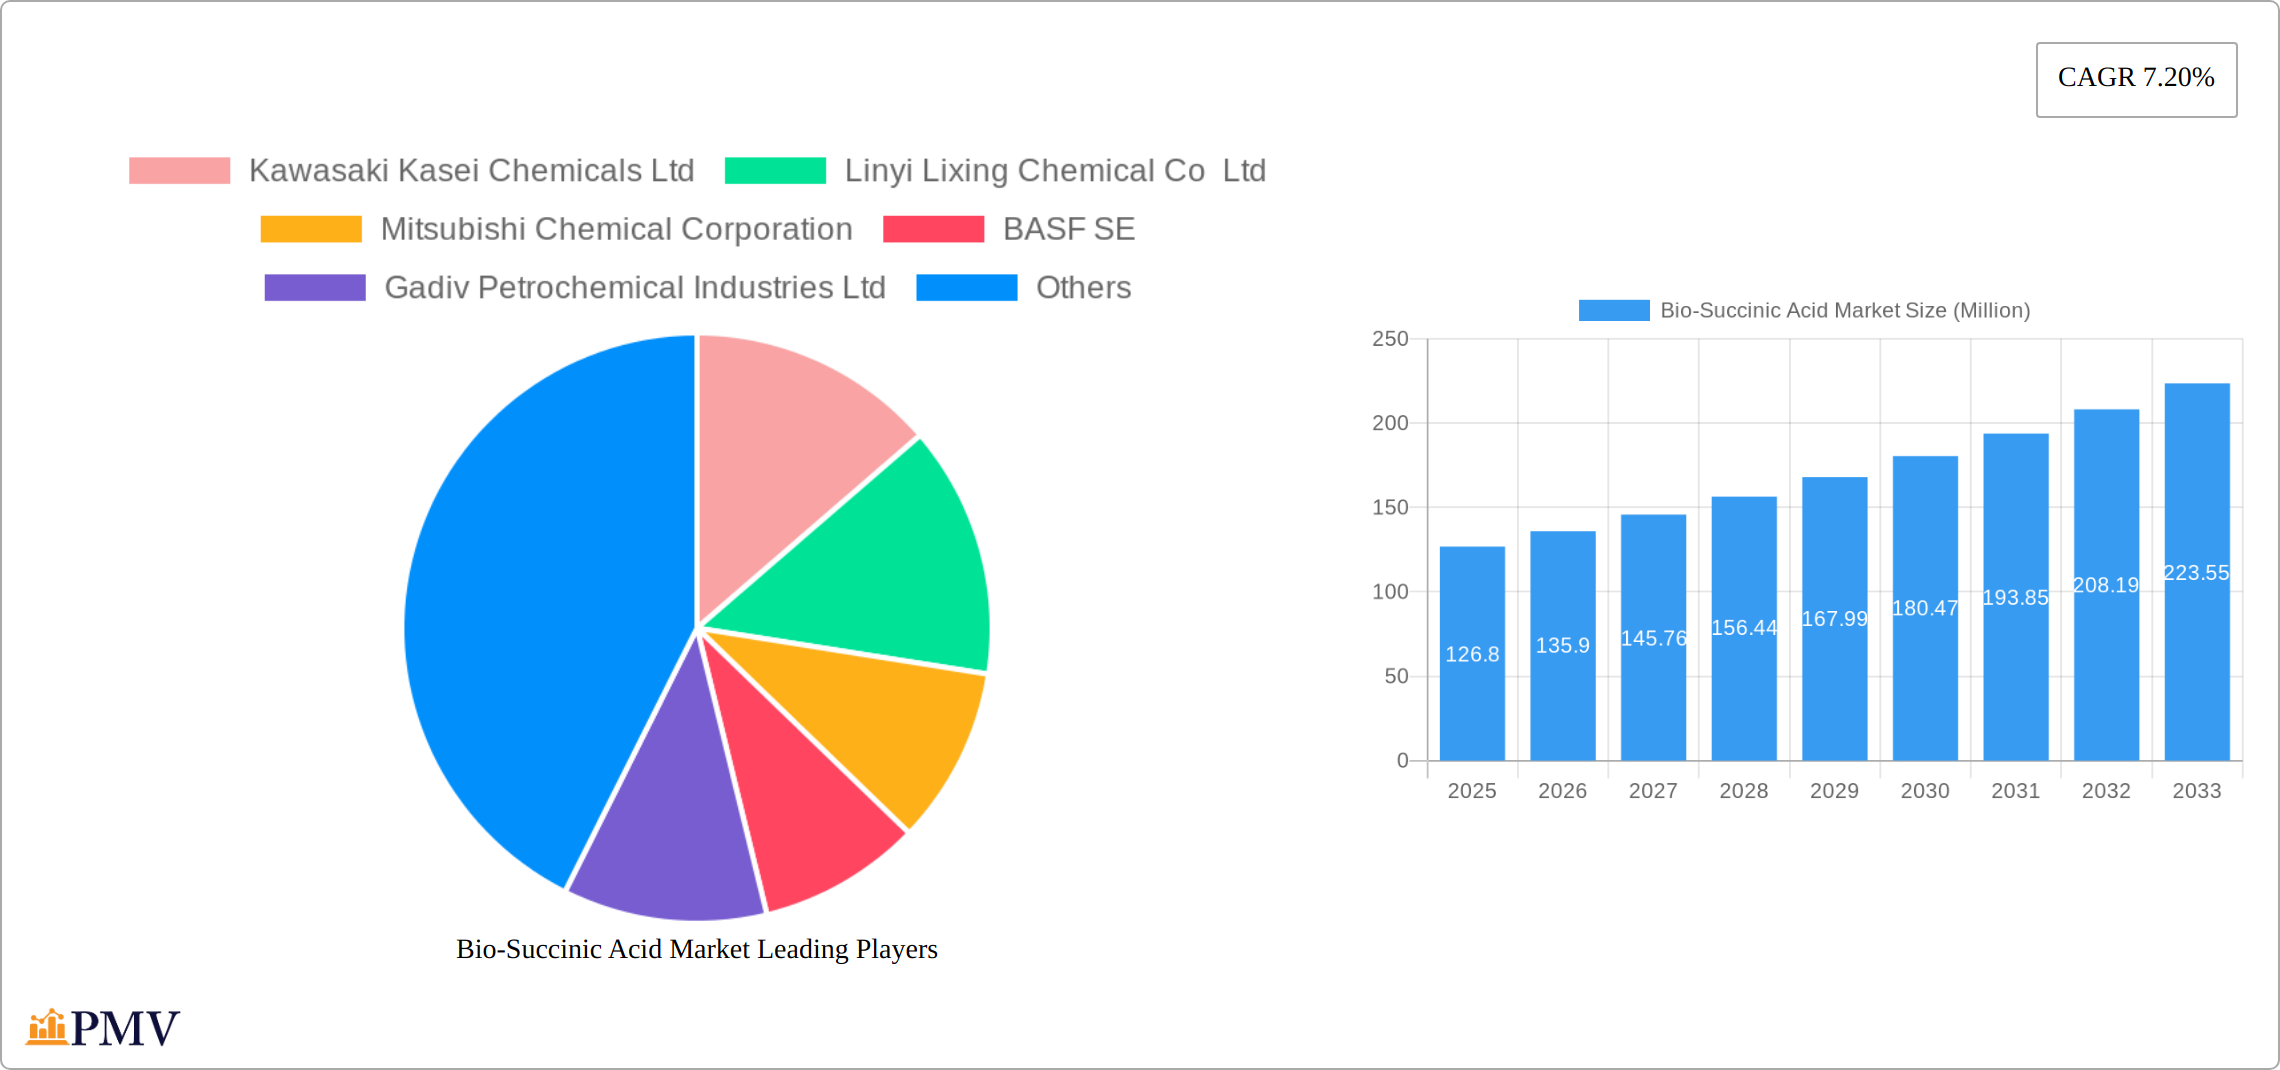
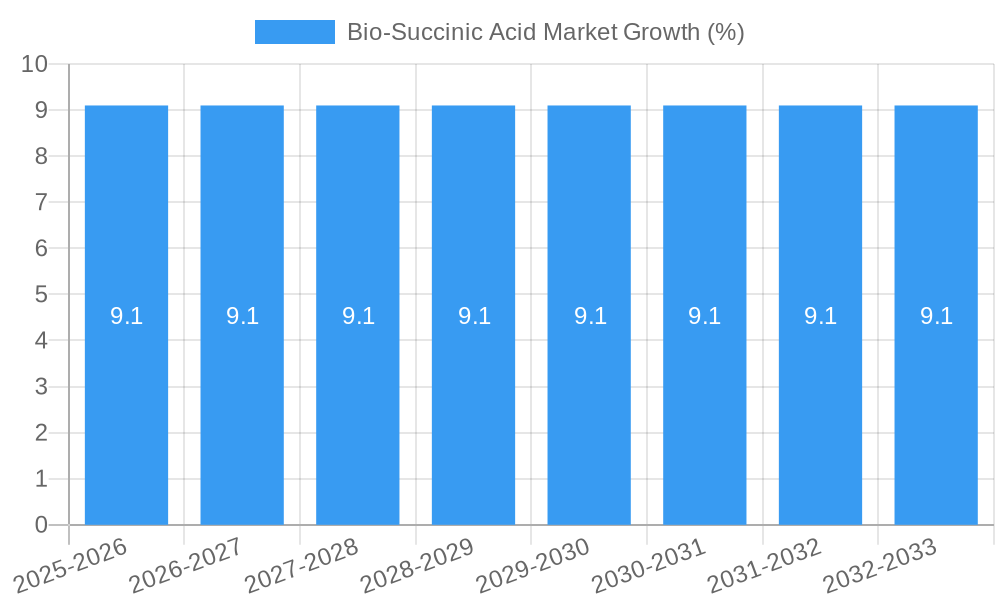
The bio-succinic acid market, valued at $126.80 million in 2025, is projected to experience robust growth, driven by the increasing demand for bio-based and sustainable chemicals across diverse sectors. A compound annual growth rate (CAGR) of 7.20% from 2025 to 2033 indicates a significant expansion of this market. Key drivers include the growing awareness of environmental sustainability, stringent regulations on petrochemical-based products, and the rising adoption of bio-succinic acid in food and beverage applications, particularly as a natural food additive and flavor enhancer. The pharmaceutical industry is also a key consumer, utilizing bio-succinic acid in drug formulations and as a building block for various pharmaceutical intermediates. Industrial applications, such as in polymers and resins, are showing increasing promise and contribute to the overall market growth. The bio-based segment is expected to dominate the market due to its environmentally friendly nature and increasing consumer preference for sustainable products. While challenges exist, such as the relatively higher cost of bio-succinic acid compared to its petrochemical counterpart, ongoing research and development efforts focused on improving production efficiency and reducing costs are mitigating these limitations.
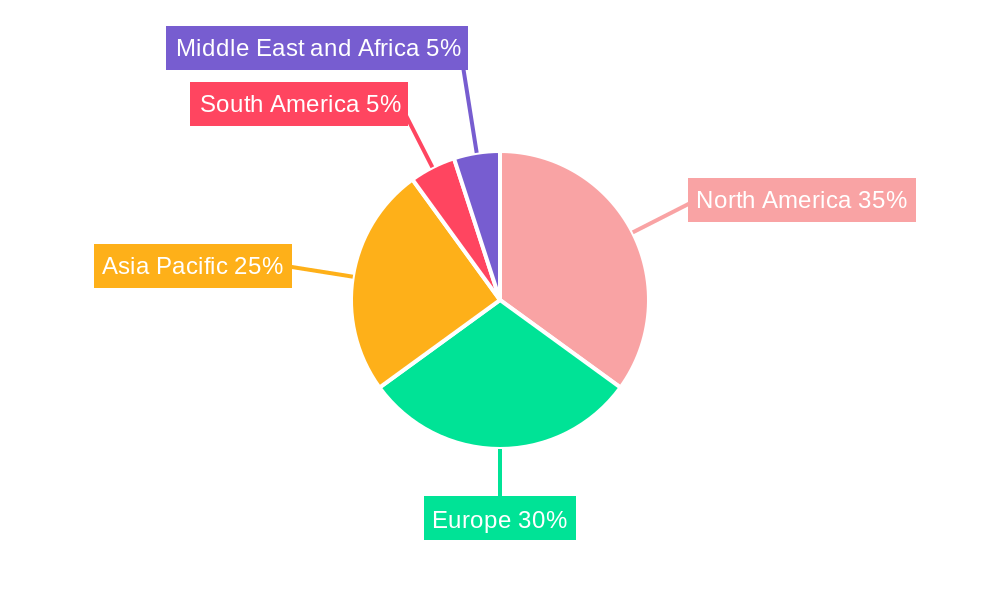
The market segmentation reveals a dynamic landscape. Food and beverage applications currently hold a significant market share, but the pharmaceutical and industrial segments are poised for substantial growth in the coming years. Geographically, North America and Europe are currently leading the market, although the Asia-Pacific region is anticipated to witness accelerated growth driven by increasing industrialization and rising consumer demand. Major players like BASF SE, Mitsubishi Chemical Corporation, and Corbion N.V. are actively involved in research, development, and market expansion, further intensifying competition and innovation within the sector. The forecast period suggests continued market expansion, with significant opportunities for new entrants and established players alike to capitalize on the growing demand for sustainable and high-performance bio-based chemicals.
Bio-Succinic Acid Market: A Comprehensive Report (2019-2033)
This detailed report provides a comprehensive analysis of the Bio-Succinic Acid market, offering invaluable insights for stakeholders across the value chain. The study period spans from 2019 to 2033, with 2025 serving as both the base and estimated year. The forecast period extends from 2025 to 2033, while the historical period covers 2019-2024. The report analyzes market trends, competitive dynamics, and growth opportunities, presenting actionable intelligence for informed decision-making. The market is segmented by type (bio-based, petro-based) and application (food and beverage, pharmaceutical, industrial, other applications). Key players like Kawasaki Kasei Chemicals Ltd, Linyi Lixing Chemical Co Ltd, Mitsubishi Chemical Corporation, BASF SE, Gadiv Petrochemical Industries Ltd, Corbion N V, Nippon Shokubai, Anhui Sunsing Chemicals, Succinity Gmbh, Reverdia, and Myriant are profiled, offering a clear view of the competitive landscape. The report projects a market value reaching xx Million by 2033, showcasing significant growth potential.
Bio-Succinic Acid Market Market Structure & Competitive Dynamics
The bio-succinic acid market presents a dynamic competitive landscape shaped by market concentration, innovation, regulatory forces, substitute products, end-user trends, and mergers and acquisitions (M&A) activity. While several major players dominate a significant portion of the market share, resulting in a moderately concentrated structure, the presence of numerous smaller companies fosters a highly competitive environment. Innovation is a key driver, fueled by advancements in bio-based production technologies and the continuous development of new applications across diverse sectors. Regulatory frameworks, particularly those emphasizing sustainability and environmental impact, exert a growing influence on market dynamics, incentivizing eco-friendly production methods and rewarding companies committed to minimizing their environmental footprint. The market is characterized by consistent M&A activity, with recent transactions primarily focused on expanding production capacities and acquiring cutting-edge technologies. A notable example is LCY Biosciences' acquisition of BioAmber's bio-based succinic acid plant in 2021, underscoring the strategic value of securing established production capabilities. The total value of M&A deals within the sector from 2019 to 2024 is estimated at [Insert Exact Figure] Million. This consolidation trend suggests a future market landscape potentially dominated by fewer, larger players with greater technological and production capabilities.
- Market Concentration: Moderately concentrated, with a Herfindahl-Hirschman Index (HHI) of [Insert Exact Figure].
- Innovation Ecosystems: Strong emphasis on bio-based production, process optimization, and novel applications across diverse sectors such as food and packaging.
- Regulatory Frameworks: Increasingly stringent sustainability and environmental standards are driving innovation and influencing market access.
- Product Substitutes: While limited direct substitutes exist, competition arises from other bio-based chemicals and traditional petrochemical alternatives.
- End-User Trends: Significant growth in demand from food & beverage, pharmaceuticals, and emerging sectors like bioplastics and biodegradable materials.
- M&A Activities: Significant activity characterized by capacity expansion, technology acquisition, and strategic partnerships, with deal values totaling [Insert Exact Figure] Million (2019-2024).
Bio-Succinic Acid Market Industry Trends & Insights
The bio-succinic acid market is experiencing robust growth, driven by several key factors. The increasing demand for sustainable and biodegradable materials in various industries is a major driver. Technological advancements in bio-based production are reducing costs and improving efficiency, making bio-succinic acid a more competitive alternative to petro-based counterparts. Consumer preferences are shifting towards environmentally friendly products, boosting the adoption of bio-succinic acid in applications like food packaging and pharmaceuticals. The market is expected to witness a CAGR of xx% during the forecast period (2025-2033), with market penetration rates steadily increasing across key applications. Competitive dynamics are characterized by ongoing innovation, capacity expansion, and strategic partnerships among leading players.
Dominant Markets & Segments in Bio-Succinic Acid Market
The Bio-Succinic Acid market demonstrates regional variations in dominance, with [Region Name] emerging as the leading region due to [Specific reason, e.g., strong government support for renewable resources, established manufacturing base]. Within this region, [Country Name] holds a significant market share, driven by favorable economic policies and robust infrastructure supporting bio-based chemical production.
By Type: The bio-based segment dominates the market due to increasing environmental concerns and growing demand for sustainable alternatives.
By Application: The food and beverage industry represents the largest application segment, followed by the pharmaceutical sector. This is driven by the use of bio-succinic acid as a food additive and in the manufacturing of various pharmaceutical products.
Key Drivers for [Region Name]:
- Favorable government policies promoting bio-based industries.
- Well-developed infrastructure for chemical production and logistics.
- Abundant availability of biomass feedstock.
Key Drivers for [Country Name]:
- Strong government support for green technologies.
- Growing consumer demand for sustainable products.
- Presence of major market players.
Bio-Succinic Acid Market Product Innovations
Recent innovations in bio-succinic acid production focus on enhancing efficiency, reducing costs, and expanding applications. Advancements in fermentation technology, along with the development of high-yield microbial strains, are leading to improved production processes. New applications are emerging in areas such as biodegradable plastics, coatings, and specialty chemicals. These advancements are enabling bio-succinic acid to compete effectively with petro-based alternatives and capture significant market share across diverse industry segments. The focus is on creating bio-succinic acid products that offer superior performance while aligning with sustainability goals.
Report Segmentation & Scope
This report offers a comprehensive segmentation of the bio-succinic acid market based on type and application.
By Type: The market is divided into bio-based and petro-based succinic acid. The bio-based segment is expected to witness faster growth due to rising environmental concerns and government regulations favoring sustainable solutions. The market size of bio-based succinic acid is projected to reach xx Million by 2033. The petro-based segment will remain significant due to its cost-competitiveness in some applications, however its growth will be significantly slower.
By Application: The market is segmented into food and beverage, pharmaceutical, industrial, and other applications. The food and beverage segment holds the largest market share, driven by its use as a food additive and flavor enhancer. The pharmaceutical segment is also experiencing significant growth, owing to the increasing use of bio-succinic acid in the manufacturing of various pharmaceutical products. The industrial segment is characterized by diverse applications in the production of polymers, resins and coatings.
Key Drivers of Bio-Succinic Acid Market Growth
Several factors are driving the growth of the bio-succinic acid market. Firstly, the increasing demand for sustainable and biodegradable materials across various industries is a key driver. Secondly, technological advancements in bio-based production methods are leading to improved efficiency and reduced costs. Thirdly, favorable government policies and regulations promoting sustainable chemicals are creating a supportive environment for market expansion. Finally, growing consumer awareness of environmental issues is fueling the demand for bio-based products.
Challenges in the Bio-Succinic Acid Market Sector
Despite the growth potential, the bio-succinic acid market faces several challenges. High production costs compared to petro-based alternatives remain a major barrier. Fluctuations in raw material prices and supply chain disruptions can also impact profitability. Competition from existing chemical substitutes and the need for further technological advancements to achieve cost parity with petrochemicals remain key challenges. The development of efficient and scalable production technologies is crucial for wider market adoption.
Leading Players in the Bio-Succinic Acid Market Market
- Kawasaki Kasei Chemicals Ltd
- Linyi Lixing Chemical Co Ltd
- Mitsubishi Chemical Corporation
- BASF SE
- Gadiv Petrochemical Industries Ltd
- Corbion N V
- Nippon Shokubai
- Anhui Sunsing Chemicals
- Succinity Gmbh
- Reverdia
- Myriant
Key Developments in Bio-Succinic Acid Market Sector
- August 2022: Technip Energies acquired Biosuccinium technology from DSM, expanding its bio-based succinic acid production capabilities.
- September 2021: Kemira invested in expanding its alkenyl succinic anhydride (ASA) production capacity in China.
- August 2021: LCY Biosciences acquired BioAmber's bio-based succinic acid plant in Sarnia, Canada, increasing its production capacity.
Strategic Bio-Succinic Acid Market Market Outlook
The bio-succinic acid market holds significant promise for future growth. Continued technological advancements, coupled with supportive government policies and increasing consumer demand for sustainable products, will drive market expansion. Strategic partnerships and collaborations among industry players will play a crucial role in accelerating innovation and market penetration. The focus on developing cost-effective and scalable bio-based production technologies will be paramount in realizing the full potential of this market. Opportunities exist in exploring new applications and expanding into emerging markets.
Bio-Succinic Acid Market Segmentation
-
1. Type
- 1.1. Bio-based
- 1.2. Petro-based
-
2. Application
- 2.1. Food and Beverage
- 2.2. Pharmaceutical
- 2.3. Industrial
- 2.4. Other Applications
Bio-Succinic Acid Market Segmentation By Geography
-
1. North America
- 1.1. United States
- 1.2. Canada
- 1.3. Mexico
- 1.4. Rest of North America
-
2. Europe
- 2.1. United Kingdom
- 2.2. Germany
- 2.3. France
- 2.4. Russia
- 2.5. Italy
- 2.6. Spain
- 2.7. Rest of Europe
-
3. Asia Pacific
- 3.1. India
- 3.2. China
- 3.3. Japan
- 3.4. Australia
- 3.5. Rest of Asia Pacific
-
4. South America
- 4.1. Brazil
- 4.2. Argentina
- 4.3. Rest of South America
-
5. Middle East and Africa
- 5.1. South Africa
- 5.2. Saudi Arabia
- 5.3. Rest of Middle East and Africa
Bio-Succinic Acid Market REPORT HIGHLIGHTS
| Aspects | Details |
|---|---|
| Study Period | 2019-2033 |
| Base Year | 2024 |
| Estimated Year | 2025 |
| Forecast Period | 2025-2033 |
| Historical Period | 2019-2024 |
| Growth Rate | CAGR of 7.20% from 2019-2033 |
| Segmentation |
|
Table of Contents
- 1. Introduction
- 1.1. Research Scope
- 1.2. Market Segmentation
- 1.3. Research Methodology
- 1.4. Definitions and Assumptions
- 2. Executive Summary
- 2.1. Introduction
- 3. Market Dynamics
- 3.1. Introduction
- 3.2. Market Drivers
- 3.2.1. Increasing Demand for Functional and Fortified Food; Multi-functionality and Wide Application of Riboflavin
- 3.3. Market Restrains
- 3.3.1. Low Stability of Riboflavin on Exposure to Light and Heat
- 3.4. Market Trends
- 3.4.1. Increase in Demand for a Bioplastics Using Succinic Acid
- 4. Market Factor Analysis
- 4.1. Porters Five Forces
- 4.2. Supply/Value Chain
- 4.3. PESTEL analysis
- 4.4. Market Entropy
- 4.5. Patent/Trademark Analysis
- 5. Global Bio-Succinic Acid Market Analysis, Insights and Forecast, 2019-2031
- 5.1. Market Analysis, Insights and Forecast - by Type
- 5.1.1. Bio-based
- 5.1.2. Petro-based
- 5.2. Market Analysis, Insights and Forecast - by Application
- 5.2.1. Food and Beverage
- 5.2.2. Pharmaceutical
- 5.2.3. Industrial
- 5.2.4. Other Applications
- 5.3. Market Analysis, Insights and Forecast - by Region
- 5.3.1. North America
- 5.3.2. Europe
- 5.3.3. Asia Pacific
- 5.3.4. South America
- 5.3.5. Middle East and Africa
- 5.1. Market Analysis, Insights and Forecast - by Type
- 6. North America Bio-Succinic Acid Market Analysis, Insights and Forecast, 2019-2031
- 6.1. Market Analysis, Insights and Forecast - by Type
- 6.1.1. Bio-based
- 6.1.2. Petro-based
- 6.2. Market Analysis, Insights and Forecast - by Application
- 6.2.1. Food and Beverage
- 6.2.2. Pharmaceutical
- 6.2.3. Industrial
- 6.2.4. Other Applications
- 6.1. Market Analysis, Insights and Forecast - by Type
- 7. Europe Bio-Succinic Acid Market Analysis, Insights and Forecast, 2019-2031
- 7.1. Market Analysis, Insights and Forecast - by Type
- 7.1.1. Bio-based
- 7.1.2. Petro-based
- 7.2. Market Analysis, Insights and Forecast - by Application
- 7.2.1. Food and Beverage
- 7.2.2. Pharmaceutical
- 7.2.3. Industrial
- 7.2.4. Other Applications
- 7.1. Market Analysis, Insights and Forecast - by Type
- 8. Asia Pacific Bio-Succinic Acid Market Analysis, Insights and Forecast, 2019-2031
- 8.1. Market Analysis, Insights and Forecast - by Type
- 8.1.1. Bio-based
- 8.1.2. Petro-based
- 8.2. Market Analysis, Insights and Forecast - by Application
- 8.2.1. Food and Beverage
- 8.2.2. Pharmaceutical
- 8.2.3. Industrial
- 8.2.4. Other Applications
- 8.1. Market Analysis, Insights and Forecast - by Type
- 9. South America Bio-Succinic Acid Market Analysis, Insights and Forecast, 2019-2031
- 9.1. Market Analysis, Insights and Forecast - by Type
- 9.1.1. Bio-based
- 9.1.2. Petro-based
- 9.2. Market Analysis, Insights and Forecast - by Application
- 9.2.1. Food and Beverage
- 9.2.2. Pharmaceutical
- 9.2.3. Industrial
- 9.2.4. Other Applications
- 9.1. Market Analysis, Insights and Forecast - by Type
- 10. Middle East and Africa Bio-Succinic Acid Market Analysis, Insights and Forecast, 2019-2031
- 10.1. Market Analysis, Insights and Forecast - by Type
- 10.1.1. Bio-based
- 10.1.2. Petro-based
- 10.2. Market Analysis, Insights and Forecast - by Application
- 10.2.1. Food and Beverage
- 10.2.2. Pharmaceutical
- 10.2.3. Industrial
- 10.2.4. Other Applications
- 10.1. Market Analysis, Insights and Forecast - by Type
- 11. North America Bio-Succinic Acid Market Analysis, Insights and Forecast, 2019-2031
- 11.1. Market Analysis, Insights and Forecast - By Country/Sub-region
- 11.1.1 United States
- 11.1.2 Canada
- 11.1.3 Mexico
- 11.1.4 Rest of North America
- 12. Europe Bio-Succinic Acid Market Analysis, Insights and Forecast, 2019-2031
- 12.1. Market Analysis, Insights and Forecast - By Country/Sub-region
- 12.1.1 United Kingdom
- 12.1.2 Germany
- 12.1.3 France
- 12.1.4 Russia
- 12.1.5 Italy
- 12.1.6 Spain
- 12.1.7 Rest of Europe
- 13. Asia Pacific Bio-Succinic Acid Market Analysis, Insights and Forecast, 2019-2031
- 13.1. Market Analysis, Insights and Forecast - By Country/Sub-region
- 13.1.1 India
- 13.1.2 China
- 13.1.3 Japan
- 13.1.4 Australia
- 13.1.5 Rest of Asia Pacific
- 14. South America Bio-Succinic Acid Market Analysis, Insights and Forecast, 2019-2031
- 14.1. Market Analysis, Insights and Forecast - By Country/Sub-region
- 14.1.1 Brazil
- 14.1.2 Argentina
- 14.1.3 Rest of South America
- 15. Middle East and Africa Bio-Succinic Acid Market Analysis, Insights and Forecast, 2019-2031
- 15.1. Market Analysis, Insights and Forecast - By Country/Sub-region
- 15.1.1 South Africa
- 15.1.2 Saudi Arabia
- 15.1.3 Rest of Middle East and Africa
- 16. Competitive Analysis
- 16.1. Global Market Share Analysis 2024
- 16.2. Company Profiles
- 16.2.1 Kawasaki Kasei Chemicals Ltd
- 16.2.1.1. Overview
- 16.2.1.2. Products
- 16.2.1.3. SWOT Analysis
- 16.2.1.4. Recent Developments
- 16.2.1.5. Financials (Based on Availability)
- 16.2.2 Linyi Lixing Chemical Co Ltd
- 16.2.2.1. Overview
- 16.2.2.2. Products
- 16.2.2.3. SWOT Analysis
- 16.2.2.4. Recent Developments
- 16.2.2.5. Financials (Based on Availability)
- 16.2.3 Mitsubishi Chemical Corporation
- 16.2.3.1. Overview
- 16.2.3.2. Products
- 16.2.3.3. SWOT Analysis
- 16.2.3.4. Recent Developments
- 16.2.3.5. Financials (Based on Availability)
- 16.2.4 BASF SE
- 16.2.4.1. Overview
- 16.2.4.2. Products
- 16.2.4.3. SWOT Analysis
- 16.2.4.4. Recent Developments
- 16.2.4.5. Financials (Based on Availability)
- 16.2.5 Gadiv Petrochemical Industries Ltd
- 16.2.5.1. Overview
- 16.2.5.2. Products
- 16.2.5.3. SWOT Analysis
- 16.2.5.4. Recent Developments
- 16.2.5.5. Financials (Based on Availability)
- 16.2.6 Corbion N V *List Not Exhaustive
- 16.2.6.1. Overview
- 16.2.6.2. Products
- 16.2.6.3. SWOT Analysis
- 16.2.6.4. Recent Developments
- 16.2.6.5. Financials (Based on Availability)
- 16.2.7 Nippon Shokubai
- 16.2.7.1. Overview
- 16.2.7.2. Products
- 16.2.7.3. SWOT Analysis
- 16.2.7.4. Recent Developments
- 16.2.7.5. Financials (Based on Availability)
- 16.2.8 Anhui Sunsing Chemicals
- 16.2.8.1. Overview
- 16.2.8.2. Products
- 16.2.8.3. SWOT Analysis
- 16.2.8.4. Recent Developments
- 16.2.8.5. Financials (Based on Availability)
- 16.2.9 Succinity Gmbh
- 16.2.9.1. Overview
- 16.2.9.2. Products
- 16.2.9.3. SWOT Analysis
- 16.2.9.4. Recent Developments
- 16.2.9.5. Financials (Based on Availability)
- 16.2.10 Reverdia
- 16.2.10.1. Overview
- 16.2.10.2. Products
- 16.2.10.3. SWOT Analysis
- 16.2.10.4. Recent Developments
- 16.2.10.5. Financials (Based on Availability)
- 16.2.11 Myriant
- 16.2.11.1. Overview
- 16.2.11.2. Products
- 16.2.11.3. SWOT Analysis
- 16.2.11.4. Recent Developments
- 16.2.11.5. Financials (Based on Availability)
- 16.2.1 Kawasaki Kasei Chemicals Ltd
List of Figures
- Figure 1: Global Bio-Succinic Acid Market Revenue Breakdown (Million, %) by Region 2024 & 2032
- Figure 2: Global Bio-Succinic Acid Market Volume Breakdown (Liters, %) by Region 2024 & 2032
- Figure 3: North America Bio-Succinic Acid Market Revenue (Million), by Country 2024 & 2032
- Figure 4: North America Bio-Succinic Acid Market Volume (Liters), by Country 2024 & 2032
- Figure 5: North America Bio-Succinic Acid Market Revenue Share (%), by Country 2024 & 2032
- Figure 6: North America Bio-Succinic Acid Market Volume Share (%), by Country 2024 & 2032
- Figure 7: Europe Bio-Succinic Acid Market Revenue (Million), by Country 2024 & 2032
- Figure 8: Europe Bio-Succinic Acid Market Volume (Liters), by Country 2024 & 2032
- Figure 9: Europe Bio-Succinic Acid Market Revenue Share (%), by Country 2024 & 2032
- Figure 10: Europe Bio-Succinic Acid Market Volume Share (%), by Country 2024 & 2032
- Figure 11: Asia Pacific Bio-Succinic Acid Market Revenue (Million), by Country 2024 & 2032
- Figure 12: Asia Pacific Bio-Succinic Acid Market Volume (Liters), by Country 2024 & 2032
- Figure 13: Asia Pacific Bio-Succinic Acid Market Revenue Share (%), by Country 2024 & 2032
- Figure 14: Asia Pacific Bio-Succinic Acid Market Volume Share (%), by Country 2024 & 2032
- Figure 15: South America Bio-Succinic Acid Market Revenue (Million), by Country 2024 & 2032
- Figure 16: South America Bio-Succinic Acid Market Volume (Liters), by Country 2024 & 2032
- Figure 17: South America Bio-Succinic Acid Market Revenue Share (%), by Country 2024 & 2032
- Figure 18: South America Bio-Succinic Acid Market Volume Share (%), by Country 2024 & 2032
- Figure 19: Middle East and Africa Bio-Succinic Acid Market Revenue (Million), by Country 2024 & 2032
- Figure 20: Middle East and Africa Bio-Succinic Acid Market Volume (Liters), by Country 2024 & 2032
- Figure 21: Middle East and Africa Bio-Succinic Acid Market Revenue Share (%), by Country 2024 & 2032
- Figure 22: Middle East and Africa Bio-Succinic Acid Market Volume Share (%), by Country 2024 & 2032
- Figure 23: North America Bio-Succinic Acid Market Revenue (Million), by Type 2024 & 2032
- Figure 24: North America Bio-Succinic Acid Market Volume (Liters), by Type 2024 & 2032
- Figure 25: North America Bio-Succinic Acid Market Revenue Share (%), by Type 2024 & 2032
- Figure 26: North America Bio-Succinic Acid Market Volume Share (%), by Type 2024 & 2032
- Figure 27: North America Bio-Succinic Acid Market Revenue (Million), by Application 2024 & 2032
- Figure 28: North America Bio-Succinic Acid Market Volume (Liters), by Application 2024 & 2032
- Figure 29: North America Bio-Succinic Acid Market Revenue Share (%), by Application 2024 & 2032
- Figure 30: North America Bio-Succinic Acid Market Volume Share (%), by Application 2024 & 2032
- Figure 31: North America Bio-Succinic Acid Market Revenue (Million), by Country 2024 & 2032
- Figure 32: North America Bio-Succinic Acid Market Volume (Liters), by Country 2024 & 2032
- Figure 33: North America Bio-Succinic Acid Market Revenue Share (%), by Country 2024 & 2032
- Figure 34: North America Bio-Succinic Acid Market Volume Share (%), by Country 2024 & 2032
- Figure 35: Europe Bio-Succinic Acid Market Revenue (Million), by Type 2024 & 2032
- Figure 36: Europe Bio-Succinic Acid Market Volume (Liters), by Type 2024 & 2032
- Figure 37: Europe Bio-Succinic Acid Market Revenue Share (%), by Type 2024 & 2032
- Figure 38: Europe Bio-Succinic Acid Market Volume Share (%), by Type 2024 & 2032
- Figure 39: Europe Bio-Succinic Acid Market Revenue (Million), by Application 2024 & 2032
- Figure 40: Europe Bio-Succinic Acid Market Volume (Liters), by Application 2024 & 2032
- Figure 41: Europe Bio-Succinic Acid Market Revenue Share (%), by Application 2024 & 2032
- Figure 42: Europe Bio-Succinic Acid Market Volume Share (%), by Application 2024 & 2032
- Figure 43: Europe Bio-Succinic Acid Market Revenue (Million), by Country 2024 & 2032
- Figure 44: Europe Bio-Succinic Acid Market Volume (Liters), by Country 2024 & 2032
- Figure 45: Europe Bio-Succinic Acid Market Revenue Share (%), by Country 2024 & 2032
- Figure 46: Europe Bio-Succinic Acid Market Volume Share (%), by Country 2024 & 2032
- Figure 47: Asia Pacific Bio-Succinic Acid Market Revenue (Million), by Type 2024 & 2032
- Figure 48: Asia Pacific Bio-Succinic Acid Market Volume (Liters), by Type 2024 & 2032
- Figure 49: Asia Pacific Bio-Succinic Acid Market Revenue Share (%), by Type 2024 & 2032
- Figure 50: Asia Pacific Bio-Succinic Acid Market Volume Share (%), by Type 2024 & 2032
- Figure 51: Asia Pacific Bio-Succinic Acid Market Revenue (Million), by Application 2024 & 2032
- Figure 52: Asia Pacific Bio-Succinic Acid Market Volume (Liters), by Application 2024 & 2032
- Figure 53: Asia Pacific Bio-Succinic Acid Market Revenue Share (%), by Application 2024 & 2032
- Figure 54: Asia Pacific Bio-Succinic Acid Market Volume Share (%), by Application 2024 & 2032
- Figure 55: Asia Pacific Bio-Succinic Acid Market Revenue (Million), by Country 2024 & 2032
- Figure 56: Asia Pacific Bio-Succinic Acid Market Volume (Liters), by Country 2024 & 2032
- Figure 57: Asia Pacific Bio-Succinic Acid Market Revenue Share (%), by Country 2024 & 2032
- Figure 58: Asia Pacific Bio-Succinic Acid Market Volume Share (%), by Country 2024 & 2032
- Figure 59: South America Bio-Succinic Acid Market Revenue (Million), by Type 2024 & 2032
- Figure 60: South America Bio-Succinic Acid Market Volume (Liters), by Type 2024 & 2032
- Figure 61: South America Bio-Succinic Acid Market Revenue Share (%), by Type 2024 & 2032
- Figure 62: South America Bio-Succinic Acid Market Volume Share (%), by Type 2024 & 2032
- Figure 63: South America Bio-Succinic Acid Market Revenue (Million), by Application 2024 & 2032
- Figure 64: South America Bio-Succinic Acid Market Volume (Liters), by Application 2024 & 2032
- Figure 65: South America Bio-Succinic Acid Market Revenue Share (%), by Application 2024 & 2032
- Figure 66: South America Bio-Succinic Acid Market Volume Share (%), by Application 2024 & 2032
- Figure 67: South America Bio-Succinic Acid Market Revenue (Million), by Country 2024 & 2032
- Figure 68: South America Bio-Succinic Acid Market Volume (Liters), by Country 2024 & 2032
- Figure 69: South America Bio-Succinic Acid Market Revenue Share (%), by Country 2024 & 2032
- Figure 70: South America Bio-Succinic Acid Market Volume Share (%), by Country 2024 & 2032
- Figure 71: Middle East and Africa Bio-Succinic Acid Market Revenue (Million), by Type 2024 & 2032
- Figure 72: Middle East and Africa Bio-Succinic Acid Market Volume (Liters), by Type 2024 & 2032
- Figure 73: Middle East and Africa Bio-Succinic Acid Market Revenue Share (%), by Type 2024 & 2032
- Figure 74: Middle East and Africa Bio-Succinic Acid Market Volume Share (%), by Type 2024 & 2032
- Figure 75: Middle East and Africa Bio-Succinic Acid Market Revenue (Million), by Application 2024 & 2032
- Figure 76: Middle East and Africa Bio-Succinic Acid Market Volume (Liters), by Application 2024 & 2032
- Figure 77: Middle East and Africa Bio-Succinic Acid Market Revenue Share (%), by Application 2024 & 2032
- Figure 78: Middle East and Africa Bio-Succinic Acid Market Volume Share (%), by Application 2024 & 2032
- Figure 79: Middle East and Africa Bio-Succinic Acid Market Revenue (Million), by Country 2024 & 2032
- Figure 80: Middle East and Africa Bio-Succinic Acid Market Volume (Liters), by Country 2024 & 2032
- Figure 81: Middle East and Africa Bio-Succinic Acid Market Revenue Share (%), by Country 2024 & 2032
- Figure 82: Middle East and Africa Bio-Succinic Acid Market Volume Share (%), by Country 2024 & 2032
List of Tables
- Table 1: Global Bio-Succinic Acid Market Revenue Million Forecast, by Region 2019 & 2032
- Table 2: Global Bio-Succinic Acid Market Volume Liters Forecast, by Region 2019 & 2032
- Table 3: Global Bio-Succinic Acid Market Revenue Million Forecast, by Type 2019 & 2032
- Table 4: Global Bio-Succinic Acid Market Volume Liters Forecast, by Type 2019 & 2032
- Table 5: Global Bio-Succinic Acid Market Revenue Million Forecast, by Application 2019 & 2032
- Table 6: Global Bio-Succinic Acid Market Volume Liters Forecast, by Application 2019 & 2032
- Table 7: Global Bio-Succinic Acid Market Revenue Million Forecast, by Region 2019 & 2032
- Table 8: Global Bio-Succinic Acid Market Volume Liters Forecast, by Region 2019 & 2032
- Table 9: Global Bio-Succinic Acid Market Revenue Million Forecast, by Country 2019 & 2032
- Table 10: Global Bio-Succinic Acid Market Volume Liters Forecast, by Country 2019 & 2032
- Table 11: United States Bio-Succinic Acid Market Revenue (Million) Forecast, by Application 2019 & 2032
- Table 12: United States Bio-Succinic Acid Market Volume (Liters) Forecast, by Application 2019 & 2032
- Table 13: Canada Bio-Succinic Acid Market Revenue (Million) Forecast, by Application 2019 & 2032
- Table 14: Canada Bio-Succinic Acid Market Volume (Liters) Forecast, by Application 2019 & 2032
- Table 15: Mexico Bio-Succinic Acid Market Revenue (Million) Forecast, by Application 2019 & 2032
- Table 16: Mexico Bio-Succinic Acid Market Volume (Liters) Forecast, by Application 2019 & 2032
- Table 17: Rest of North America Bio-Succinic Acid Market Revenue (Million) Forecast, by Application 2019 & 2032
- Table 18: Rest of North America Bio-Succinic Acid Market Volume (Liters) Forecast, by Application 2019 & 2032
- Table 19: Global Bio-Succinic Acid Market Revenue Million Forecast, by Country 2019 & 2032
- Table 20: Global Bio-Succinic Acid Market Volume Liters Forecast, by Country 2019 & 2032
- Table 21: United Kingdom Bio-Succinic Acid Market Revenue (Million) Forecast, by Application 2019 & 2032
- Table 22: United Kingdom Bio-Succinic Acid Market Volume (Liters) Forecast, by Application 2019 & 2032
- Table 23: Germany Bio-Succinic Acid Market Revenue (Million) Forecast, by Application 2019 & 2032
- Table 24: Germany Bio-Succinic Acid Market Volume (Liters) Forecast, by Application 2019 & 2032
- Table 25: France Bio-Succinic Acid Market Revenue (Million) Forecast, by Application 2019 & 2032
- Table 26: France Bio-Succinic Acid Market Volume (Liters) Forecast, by Application 2019 & 2032
- Table 27: Russia Bio-Succinic Acid Market Revenue (Million) Forecast, by Application 2019 & 2032
- Table 28: Russia Bio-Succinic Acid Market Volume (Liters) Forecast, by Application 2019 & 2032
- Table 29: Italy Bio-Succinic Acid Market Revenue (Million) Forecast, by Application 2019 & 2032
- Table 30: Italy Bio-Succinic Acid Market Volume (Liters) Forecast, by Application 2019 & 2032
- Table 31: Spain Bio-Succinic Acid Market Revenue (Million) Forecast, by Application 2019 & 2032
- Table 32: Spain Bio-Succinic Acid Market Volume (Liters) Forecast, by Application 2019 & 2032
- Table 33: Rest of Europe Bio-Succinic Acid Market Revenue (Million) Forecast, by Application 2019 & 2032
- Table 34: Rest of Europe Bio-Succinic Acid Market Volume (Liters) Forecast, by Application 2019 & 2032
- Table 35: Global Bio-Succinic Acid Market Revenue Million Forecast, by Country 2019 & 2032
- Table 36: Global Bio-Succinic Acid Market Volume Liters Forecast, by Country 2019 & 2032
- Table 37: India Bio-Succinic Acid Market Revenue (Million) Forecast, by Application 2019 & 2032
- Table 38: India Bio-Succinic Acid Market Volume (Liters) Forecast, by Application 2019 & 2032
- Table 39: China Bio-Succinic Acid Market Revenue (Million) Forecast, by Application 2019 & 2032
- Table 40: China Bio-Succinic Acid Market Volume (Liters) Forecast, by Application 2019 & 2032
- Table 41: Japan Bio-Succinic Acid Market Revenue (Million) Forecast, by Application 2019 & 2032
- Table 42: Japan Bio-Succinic Acid Market Volume (Liters) Forecast, by Application 2019 & 2032
- Table 43: Australia Bio-Succinic Acid Market Revenue (Million) Forecast, by Application 2019 & 2032
- Table 44: Australia Bio-Succinic Acid Market Volume (Liters) Forecast, by Application 2019 & 2032
- Table 45: Rest of Asia Pacific Bio-Succinic Acid Market Revenue (Million) Forecast, by Application 2019 & 2032
- Table 46: Rest of Asia Pacific Bio-Succinic Acid Market Volume (Liters) Forecast, by Application 2019 & 2032
- Table 47: Global Bio-Succinic Acid Market Revenue Million Forecast, by Country 2019 & 2032
- Table 48: Global Bio-Succinic Acid Market Volume Liters Forecast, by Country 2019 & 2032
- Table 49: Brazil Bio-Succinic Acid Market Revenue (Million) Forecast, by Application 2019 & 2032
- Table 50: Brazil Bio-Succinic Acid Market Volume (Liters) Forecast, by Application 2019 & 2032
- Table 51: Argentina Bio-Succinic Acid Market Revenue (Million) Forecast, by Application 2019 & 2032
- Table 52: Argentina Bio-Succinic Acid Market Volume (Liters) Forecast, by Application 2019 & 2032
- Table 53: Rest of South America Bio-Succinic Acid Market Revenue (Million) Forecast, by Application 2019 & 2032
- Table 54: Rest of South America Bio-Succinic Acid Market Volume (Liters) Forecast, by Application 2019 & 2032
- Table 55: Global Bio-Succinic Acid Market Revenue Million Forecast, by Country 2019 & 2032
- Table 56: Global Bio-Succinic Acid Market Volume Liters Forecast, by Country 2019 & 2032
- Table 57: South Africa Bio-Succinic Acid Market Revenue (Million) Forecast, by Application 2019 & 2032
- Table 58: South Africa Bio-Succinic Acid Market Volume (Liters) Forecast, by Application 2019 & 2032
- Table 59: Saudi Arabia Bio-Succinic Acid Market Revenue (Million) Forecast, by Application 2019 & 2032
- Table 60: Saudi Arabia Bio-Succinic Acid Market Volume (Liters) Forecast, by Application 2019 & 2032
- Table 61: Rest of Middle East and Africa Bio-Succinic Acid Market Revenue (Million) Forecast, by Application 2019 & 2032
- Table 62: Rest of Middle East and Africa Bio-Succinic Acid Market Volume (Liters) Forecast, by Application 2019 & 2032
- Table 63: Global Bio-Succinic Acid Market Revenue Million Forecast, by Type 2019 & 2032
- Table 64: Global Bio-Succinic Acid Market Volume Liters Forecast, by Type 2019 & 2032
- Table 65: Global Bio-Succinic Acid Market Revenue Million Forecast, by Application 2019 & 2032
- Table 66: Global Bio-Succinic Acid Market Volume Liters Forecast, by Application 2019 & 2032
- Table 67: Global Bio-Succinic Acid Market Revenue Million Forecast, by Country 2019 & 2032
- Table 68: Global Bio-Succinic Acid Market Volume Liters Forecast, by Country 2019 & 2032
- Table 69: United States Bio-Succinic Acid Market Revenue (Million) Forecast, by Application 2019 & 2032
- Table 70: United States Bio-Succinic Acid Market Volume (Liters) Forecast, by Application 2019 & 2032
- Table 71: Canada Bio-Succinic Acid Market Revenue (Million) Forecast, by Application 2019 & 2032
- Table 72: Canada Bio-Succinic Acid Market Volume (Liters) Forecast, by Application 2019 & 2032
- Table 73: Mexico Bio-Succinic Acid Market Revenue (Million) Forecast, by Application 2019 & 2032
- Table 74: Mexico Bio-Succinic Acid Market Volume (Liters) Forecast, by Application 2019 & 2032
- Table 75: Rest of North America Bio-Succinic Acid Market Revenue (Million) Forecast, by Application 2019 & 2032
- Table 76: Rest of North America Bio-Succinic Acid Market Volume (Liters) Forecast, by Application 2019 & 2032
- Table 77: Global Bio-Succinic Acid Market Revenue Million Forecast, by Type 2019 & 2032
- Table 78: Global Bio-Succinic Acid Market Volume Liters Forecast, by Type 2019 & 2032
- Table 79: Global Bio-Succinic Acid Market Revenue Million Forecast, by Application 2019 & 2032
- Table 80: Global Bio-Succinic Acid Market Volume Liters Forecast, by Application 2019 & 2032
- Table 81: Global Bio-Succinic Acid Market Revenue Million Forecast, by Country 2019 & 2032
- Table 82: Global Bio-Succinic Acid Market Volume Liters Forecast, by Country 2019 & 2032
- Table 83: United Kingdom Bio-Succinic Acid Market Revenue (Million) Forecast, by Application 2019 & 2032
- Table 84: United Kingdom Bio-Succinic Acid Market Volume (Liters) Forecast, by Application 2019 & 2032
- Table 85: Germany Bio-Succinic Acid Market Revenue (Million) Forecast, by Application 2019 & 2032
- Table 86: Germany Bio-Succinic Acid Market Volume (Liters) Forecast, by Application 2019 & 2032
- Table 87: France Bio-Succinic Acid Market Revenue (Million) Forecast, by Application 2019 & 2032
- Table 88: France Bio-Succinic Acid Market Volume (Liters) Forecast, by Application 2019 & 2032
- Table 89: Russia Bio-Succinic Acid Market Revenue (Million) Forecast, by Application 2019 & 2032
- Table 90: Russia Bio-Succinic Acid Market Volume (Liters) Forecast, by Application 2019 & 2032
- Table 91: Italy Bio-Succinic Acid Market Revenue (Million) Forecast, by Application 2019 & 2032
- Table 92: Italy Bio-Succinic Acid Market Volume (Liters) Forecast, by Application 2019 & 2032
- Table 93: Spain Bio-Succinic Acid Market Revenue (Million) Forecast, by Application 2019 & 2032
- Table 94: Spain Bio-Succinic Acid Market Volume (Liters) Forecast, by Application 2019 & 2032
- Table 95: Rest of Europe Bio-Succinic Acid Market Revenue (Million) Forecast, by Application 2019 & 2032
- Table 96: Rest of Europe Bio-Succinic Acid Market Volume (Liters) Forecast, by Application 2019 & 2032
- Table 97: Global Bio-Succinic Acid Market Revenue Million Forecast, by Type 2019 & 2032
- Table 98: Global Bio-Succinic Acid Market Volume Liters Forecast, by Type 2019 & 2032
- Table 99: Global Bio-Succinic Acid Market Revenue Million Forecast, by Application 2019 & 2032
- Table 100: Global Bio-Succinic Acid Market Volume Liters Forecast, by Application 2019 & 2032
- Table 101: Global Bio-Succinic Acid Market Revenue Million Forecast, by Country 2019 & 2032
- Table 102: Global Bio-Succinic Acid Market Volume Liters Forecast, by Country 2019 & 2032
- Table 103: India Bio-Succinic Acid Market Revenue (Million) Forecast, by Application 2019 & 2032
- Table 104: India Bio-Succinic Acid Market Volume (Liters) Forecast, by Application 2019 & 2032
- Table 105: China Bio-Succinic Acid Market Revenue (Million) Forecast, by Application 2019 & 2032
- Table 106: China Bio-Succinic Acid Market Volume (Liters) Forecast, by Application 2019 & 2032
- Table 107: Japan Bio-Succinic Acid Market Revenue (Million) Forecast, by Application 2019 & 2032
- Table 108: Japan Bio-Succinic Acid Market Volume (Liters) Forecast, by Application 2019 & 2032
- Table 109: Australia Bio-Succinic Acid Market Revenue (Million) Forecast, by Application 2019 & 2032
- Table 110: Australia Bio-Succinic Acid Market Volume (Liters) Forecast, by Application 2019 & 2032
- Table 111: Rest of Asia Pacific Bio-Succinic Acid Market Revenue (Million) Forecast, by Application 2019 & 2032
- Table 112: Rest of Asia Pacific Bio-Succinic Acid Market Volume (Liters) Forecast, by Application 2019 & 2032
- Table 113: Global Bio-Succinic Acid Market Revenue Million Forecast, by Type 2019 & 2032
- Table 114: Global Bio-Succinic Acid Market Volume Liters Forecast, by Type 2019 & 2032
- Table 115: Global Bio-Succinic Acid Market Revenue Million Forecast, by Application 2019 & 2032
- Table 116: Global Bio-Succinic Acid Market Volume Liters Forecast, by Application 2019 & 2032
- Table 117: Global Bio-Succinic Acid Market Revenue Million Forecast, by Country 2019 & 2032
- Table 118: Global Bio-Succinic Acid Market Volume Liters Forecast, by Country 2019 & 2032
- Table 119: Brazil Bio-Succinic Acid Market Revenue (Million) Forecast, by Application 2019 & 2032
- Table 120: Brazil Bio-Succinic Acid Market Volume (Liters) Forecast, by Application 2019 & 2032
- Table 121: Argentina Bio-Succinic Acid Market Revenue (Million) Forecast, by Application 2019 & 2032
- Table 122: Argentina Bio-Succinic Acid Market Volume (Liters) Forecast, by Application 2019 & 2032
- Table 123: Rest of South America Bio-Succinic Acid Market Revenue (Million) Forecast, by Application 2019 & 2032
- Table 124: Rest of South America Bio-Succinic Acid Market Volume (Liters) Forecast, by Application 2019 & 2032
- Table 125: Global Bio-Succinic Acid Market Revenue Million Forecast, by Type 2019 & 2032
- Table 126: Global Bio-Succinic Acid Market Volume Liters Forecast, by Type 2019 & 2032
- Table 127: Global Bio-Succinic Acid Market Revenue Million Forecast, by Application 2019 & 2032
- Table 128: Global Bio-Succinic Acid Market Volume Liters Forecast, by Application 2019 & 2032
- Table 129: Global Bio-Succinic Acid Market Revenue Million Forecast, by Country 2019 & 2032
- Table 130: Global Bio-Succinic Acid Market Volume Liters Forecast, by Country 2019 & 2032
- Table 131: South Africa Bio-Succinic Acid Market Revenue (Million) Forecast, by Application 2019 & 2032
- Table 132: South Africa Bio-Succinic Acid Market Volume (Liters) Forecast, by Application 2019 & 2032
- Table 133: Saudi Arabia Bio-Succinic Acid Market Revenue (Million) Forecast, by Application 2019 & 2032
- Table 134: Saudi Arabia Bio-Succinic Acid Market Volume (Liters) Forecast, by Application 2019 & 2032
- Table 135: Rest of Middle East and Africa Bio-Succinic Acid Market Revenue (Million) Forecast, by Application 2019 & 2032
- Table 136: Rest of Middle East and Africa Bio-Succinic Acid Market Volume (Liters) Forecast, by Application 2019 & 2032
Frequently Asked Questions
1. What is the projected Compound Annual Growth Rate (CAGR) of the Bio-Succinic Acid Market?
The projected CAGR is approximately 7.20%.
2. Which companies are prominent players in the Bio-Succinic Acid Market?
Key companies in the market include Kawasaki Kasei Chemicals Ltd, Linyi Lixing Chemical Co Ltd, Mitsubishi Chemical Corporation, BASF SE, Gadiv Petrochemical Industries Ltd, Corbion N V *List Not Exhaustive, Nippon Shokubai, Anhui Sunsing Chemicals, Succinity Gmbh, Reverdia, Myriant.
3. What are the main segments of the Bio-Succinic Acid Market?
The market segments include Type, Application.
4. Can you provide details about the market size?
The market size is estimated to be USD 126.80 Million as of 2022.
5. What are some drivers contributing to market growth?
Increasing Demand for Functional and Fortified Food; Multi-functionality and Wide Application of Riboflavin.
6. What are the notable trends driving market growth?
Increase in Demand for a Bioplastics Using Succinic Acid.
7. Are there any restraints impacting market growth?
Low Stability of Riboflavin on Exposure to Light and Heat.
8. Can you provide examples of recent developments in the market?
In August 2022, A technology solution has been added to Technip Energies' expanding portfolio of sustainable chemicals with the acquisition of Biosuccinium technology from DSM. The newly acquired method commercially referenced the production of bio-based succinic acid (bio-SAc), which is used as a feedstock for the manufacturing of polybutylene succinate.
9. What pricing options are available for accessing the report?
Pricing options include single-user, multi-user, and enterprise licenses priced at USD 4750, USD 5250, and USD 8750 respectively.
10. Is the market size provided in terms of value or volume?
The market size is provided in terms of value, measured in Million and volume, measured in Liters.
11. Are there any specific market keywords associated with the report?
Yes, the market keyword associated with the report is "Bio-Succinic Acid Market," which aids in identifying and referencing the specific market segment covered.
12. How do I determine which pricing option suits my needs best?
The pricing options vary based on user requirements and access needs. Individual users may opt for single-user licenses, while businesses requiring broader access may choose multi-user or enterprise licenses for cost-effective access to the report.
13. Are there any additional resources or data provided in the Bio-Succinic Acid Market report?
While the report offers comprehensive insights, it's advisable to review the specific contents or supplementary materials provided to ascertain if additional resources or data are available.
14. How can I stay updated on further developments or reports in the Bio-Succinic Acid Market?
To stay informed about further developments, trends, and reports in the Bio-Succinic Acid Market, consider subscribing to industry newsletters, following relevant companies and organizations, or regularly checking reputable industry news sources and publications.
Methodology
Step 1 - Identification of Relevant Samples Size from Population Database


Step 2 - Approaches for Defining Global Market Size (Value, Volume* & Price*)

Note*: In applicable scenarios
Step 3 - Data Sources
Primary Research
- Web Analytics
- Survey Reports
- Research Institute
- Latest Research Reports
- Opinion Leaders
Secondary Research
- Annual Reports
- White Paper
- Latest Press Release
- Industry Association
- Paid Database
- Investor Presentations

Step 4 - Data Triangulation
Involves using different sources of information in order to increase the validity of a study
These sources are likely to be stakeholders in a program - participants, other researchers, program staff, other community members, and so on.
Then we put all data in single framework & apply various statistical tools to find out the dynamic on the market.
During the analysis stage, feedback from the stakeholder groups would be compared to determine areas of agreement as well as areas of divergence


