
Key Insights
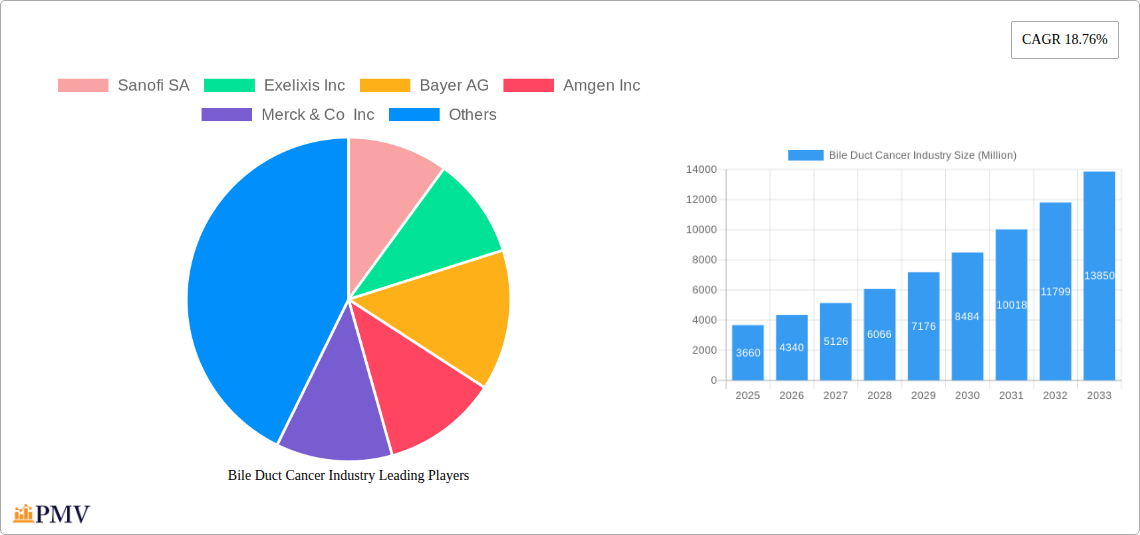
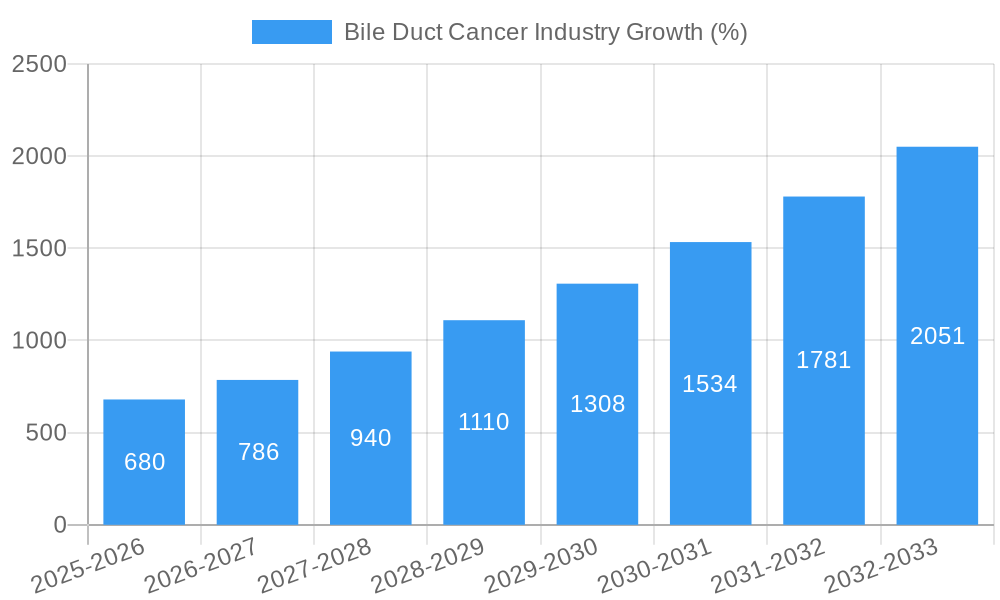
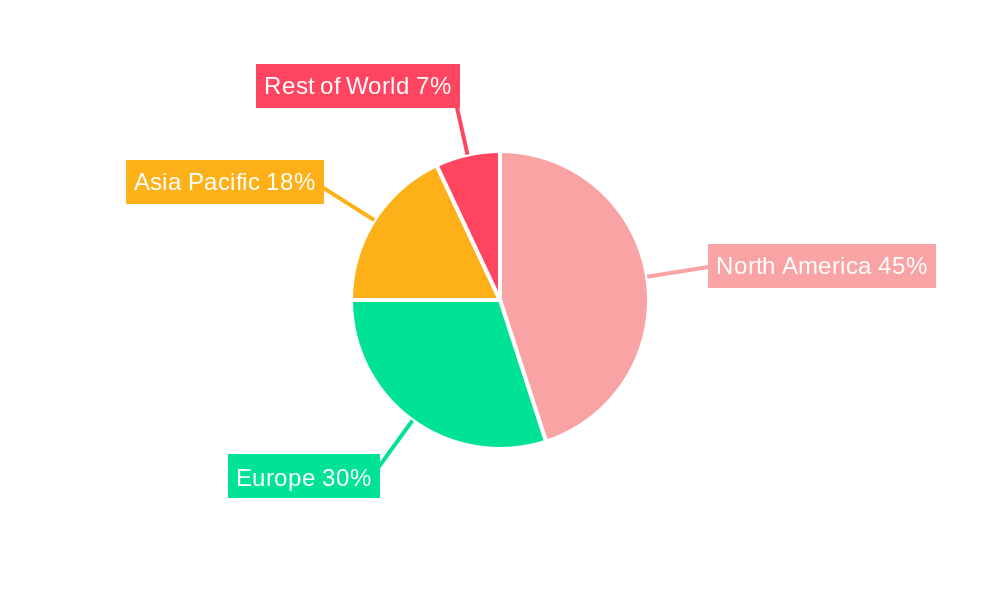
The bile duct cancer market, valued at $3.66 billion in 2025, is projected to experience robust growth, driven by increasing prevalence of the disease, advancements in targeted therapies, and rising healthcare expenditure globally. The compound annual growth rate (CAGR) of 18.76% from 2025 to 2033 signifies a substantial market expansion. Key drivers include the aging population, increased exposure to risk factors like liver cirrhosis and chronic infections, and improved diagnostic capabilities leading to earlier detection. Growth is further fueled by the emergence of innovative therapies such as immunotherapy and targeted therapies that offer improved patient outcomes compared to traditional chemotherapy and radiation. However, challenges remain, including the relatively low incidence rate in certain regions, high treatment costs limiting accessibility, and the inherent complexities in diagnosing bile duct cancer at early stages. Segment-wise, hepatocellular carcinoma and cholangiocarcinoma are expected to dominate the market due to their higher prevalence. Targeted therapies are projected to capture a significant market share given their improved efficacy and reduced side effects compared to traditional therapies. Geographically, North America and Europe are expected to retain significant market shares owing to advanced healthcare infrastructure and high awareness among patients and healthcare professionals. However, the Asia Pacific region is poised for significant growth, fueled by rising healthcare expenditure, increasing disease awareness, and expanding access to advanced therapies. The competitive landscape is marked by the presence of major pharmaceutical companies like Sanofi, Exelixis, Bayer, and others continually investing in research and development of novel therapies for bile duct cancer.
The market's growth trajectory is influenced by several factors. While the high cost of treatment may hinder market penetration in some regions, the growing research efforts focused on developing more effective and less toxic therapies promise to overcome this. The increasing focus on early detection and improved diagnostic technologies should also positively influence the market's growth. The continued expansion of healthcare infrastructure, particularly in emerging economies, will further contribute to market growth. Competition among major pharmaceutical companies is expected to spur innovation and lead to the development of more accessible and affordable treatment options in the coming years. The long-term outlook for the bile duct cancer market remains positive, driven by ongoing advancements in treatment and a rising global awareness of this critical health concern.
Bile Duct Cancer Industry Market Report: 2019-2033
This comprehensive report provides an in-depth analysis of the Bile Duct Cancer industry, offering valuable insights for stakeholders, investors, and industry professionals. Covering the period from 2019 to 2033, with a focus on 2025, this report analyzes market dynamics, competitive landscapes, and future growth projections, encompassing a market valued at xx Million.
Bile Duct Cancer Industry Market Structure & Competitive Dynamics
The Bile Duct Cancer industry exhibits a moderately concentrated market structure, with a handful of major players holding significant market share. Market share is dynamic, influenced by ongoing research and development, regulatory approvals, and strategic mergers and acquisitions (M&A). Innovation ecosystems are robust, driven by significant investment in research and development of targeted therapies, immunotherapies, and other advanced treatment modalities. Regulatory frameworks vary across global regions, impacting market access and timelines for new drug approvals. The industry faces competition from alternative treatment options, such as surgery and radiation therapy, though targeted therapies are increasingly dominating. End-user trends are focused on minimally invasive procedures and improved patient outcomes. M&A activities have been substantial, with deal values exceeding xx Million in recent years, reflecting the industry's consolidation and expansion.
- Market Concentration: The top 5 companies hold approximately xx% of the market share.
- M&A Activity: Over the past five years, there have been xx M&A deals, with a total value exceeding xx Million.
- Regulatory Landscape: Stringent regulatory requirements influence the speed of drug approvals and market entry.
- Innovation Ecosystems: Significant R&D investment fuels the development of new therapeutic approaches.
Bile Duct Cancer Industry Trends & Insights
The Bile Duct Cancer market is experiencing substantial growth, driven by several factors. Increasing prevalence of bile duct cancer, advancements in diagnostic techniques leading to earlier detection, and the development of novel targeted therapies and immunotherapies are key contributors to market expansion. Technological disruptions are primarily in the form of advancements in genetic sequencing and personalized medicine, enabling more precise targeting of cancer cells and reducing side effects. Consumer preferences are shifting toward less invasive treatments with improved efficacy and quality of life. Competitive dynamics are intense, with companies striving to develop and commercialize innovative therapies. The CAGR for the forecast period (2025-2033) is estimated at xx%, with market penetration of targeted therapies expected to reach xx% by 2033.
Dominant Markets & Segments in Bile Duct Cancer Industry
By Type:
- Hepatocellular Carcinoma (HCC): This segment dominates the market due to its high prevalence and significant unmet medical need. Key drivers include increased awareness, improved diagnostic capabilities, and the availability of targeted therapies.
- Cholangiocarcinoma: This segment represents a significant portion of the market, with growth driven by improved understanding of the disease and the development of new treatment options.
- Hepatoblastoma: This segment shows potential for growth, but is relatively smaller due to lower prevalence.
- Other Types: This encompasses a range of rare bile duct cancers with limited treatment options, representing a smaller segment of the market.
By Therapy:
- Targeted Therapy: This segment is the fastest-growing, driven by the development of novel agents with improved efficacy and safety profiles.
- Immunotherapy: This segment shows significant growth potential, fueled by ongoing clinical trials and advancements in immunotherapy approaches.
- Chemotherapy: This remains a mainstay of treatment, but its use is declining relative to targeted and immunotherapy options.
- Radiation Therapy: This continues to play a crucial role in the treatment of bile duct cancer, often in combination with other therapies.
The North American region currently holds the largest market share, driven by high healthcare expenditure, advanced healthcare infrastructure, and a robust research ecosystem.
Bile Duct Cancer Industry Product Innovations
Recent advancements in targeted therapies, immunotherapies, and combination therapies are revolutionizing the treatment landscape for bile duct cancer. These innovations aim to improve treatment outcomes, reduce side effects, and extend patient survival. The development of personalized medicine approaches, tailored to individual genetic profiles, offers significant promise in enhancing treatment efficacy. Technological advancements such as liquid biopsies and advanced imaging techniques are facilitating earlier diagnosis and improved treatment monitoring. These innovations are transforming the industry, driving market growth and improved patient care.
Report Segmentation & Scope
This report segments the bile duct cancer market by type (Hepatocellular Carcinoma, Cholangiocarcinoma, Hepatoblastoma, Other Types) and by therapy (Targeted Therapy, Radiation Therapy, Immunotherapy, Chemotherapy). Each segment is analyzed based on its historical performance (2019-2024), current market size (2025), and future projections (2025-2033). The analysis includes market size estimations, growth rates, competitive landscapes, and key drivers for each segment. Significant variations exist in growth projections across segments, reflecting differing treatment approaches and market dynamics.
Key Drivers of Bile Duct Cancer Industry Growth
Several factors are driving the growth of the bile duct cancer industry. Increased awareness and improved diagnostic capabilities lead to earlier detection and intervention. Advancements in targeted therapies, immunotherapies, and combination regimens are significantly improving treatment outcomes and patient survival. Growing research and development investments by pharmaceutical companies and academic institutions are fueling the discovery and development of novel therapeutic approaches. Favorable regulatory environments and supportive reimbursement policies further enhance market growth.
Challenges in the Bile Duct Cancer Industry Sector
Despite significant advancements, the Bile Duct Cancer industry faces several challenges. The high cost of novel therapies presents a significant barrier to patient access. Resistance to treatment remains a major concern, necessitating the development of innovative treatment strategies. The relatively low prevalence of some bile duct cancer subtypes poses difficulties in conducting large-scale clinical trials. Regulatory complexities and varying reimbursement policies across different healthcare systems add to the challenges faced by industry players. The estimated impact of these challenges on market growth is approximately xx Million annually.
Leading Players in the Bile Duct Cancer Industry Market
- Sanofi SA
- Exelixis Inc
- Bayer AG
- Amgen Inc
- Merck & Co Inc
- F Hoffmann-La Roche Ltd
- AstraZeneca PLC
- Eli Lilly and Company
- AbbVie Inc
- Bristol Myers Squibb Company
- Novartis AG
- Johnson & Johnson
- Eisai Co Ltd
- Celsion Corporation
- Pfizer Inc
Key Developments in Bile Duct Cancer Industry Sector
- February 2023: AstraZeneca's Imfinzi (durvalumab) and Imjudo (tremelimumab) immunotherapy combinations received EU approval for advanced liver and lung cancers, including hepatocellular carcinoma. This significantly impacts the market by offering a new first-line treatment option.
- March 2023: The University of Southern California (USC) and Auransa Inc. initiated a Phase 1 clinical trial for AU409, a novel drug for liver and liver-dominant solid tumors. This signifies progress in developing innovative treatments for bile duct cancer.
Strategic Bile Duct Cancer Industry Market Outlook
The Bile Duct Cancer industry is poised for continued growth, driven by ongoing research and development, the emergence of innovative therapies, and an increasing understanding of the disease. Strategic opportunities lie in developing personalized medicine approaches, focusing on early detection strategies, and expanding access to novel treatments in underserved regions. The market's future success hinges on continued innovation, effective collaborations, and a focus on improving patient outcomes. The projected market size in 2033 is xx Million, reflecting significant growth potential.
Bile Duct Cancer Industry Segmentation
-
1. Type
- 1.1. Hepatocellular Carcinoma
- 1.2. Cholangio Carcinoma
- 1.3. Hepatoblastoma
- 1.4. Other Types
-
2. Therapy
- 2.1. Targeted Therapy
- 2.2. Radiation Therapy
- 2.3. Immunotherapy
- 2.4. Chemotherapy
-
3. End-user
- 3.1. Hospitals
- 3.2. Clinics
- 3.3. Research Institutions
Bile Duct Cancer Industry Segmentation By Geography
-
1. North America
- 1.1. United States
- 1.2. Canada
- 1.3. Mexico
-
2. Europe
- 2.1. Germany
- 2.2. United Kingdom
- 2.3. France
- 2.4. Italy
- 2.5. Spain
- 2.6. Rest of Europe
-
3. Asia Pacific
- 3.1. China
- 3.2. Japan
- 3.3. India
- 3.4. Australia
- 3.5. South Korea
- 3.6. Rest of Asia Pacific
-
4. Middle East and Africa
- 4.1. GCC
- 4.2. South Africa
- 4.3. Rest of Middle East and Africa
-
5. South America
- 5.1. Brazil
- 5.2. Argentina
- 5.3. Rest of South America
Bile Duct Cancer Industry REPORT HIGHLIGHTS
| Aspects | Details |
|---|---|
| Study Period | 2019-2033 |
| Base Year | 2024 |
| Estimated Year | 2025 |
| Forecast Period | 2025-2033 |
| Historical Period | 2019-2024 |
| Growth Rate | CAGR of 18.76% from 2019-2033 |
| Segmentation |
|
Table of Contents
- 1. Introduction
- 1.1. Research Scope
- 1.2. Market Segmentation
- 1.3. Research Methodology
- 1.4. Definitions and Assumptions
- 2. Executive Summary
- 2.1. Introduction
- 3. Market Dynamics
- 3.1. Introduction
- 3.2. Market Drivers
- 3.2.1. Rising Burden of Liver Cancer; Increasing R&D Investments for the Development of Novel Therapies; Government Initiatives to Increase the Cancer Awareness
- 3.3. Market Restrains
- 3.3.1. Side Effects Associated with Certain Medications Coupled with High Cost of Cancer Therapies; Stringent Regulatory Scenario
- 3.4. Market Trends
- 3.4.1. Hepatocellular Carcinoma Segment is Expected to Occupy a Significant Share Over the Forecast Period
- 4. Market Factor Analysis
- 4.1. Porters Five Forces
- 4.2. Supply/Value Chain
- 4.3. PESTEL analysis
- 4.4. Market Entropy
- 4.5. Patent/Trademark Analysis
- 5. Global Bile Duct Cancer Industry Analysis, Insights and Forecast, 2019-2031
- 5.1. Market Analysis, Insights and Forecast - by Type
- 5.1.1. Hepatocellular Carcinoma
- 5.1.2. Cholangio Carcinoma
- 5.1.3. Hepatoblastoma
- 5.1.4. Other Types
- 5.2. Market Analysis, Insights and Forecast - by Therapy
- 5.2.1. Targeted Therapy
- 5.2.2. Radiation Therapy
- 5.2.3. Immunotherapy
- 5.2.4. Chemotherapy
- 5.3. Market Analysis, Insights and Forecast - by End-user
- 5.3.1. Hospitals
- 5.3.2. Clinics
- 5.3.3. Research Institutions
- 5.4. Market Analysis, Insights and Forecast - by Region
- 5.4.1. North America
- 5.4.2. Europe
- 5.4.3. Asia Pacific
- 5.4.4. Middle East and Africa
- 5.4.5. South America
- 5.1. Market Analysis, Insights and Forecast - by Type
- 6. North America Bile Duct Cancer Industry Analysis, Insights and Forecast, 2019-2031
- 6.1. Market Analysis, Insights and Forecast - by Type
- 6.1.1. Hepatocellular Carcinoma
- 6.1.2. Cholangio Carcinoma
- 6.1.3. Hepatoblastoma
- 6.1.4. Other Types
- 6.2. Market Analysis, Insights and Forecast - by Therapy
- 6.2.1. Targeted Therapy
- 6.2.2. Radiation Therapy
- 6.2.3. Immunotherapy
- 6.2.4. Chemotherapy
- 6.3. Market Analysis, Insights and Forecast - by End-user
- 6.3.1. Hospitals
- 6.3.2. Clinics
- 6.3.3. Research Institutions
- 6.1. Market Analysis, Insights and Forecast - by Type
- 7. Europe Bile Duct Cancer Industry Analysis, Insights and Forecast, 2019-2031
- 7.1. Market Analysis, Insights and Forecast - by Type
- 7.1.1. Hepatocellular Carcinoma
- 7.1.2. Cholangio Carcinoma
- 7.1.3. Hepatoblastoma
- 7.1.4. Other Types
- 7.2. Market Analysis, Insights and Forecast - by Therapy
- 7.2.1. Targeted Therapy
- 7.2.2. Radiation Therapy
- 7.2.3. Immunotherapy
- 7.2.4. Chemotherapy
- 7.3. Market Analysis, Insights and Forecast - by End-user
- 7.3.1. Hospitals
- 7.3.2. Clinics
- 7.3.3. Research Institutions
- 7.1. Market Analysis, Insights and Forecast - by Type
- 8. Asia Pacific Bile Duct Cancer Industry Analysis, Insights and Forecast, 2019-2031
- 8.1. Market Analysis, Insights and Forecast - by Type
- 8.1.1. Hepatocellular Carcinoma
- 8.1.2. Cholangio Carcinoma
- 8.1.3. Hepatoblastoma
- 8.1.4. Other Types
- 8.2. Market Analysis, Insights and Forecast - by Therapy
- 8.2.1. Targeted Therapy
- 8.2.2. Radiation Therapy
- 8.2.3. Immunotherapy
- 8.2.4. Chemotherapy
- 8.3. Market Analysis, Insights and Forecast - by End-user
- 8.3.1. Hospitals
- 8.3.2. Clinics
- 8.3.3. Research Institutions
- 8.1. Market Analysis, Insights and Forecast - by Type
- 9. Middle East and Africa Bile Duct Cancer Industry Analysis, Insights and Forecast, 2019-2031
- 9.1. Market Analysis, Insights and Forecast - by Type
- 9.1.1. Hepatocellular Carcinoma
- 9.1.2. Cholangio Carcinoma
- 9.1.3. Hepatoblastoma
- 9.1.4. Other Types
- 9.2. Market Analysis, Insights and Forecast - by Therapy
- 9.2.1. Targeted Therapy
- 9.2.2. Radiation Therapy
- 9.2.3. Immunotherapy
- 9.2.4. Chemotherapy
- 9.3. Market Analysis, Insights and Forecast - by End-user
- 9.3.1. Hospitals
- 9.3.2. Clinics
- 9.3.3. Research Institutions
- 9.1. Market Analysis, Insights and Forecast - by Type
- 10. South America Bile Duct Cancer Industry Analysis, Insights and Forecast, 2019-2031
- 10.1. Market Analysis, Insights and Forecast - by Type
- 10.1.1. Hepatocellular Carcinoma
- 10.1.2. Cholangio Carcinoma
- 10.1.3. Hepatoblastoma
- 10.1.4. Other Types
- 10.2. Market Analysis, Insights and Forecast - by Therapy
- 10.2.1. Targeted Therapy
- 10.2.2. Radiation Therapy
- 10.2.3. Immunotherapy
- 10.2.4. Chemotherapy
- 10.3. Market Analysis, Insights and Forecast - by End-user
- 10.3.1. Hospitals
- 10.3.2. Clinics
- 10.3.3. Research Institutions
- 10.1. Market Analysis, Insights and Forecast - by Type
- 11. North America Bile Duct Cancer Industry Analysis, Insights and Forecast, 2019-2031
- 11.1. Market Analysis, Insights and Forecast - By Country/Sub-region
- 11.1.1 United States
- 11.1.2 Canada
- 11.1.3 Mexico
- 12. Europe Bile Duct Cancer Industry Analysis, Insights and Forecast, 2019-2031
- 12.1. Market Analysis, Insights and Forecast - By Country/Sub-region
- 12.1.1 Germany
- 12.1.2 United Kingdom
- 12.1.3 France
- 12.1.4 Italy
- 12.1.5 Spain
- 12.1.6 Rest of Europe
- 13. Asia Pacific Bile Duct Cancer Industry Analysis, Insights and Forecast, 2019-2031
- 13.1. Market Analysis, Insights and Forecast - By Country/Sub-region
- 13.1.1 China
- 13.1.2 Japan
- 13.1.3 India
- 13.1.4 Australia
- 13.1.5 South Korea
- 13.1.6 Rest of Asia Pacific
- 14. Middle East and Africa Bile Duct Cancer Industry Analysis, Insights and Forecast, 2019-2031
- 14.1. Market Analysis, Insights and Forecast - By Country/Sub-region
- 14.1.1 GCC
- 14.1.2 South Africa
- 14.1.3 Rest of Middle East and Africa
- 15. South America Bile Duct Cancer Industry Analysis, Insights and Forecast, 2019-2031
- 15.1. Market Analysis, Insights and Forecast - By Country/Sub-region
- 15.1.1 Brazil
- 15.1.2 Argentina
- 15.1.3 Rest of South America
- 16. Competitive Analysis
- 16.1. Global Market Share Analysis 2024
- 16.2. Company Profiles
- 16.2.1 Sanofi SA
- 16.2.1.1. Overview
- 16.2.1.2. Products
- 16.2.1.3. SWOT Analysis
- 16.2.1.4. Recent Developments
- 16.2.1.5. Financials (Based on Availability)
- 16.2.2 Exelixis Inc
- 16.2.2.1. Overview
- 16.2.2.2. Products
- 16.2.2.3. SWOT Analysis
- 16.2.2.4. Recent Developments
- 16.2.2.5. Financials (Based on Availability)
- 16.2.3 Bayer AG
- 16.2.3.1. Overview
- 16.2.3.2. Products
- 16.2.3.3. SWOT Analysis
- 16.2.3.4. Recent Developments
- 16.2.3.5. Financials (Based on Availability)
- 16.2.4 Amgen Inc
- 16.2.4.1. Overview
- 16.2.4.2. Products
- 16.2.4.3. SWOT Analysis
- 16.2.4.4. Recent Developments
- 16.2.4.5. Financials (Based on Availability)
- 16.2.5 Merck & Co Inc
- 16.2.5.1. Overview
- 16.2.5.2. Products
- 16.2.5.3. SWOT Analysis
- 16.2.5.4. Recent Developments
- 16.2.5.5. Financials (Based on Availability)
- 16.2.6 F Hoffmann-La Roche Ltd
- 16.2.6.1. Overview
- 16.2.6.2. Products
- 16.2.6.3. SWOT Analysis
- 16.2.6.4. Recent Developments
- 16.2.6.5. Financials (Based on Availability)
- 16.2.7 AstraZeneca PLC
- 16.2.7.1. Overview
- 16.2.7.2. Products
- 16.2.7.3. SWOT Analysis
- 16.2.7.4. Recent Developments
- 16.2.7.5. Financials (Based on Availability)
- 16.2.8 Eli Lilly and Company
- 16.2.8.1. Overview
- 16.2.8.2. Products
- 16.2.8.3. SWOT Analysis
- 16.2.8.4. Recent Developments
- 16.2.8.5. Financials (Based on Availability)
- 16.2.9 AbbVie Inc
- 16.2.9.1. Overview
- 16.2.9.2. Products
- 16.2.9.3. SWOT Analysis
- 16.2.9.4. Recent Developments
- 16.2.9.5. Financials (Based on Availability)
- 16.2.10 Bristol Myers Squibb Company
- 16.2.10.1. Overview
- 16.2.10.2. Products
- 16.2.10.3. SWOT Analysis
- 16.2.10.4. Recent Developments
- 16.2.10.5. Financials (Based on Availability)
- 16.2.11 Novartis AG
- 16.2.11.1. Overview
- 16.2.11.2. Products
- 16.2.11.3. SWOT Analysis
- 16.2.11.4. Recent Developments
- 16.2.11.5. Financials (Based on Availability)
- 16.2.12 Johnson & Johnson
- 16.2.12.1. Overview
- 16.2.12.2. Products
- 16.2.12.3. SWOT Analysis
- 16.2.12.4. Recent Developments
- 16.2.12.5. Financials (Based on Availability)
- 16.2.13 Eisai Co Ltd
- 16.2.13.1. Overview
- 16.2.13.2. Products
- 16.2.13.3. SWOT Analysis
- 16.2.13.4. Recent Developments
- 16.2.13.5. Financials (Based on Availability)
- 16.2.14 Celsion Corporation
- 16.2.14.1. Overview
- 16.2.14.2. Products
- 16.2.14.3. SWOT Analysis
- 16.2.14.4. Recent Developments
- 16.2.14.5. Financials (Based on Availability)
- 16.2.15 Pfizer Inc
- 16.2.15.1. Overview
- 16.2.15.2. Products
- 16.2.15.3. SWOT Analysis
- 16.2.15.4. Recent Developments
- 16.2.15.5. Financials (Based on Availability)
- 16.2.1 Sanofi SA
List of Figures
- Figure 1: Global Bile Duct Cancer Industry Revenue Breakdown (Million, %) by Region 2024 & 2032
- Figure 2: Global Bile Duct Cancer Industry Volume Breakdown (K Unit, %) by Region 2024 & 2032
- Figure 3: North America Bile Duct Cancer Industry Revenue (Million), by Country 2024 & 2032
- Figure 4: North America Bile Duct Cancer Industry Volume (K Unit), by Country 2024 & 2032
- Figure 5: North America Bile Duct Cancer Industry Revenue Share (%), by Country 2024 & 2032
- Figure 6: North America Bile Duct Cancer Industry Volume Share (%), by Country 2024 & 2032
- Figure 7: Europe Bile Duct Cancer Industry Revenue (Million), by Country 2024 & 2032
- Figure 8: Europe Bile Duct Cancer Industry Volume (K Unit), by Country 2024 & 2032
- Figure 9: Europe Bile Duct Cancer Industry Revenue Share (%), by Country 2024 & 2032
- Figure 10: Europe Bile Duct Cancer Industry Volume Share (%), by Country 2024 & 2032
- Figure 11: Asia Pacific Bile Duct Cancer Industry Revenue (Million), by Country 2024 & 2032
- Figure 12: Asia Pacific Bile Duct Cancer Industry Volume (K Unit), by Country 2024 & 2032
- Figure 13: Asia Pacific Bile Duct Cancer Industry Revenue Share (%), by Country 2024 & 2032
- Figure 14: Asia Pacific Bile Duct Cancer Industry Volume Share (%), by Country 2024 & 2032
- Figure 15: Middle East and Africa Bile Duct Cancer Industry Revenue (Million), by Country 2024 & 2032
- Figure 16: Middle East and Africa Bile Duct Cancer Industry Volume (K Unit), by Country 2024 & 2032
- Figure 17: Middle East and Africa Bile Duct Cancer Industry Revenue Share (%), by Country 2024 & 2032
- Figure 18: Middle East and Africa Bile Duct Cancer Industry Volume Share (%), by Country 2024 & 2032
- Figure 19: South America Bile Duct Cancer Industry Revenue (Million), by Country 2024 & 2032
- Figure 20: South America Bile Duct Cancer Industry Volume (K Unit), by Country 2024 & 2032
- Figure 21: South America Bile Duct Cancer Industry Revenue Share (%), by Country 2024 & 2032
- Figure 22: South America Bile Duct Cancer Industry Volume Share (%), by Country 2024 & 2032
- Figure 23: North America Bile Duct Cancer Industry Revenue (Million), by Type 2024 & 2032
- Figure 24: North America Bile Duct Cancer Industry Volume (K Unit), by Type 2024 & 2032
- Figure 25: North America Bile Duct Cancer Industry Revenue Share (%), by Type 2024 & 2032
- Figure 26: North America Bile Duct Cancer Industry Volume Share (%), by Type 2024 & 2032
- Figure 27: North America Bile Duct Cancer Industry Revenue (Million), by Therapy 2024 & 2032
- Figure 28: North America Bile Duct Cancer Industry Volume (K Unit), by Therapy 2024 & 2032
- Figure 29: North America Bile Duct Cancer Industry Revenue Share (%), by Therapy 2024 & 2032
- Figure 30: North America Bile Duct Cancer Industry Volume Share (%), by Therapy 2024 & 2032
- Figure 31: North America Bile Duct Cancer Industry Revenue (Million), by End-user 2024 & 2032
- Figure 32: North America Bile Duct Cancer Industry Volume (K Unit), by End-user 2024 & 2032
- Figure 33: North America Bile Duct Cancer Industry Revenue Share (%), by End-user 2024 & 2032
- Figure 34: North America Bile Duct Cancer Industry Volume Share (%), by End-user 2024 & 2032
- Figure 35: North America Bile Duct Cancer Industry Revenue (Million), by Country 2024 & 2032
- Figure 36: North America Bile Duct Cancer Industry Volume (K Unit), by Country 2024 & 2032
- Figure 37: North America Bile Duct Cancer Industry Revenue Share (%), by Country 2024 & 2032
- Figure 38: North America Bile Duct Cancer Industry Volume Share (%), by Country 2024 & 2032
- Figure 39: Europe Bile Duct Cancer Industry Revenue (Million), by Type 2024 & 2032
- Figure 40: Europe Bile Duct Cancer Industry Volume (K Unit), by Type 2024 & 2032
- Figure 41: Europe Bile Duct Cancer Industry Revenue Share (%), by Type 2024 & 2032
- Figure 42: Europe Bile Duct Cancer Industry Volume Share (%), by Type 2024 & 2032
- Figure 43: Europe Bile Duct Cancer Industry Revenue (Million), by Therapy 2024 & 2032
- Figure 44: Europe Bile Duct Cancer Industry Volume (K Unit), by Therapy 2024 & 2032
- Figure 45: Europe Bile Duct Cancer Industry Revenue Share (%), by Therapy 2024 & 2032
- Figure 46: Europe Bile Duct Cancer Industry Volume Share (%), by Therapy 2024 & 2032
- Figure 47: Europe Bile Duct Cancer Industry Revenue (Million), by End-user 2024 & 2032
- Figure 48: Europe Bile Duct Cancer Industry Volume (K Unit), by End-user 2024 & 2032
- Figure 49: Europe Bile Duct Cancer Industry Revenue Share (%), by End-user 2024 & 2032
- Figure 50: Europe Bile Duct Cancer Industry Volume Share (%), by End-user 2024 & 2032
- Figure 51: Europe Bile Duct Cancer Industry Revenue (Million), by Country 2024 & 2032
- Figure 52: Europe Bile Duct Cancer Industry Volume (K Unit), by Country 2024 & 2032
- Figure 53: Europe Bile Duct Cancer Industry Revenue Share (%), by Country 2024 & 2032
- Figure 54: Europe Bile Duct Cancer Industry Volume Share (%), by Country 2024 & 2032
- Figure 55: Asia Pacific Bile Duct Cancer Industry Revenue (Million), by Type 2024 & 2032
- Figure 56: Asia Pacific Bile Duct Cancer Industry Volume (K Unit), by Type 2024 & 2032
- Figure 57: Asia Pacific Bile Duct Cancer Industry Revenue Share (%), by Type 2024 & 2032
- Figure 58: Asia Pacific Bile Duct Cancer Industry Volume Share (%), by Type 2024 & 2032
- Figure 59: Asia Pacific Bile Duct Cancer Industry Revenue (Million), by Therapy 2024 & 2032
- Figure 60: Asia Pacific Bile Duct Cancer Industry Volume (K Unit), by Therapy 2024 & 2032
- Figure 61: Asia Pacific Bile Duct Cancer Industry Revenue Share (%), by Therapy 2024 & 2032
- Figure 62: Asia Pacific Bile Duct Cancer Industry Volume Share (%), by Therapy 2024 & 2032
- Figure 63: Asia Pacific Bile Duct Cancer Industry Revenue (Million), by End-user 2024 & 2032
- Figure 64: Asia Pacific Bile Duct Cancer Industry Volume (K Unit), by End-user 2024 & 2032
- Figure 65: Asia Pacific Bile Duct Cancer Industry Revenue Share (%), by End-user 2024 & 2032
- Figure 66: Asia Pacific Bile Duct Cancer Industry Volume Share (%), by End-user 2024 & 2032
- Figure 67: Asia Pacific Bile Duct Cancer Industry Revenue (Million), by Country 2024 & 2032
- Figure 68: Asia Pacific Bile Duct Cancer Industry Volume (K Unit), by Country 2024 & 2032
- Figure 69: Asia Pacific Bile Duct Cancer Industry Revenue Share (%), by Country 2024 & 2032
- Figure 70: Asia Pacific Bile Duct Cancer Industry Volume Share (%), by Country 2024 & 2032
- Figure 71: Middle East and Africa Bile Duct Cancer Industry Revenue (Million), by Type 2024 & 2032
- Figure 72: Middle East and Africa Bile Duct Cancer Industry Volume (K Unit), by Type 2024 & 2032
- Figure 73: Middle East and Africa Bile Duct Cancer Industry Revenue Share (%), by Type 2024 & 2032
- Figure 74: Middle East and Africa Bile Duct Cancer Industry Volume Share (%), by Type 2024 & 2032
- Figure 75: Middle East and Africa Bile Duct Cancer Industry Revenue (Million), by Therapy 2024 & 2032
- Figure 76: Middle East and Africa Bile Duct Cancer Industry Volume (K Unit), by Therapy 2024 & 2032
- Figure 77: Middle East and Africa Bile Duct Cancer Industry Revenue Share (%), by Therapy 2024 & 2032
- Figure 78: Middle East and Africa Bile Duct Cancer Industry Volume Share (%), by Therapy 2024 & 2032
- Figure 79: Middle East and Africa Bile Duct Cancer Industry Revenue (Million), by End-user 2024 & 2032
- Figure 80: Middle East and Africa Bile Duct Cancer Industry Volume (K Unit), by End-user 2024 & 2032
- Figure 81: Middle East and Africa Bile Duct Cancer Industry Revenue Share (%), by End-user 2024 & 2032
- Figure 82: Middle East and Africa Bile Duct Cancer Industry Volume Share (%), by End-user 2024 & 2032
- Figure 83: Middle East and Africa Bile Duct Cancer Industry Revenue (Million), by Country 2024 & 2032
- Figure 84: Middle East and Africa Bile Duct Cancer Industry Volume (K Unit), by Country 2024 & 2032
- Figure 85: Middle East and Africa Bile Duct Cancer Industry Revenue Share (%), by Country 2024 & 2032
- Figure 86: Middle East and Africa Bile Duct Cancer Industry Volume Share (%), by Country 2024 & 2032
- Figure 87: South America Bile Duct Cancer Industry Revenue (Million), by Type 2024 & 2032
- Figure 88: South America Bile Duct Cancer Industry Volume (K Unit), by Type 2024 & 2032
- Figure 89: South America Bile Duct Cancer Industry Revenue Share (%), by Type 2024 & 2032
- Figure 90: South America Bile Duct Cancer Industry Volume Share (%), by Type 2024 & 2032
- Figure 91: South America Bile Duct Cancer Industry Revenue (Million), by Therapy 2024 & 2032
- Figure 92: South America Bile Duct Cancer Industry Volume (K Unit), by Therapy 2024 & 2032
- Figure 93: South America Bile Duct Cancer Industry Revenue Share (%), by Therapy 2024 & 2032
- Figure 94: South America Bile Duct Cancer Industry Volume Share (%), by Therapy 2024 & 2032
- Figure 95: South America Bile Duct Cancer Industry Revenue (Million), by End-user 2024 & 2032
- Figure 96: South America Bile Duct Cancer Industry Volume (K Unit), by End-user 2024 & 2032
- Figure 97: South America Bile Duct Cancer Industry Revenue Share (%), by End-user 2024 & 2032
- Figure 98: South America Bile Duct Cancer Industry Volume Share (%), by End-user 2024 & 2032
- Figure 99: South America Bile Duct Cancer Industry Revenue (Million), by Country 2024 & 2032
- Figure 100: South America Bile Duct Cancer Industry Volume (K Unit), by Country 2024 & 2032
- Figure 101: South America Bile Duct Cancer Industry Revenue Share (%), by Country 2024 & 2032
- Figure 102: South America Bile Duct Cancer Industry Volume Share (%), by Country 2024 & 2032
List of Tables
- Table 1: Global Bile Duct Cancer Industry Revenue Million Forecast, by Region 2019 & 2032
- Table 2: Global Bile Duct Cancer Industry Volume K Unit Forecast, by Region 2019 & 2032
- Table 3: Global Bile Duct Cancer Industry Revenue Million Forecast, by Type 2019 & 2032
- Table 4: Global Bile Duct Cancer Industry Volume K Unit Forecast, by Type 2019 & 2032
- Table 5: Global Bile Duct Cancer Industry Revenue Million Forecast, by Therapy 2019 & 2032
- Table 6: Global Bile Duct Cancer Industry Volume K Unit Forecast, by Therapy 2019 & 2032
- Table 7: Global Bile Duct Cancer Industry Revenue Million Forecast, by End-user 2019 & 2032
- Table 8: Global Bile Duct Cancer Industry Volume K Unit Forecast, by End-user 2019 & 2032
- Table 9: Global Bile Duct Cancer Industry Revenue Million Forecast, by Region 2019 & 2032
- Table 10: Global Bile Duct Cancer Industry Volume K Unit Forecast, by Region 2019 & 2032
- Table 11: Global Bile Duct Cancer Industry Revenue Million Forecast, by Country 2019 & 2032
- Table 12: Global Bile Duct Cancer Industry Volume K Unit Forecast, by Country 2019 & 2032
- Table 13: United States Bile Duct Cancer Industry Revenue (Million) Forecast, by Application 2019 & 2032
- Table 14: United States Bile Duct Cancer Industry Volume (K Unit) Forecast, by Application 2019 & 2032
- Table 15: Canada Bile Duct Cancer Industry Revenue (Million) Forecast, by Application 2019 & 2032
- Table 16: Canada Bile Duct Cancer Industry Volume (K Unit) Forecast, by Application 2019 & 2032
- Table 17: Mexico Bile Duct Cancer Industry Revenue (Million) Forecast, by Application 2019 & 2032
- Table 18: Mexico Bile Duct Cancer Industry Volume (K Unit) Forecast, by Application 2019 & 2032
- Table 19: Global Bile Duct Cancer Industry Revenue Million Forecast, by Country 2019 & 2032
- Table 20: Global Bile Duct Cancer Industry Volume K Unit Forecast, by Country 2019 & 2032
- Table 21: Germany Bile Duct Cancer Industry Revenue (Million) Forecast, by Application 2019 & 2032
- Table 22: Germany Bile Duct Cancer Industry Volume (K Unit) Forecast, by Application 2019 & 2032
- Table 23: United Kingdom Bile Duct Cancer Industry Revenue (Million) Forecast, by Application 2019 & 2032
- Table 24: United Kingdom Bile Duct Cancer Industry Volume (K Unit) Forecast, by Application 2019 & 2032
- Table 25: France Bile Duct Cancer Industry Revenue (Million) Forecast, by Application 2019 & 2032
- Table 26: France Bile Duct Cancer Industry Volume (K Unit) Forecast, by Application 2019 & 2032
- Table 27: Italy Bile Duct Cancer Industry Revenue (Million) Forecast, by Application 2019 & 2032
- Table 28: Italy Bile Duct Cancer Industry Volume (K Unit) Forecast, by Application 2019 & 2032
- Table 29: Spain Bile Duct Cancer Industry Revenue (Million) Forecast, by Application 2019 & 2032
- Table 30: Spain Bile Duct Cancer Industry Volume (K Unit) Forecast, by Application 2019 & 2032
- Table 31: Rest of Europe Bile Duct Cancer Industry Revenue (Million) Forecast, by Application 2019 & 2032
- Table 32: Rest of Europe Bile Duct Cancer Industry Volume (K Unit) Forecast, by Application 2019 & 2032
- Table 33: Global Bile Duct Cancer Industry Revenue Million Forecast, by Country 2019 & 2032
- Table 34: Global Bile Duct Cancer Industry Volume K Unit Forecast, by Country 2019 & 2032
- Table 35: China Bile Duct Cancer Industry Revenue (Million) Forecast, by Application 2019 & 2032
- Table 36: China Bile Duct Cancer Industry Volume (K Unit) Forecast, by Application 2019 & 2032
- Table 37: Japan Bile Duct Cancer Industry Revenue (Million) Forecast, by Application 2019 & 2032
- Table 38: Japan Bile Duct Cancer Industry Volume (K Unit) Forecast, by Application 2019 & 2032
- Table 39: India Bile Duct Cancer Industry Revenue (Million) Forecast, by Application 2019 & 2032
- Table 40: India Bile Duct Cancer Industry Volume (K Unit) Forecast, by Application 2019 & 2032
- Table 41: Australia Bile Duct Cancer Industry Revenue (Million) Forecast, by Application 2019 & 2032
- Table 42: Australia Bile Duct Cancer Industry Volume (K Unit) Forecast, by Application 2019 & 2032
- Table 43: South Korea Bile Duct Cancer Industry Revenue (Million) Forecast, by Application 2019 & 2032
- Table 44: South Korea Bile Duct Cancer Industry Volume (K Unit) Forecast, by Application 2019 & 2032
- Table 45: Rest of Asia Pacific Bile Duct Cancer Industry Revenue (Million) Forecast, by Application 2019 & 2032
- Table 46: Rest of Asia Pacific Bile Duct Cancer Industry Volume (K Unit) Forecast, by Application 2019 & 2032
- Table 47: Global Bile Duct Cancer Industry Revenue Million Forecast, by Country 2019 & 2032
- Table 48: Global Bile Duct Cancer Industry Volume K Unit Forecast, by Country 2019 & 2032
- Table 49: GCC Bile Duct Cancer Industry Revenue (Million) Forecast, by Application 2019 & 2032
- Table 50: GCC Bile Duct Cancer Industry Volume (K Unit) Forecast, by Application 2019 & 2032
- Table 51: South Africa Bile Duct Cancer Industry Revenue (Million) Forecast, by Application 2019 & 2032
- Table 52: South Africa Bile Duct Cancer Industry Volume (K Unit) Forecast, by Application 2019 & 2032
- Table 53: Rest of Middle East and Africa Bile Duct Cancer Industry Revenue (Million) Forecast, by Application 2019 & 2032
- Table 54: Rest of Middle East and Africa Bile Duct Cancer Industry Volume (K Unit) Forecast, by Application 2019 & 2032
- Table 55: Global Bile Duct Cancer Industry Revenue Million Forecast, by Country 2019 & 2032
- Table 56: Global Bile Duct Cancer Industry Volume K Unit Forecast, by Country 2019 & 2032
- Table 57: Brazil Bile Duct Cancer Industry Revenue (Million) Forecast, by Application 2019 & 2032
- Table 58: Brazil Bile Duct Cancer Industry Volume (K Unit) Forecast, by Application 2019 & 2032
- Table 59: Argentina Bile Duct Cancer Industry Revenue (Million) Forecast, by Application 2019 & 2032
- Table 60: Argentina Bile Duct Cancer Industry Volume (K Unit) Forecast, by Application 2019 & 2032
- Table 61: Rest of South America Bile Duct Cancer Industry Revenue (Million) Forecast, by Application 2019 & 2032
- Table 62: Rest of South America Bile Duct Cancer Industry Volume (K Unit) Forecast, by Application 2019 & 2032
- Table 63: Global Bile Duct Cancer Industry Revenue Million Forecast, by Type 2019 & 2032
- Table 64: Global Bile Duct Cancer Industry Volume K Unit Forecast, by Type 2019 & 2032
- Table 65: Global Bile Duct Cancer Industry Revenue Million Forecast, by Therapy 2019 & 2032
- Table 66: Global Bile Duct Cancer Industry Volume K Unit Forecast, by Therapy 2019 & 2032
- Table 67: Global Bile Duct Cancer Industry Revenue Million Forecast, by End-user 2019 & 2032
- Table 68: Global Bile Duct Cancer Industry Volume K Unit Forecast, by End-user 2019 & 2032
- Table 69: Global Bile Duct Cancer Industry Revenue Million Forecast, by Country 2019 & 2032
- Table 70: Global Bile Duct Cancer Industry Volume K Unit Forecast, by Country 2019 & 2032
- Table 71: United States Bile Duct Cancer Industry Revenue (Million) Forecast, by Application 2019 & 2032
- Table 72: United States Bile Duct Cancer Industry Volume (K Unit) Forecast, by Application 2019 & 2032
- Table 73: Canada Bile Duct Cancer Industry Revenue (Million) Forecast, by Application 2019 & 2032
- Table 74: Canada Bile Duct Cancer Industry Volume (K Unit) Forecast, by Application 2019 & 2032
- Table 75: Mexico Bile Duct Cancer Industry Revenue (Million) Forecast, by Application 2019 & 2032
- Table 76: Mexico Bile Duct Cancer Industry Volume (K Unit) Forecast, by Application 2019 & 2032
- Table 77: Global Bile Duct Cancer Industry Revenue Million Forecast, by Type 2019 & 2032
- Table 78: Global Bile Duct Cancer Industry Volume K Unit Forecast, by Type 2019 & 2032
- Table 79: Global Bile Duct Cancer Industry Revenue Million Forecast, by Therapy 2019 & 2032
- Table 80: Global Bile Duct Cancer Industry Volume K Unit Forecast, by Therapy 2019 & 2032
- Table 81: Global Bile Duct Cancer Industry Revenue Million Forecast, by End-user 2019 & 2032
- Table 82: Global Bile Duct Cancer Industry Volume K Unit Forecast, by End-user 2019 & 2032
- Table 83: Global Bile Duct Cancer Industry Revenue Million Forecast, by Country 2019 & 2032
- Table 84: Global Bile Duct Cancer Industry Volume K Unit Forecast, by Country 2019 & 2032
- Table 85: Germany Bile Duct Cancer Industry Revenue (Million) Forecast, by Application 2019 & 2032
- Table 86: Germany Bile Duct Cancer Industry Volume (K Unit) Forecast, by Application 2019 & 2032
- Table 87: United Kingdom Bile Duct Cancer Industry Revenue (Million) Forecast, by Application 2019 & 2032
- Table 88: United Kingdom Bile Duct Cancer Industry Volume (K Unit) Forecast, by Application 2019 & 2032
- Table 89: France Bile Duct Cancer Industry Revenue (Million) Forecast, by Application 2019 & 2032
- Table 90: France Bile Duct Cancer Industry Volume (K Unit) Forecast, by Application 2019 & 2032
- Table 91: Italy Bile Duct Cancer Industry Revenue (Million) Forecast, by Application 2019 & 2032
- Table 92: Italy Bile Duct Cancer Industry Volume (K Unit) Forecast, by Application 2019 & 2032
- Table 93: Spain Bile Duct Cancer Industry Revenue (Million) Forecast, by Application 2019 & 2032
- Table 94: Spain Bile Duct Cancer Industry Volume (K Unit) Forecast, by Application 2019 & 2032
- Table 95: Rest of Europe Bile Duct Cancer Industry Revenue (Million) Forecast, by Application 2019 & 2032
- Table 96: Rest of Europe Bile Duct Cancer Industry Volume (K Unit) Forecast, by Application 2019 & 2032
- Table 97: Global Bile Duct Cancer Industry Revenue Million Forecast, by Type 2019 & 2032
- Table 98: Global Bile Duct Cancer Industry Volume K Unit Forecast, by Type 2019 & 2032
- Table 99: Global Bile Duct Cancer Industry Revenue Million Forecast, by Therapy 2019 & 2032
- Table 100: Global Bile Duct Cancer Industry Volume K Unit Forecast, by Therapy 2019 & 2032
- Table 101: Global Bile Duct Cancer Industry Revenue Million Forecast, by End-user 2019 & 2032
- Table 102: Global Bile Duct Cancer Industry Volume K Unit Forecast, by End-user 2019 & 2032
- Table 103: Global Bile Duct Cancer Industry Revenue Million Forecast, by Country 2019 & 2032
- Table 104: Global Bile Duct Cancer Industry Volume K Unit Forecast, by Country 2019 & 2032
- Table 105: China Bile Duct Cancer Industry Revenue (Million) Forecast, by Application 2019 & 2032
- Table 106: China Bile Duct Cancer Industry Volume (K Unit) Forecast, by Application 2019 & 2032
- Table 107: Japan Bile Duct Cancer Industry Revenue (Million) Forecast, by Application 2019 & 2032
- Table 108: Japan Bile Duct Cancer Industry Volume (K Unit) Forecast, by Application 2019 & 2032
- Table 109: India Bile Duct Cancer Industry Revenue (Million) Forecast, by Application 2019 & 2032
- Table 110: India Bile Duct Cancer Industry Volume (K Unit) Forecast, by Application 2019 & 2032
- Table 111: Australia Bile Duct Cancer Industry Revenue (Million) Forecast, by Application 2019 & 2032
- Table 112: Australia Bile Duct Cancer Industry Volume (K Unit) Forecast, by Application 2019 & 2032
- Table 113: South Korea Bile Duct Cancer Industry Revenue (Million) Forecast, by Application 2019 & 2032
- Table 114: South Korea Bile Duct Cancer Industry Volume (K Unit) Forecast, by Application 2019 & 2032
- Table 115: Rest of Asia Pacific Bile Duct Cancer Industry Revenue (Million) Forecast, by Application 2019 & 2032
- Table 116: Rest of Asia Pacific Bile Duct Cancer Industry Volume (K Unit) Forecast, by Application 2019 & 2032
- Table 117: Global Bile Duct Cancer Industry Revenue Million Forecast, by Type 2019 & 2032
- Table 118: Global Bile Duct Cancer Industry Volume K Unit Forecast, by Type 2019 & 2032
- Table 119: Global Bile Duct Cancer Industry Revenue Million Forecast, by Therapy 2019 & 2032
- Table 120: Global Bile Duct Cancer Industry Volume K Unit Forecast, by Therapy 2019 & 2032
- Table 121: Global Bile Duct Cancer Industry Revenue Million Forecast, by End-user 2019 & 2032
- Table 122: Global Bile Duct Cancer Industry Volume K Unit Forecast, by End-user 2019 & 2032
- Table 123: Global Bile Duct Cancer Industry Revenue Million Forecast, by Country 2019 & 2032
- Table 124: Global Bile Duct Cancer Industry Volume K Unit Forecast, by Country 2019 & 2032
- Table 125: GCC Bile Duct Cancer Industry Revenue (Million) Forecast, by Application 2019 & 2032
- Table 126: GCC Bile Duct Cancer Industry Volume (K Unit) Forecast, by Application 2019 & 2032
- Table 127: South Africa Bile Duct Cancer Industry Revenue (Million) Forecast, by Application 2019 & 2032
- Table 128: South Africa Bile Duct Cancer Industry Volume (K Unit) Forecast, by Application 2019 & 2032
- Table 129: Rest of Middle East and Africa Bile Duct Cancer Industry Revenue (Million) Forecast, by Application 2019 & 2032
- Table 130: Rest of Middle East and Africa Bile Duct Cancer Industry Volume (K Unit) Forecast, by Application 2019 & 2032
- Table 131: Global Bile Duct Cancer Industry Revenue Million Forecast, by Type 2019 & 2032
- Table 132: Global Bile Duct Cancer Industry Volume K Unit Forecast, by Type 2019 & 2032
- Table 133: Global Bile Duct Cancer Industry Revenue Million Forecast, by Therapy 2019 & 2032
- Table 134: Global Bile Duct Cancer Industry Volume K Unit Forecast, by Therapy 2019 & 2032
- Table 135: Global Bile Duct Cancer Industry Revenue Million Forecast, by End-user 2019 & 2032
- Table 136: Global Bile Duct Cancer Industry Volume K Unit Forecast, by End-user 2019 & 2032
- Table 137: Global Bile Duct Cancer Industry Revenue Million Forecast, by Country 2019 & 2032
- Table 138: Global Bile Duct Cancer Industry Volume K Unit Forecast, by Country 2019 & 2032
- Table 139: Brazil Bile Duct Cancer Industry Revenue (Million) Forecast, by Application 2019 & 2032
- Table 140: Brazil Bile Duct Cancer Industry Volume (K Unit) Forecast, by Application 2019 & 2032
- Table 141: Argentina Bile Duct Cancer Industry Revenue (Million) Forecast, by Application 2019 & 2032
- Table 142: Argentina Bile Duct Cancer Industry Volume (K Unit) Forecast, by Application 2019 & 2032
- Table 143: Rest of South America Bile Duct Cancer Industry Revenue (Million) Forecast, by Application 2019 & 2032
- Table 144: Rest of South America Bile Duct Cancer Industry Volume (K Unit) Forecast, by Application 2019 & 2032
Frequently Asked Questions
1. What is the projected Compound Annual Growth Rate (CAGR) of the Bile Duct Cancer Industry?
The projected CAGR is approximately 18.76%.
2. Which companies are prominent players in the Bile Duct Cancer Industry?
Key companies in the market include Sanofi SA, Exelixis Inc, Bayer AG, Amgen Inc, Merck & Co Inc, F Hoffmann-La Roche Ltd, AstraZeneca PLC, Eli Lilly and Company, AbbVie Inc, Bristol Myers Squibb Company, Novartis AG, Johnson & Johnson, Eisai Co Ltd, Celsion Corporation, Pfizer Inc.
3. What are the main segments of the Bile Duct Cancer Industry?
The market segments include Type, Therapy, End-user.
4. Can you provide details about the market size?
The market size is estimated to be USD 3.66 Million as of 2022.
5. What are some drivers contributing to market growth?
Rising Burden of Liver Cancer; Increasing R&D Investments for the Development of Novel Therapies; Government Initiatives to Increase the Cancer Awareness.
6. What are the notable trends driving market growth?
Hepatocellular Carcinoma Segment is Expected to Occupy a Significant Share Over the Forecast Period.
7. Are there any restraints impacting market growth?
Side Effects Associated with Certain Medications Coupled with High Cost of Cancer Therapies; Stringent Regulatory Scenario.
8. Can you provide examples of recent developments in the market?
March 2023: The University of Southern California (USC) collaborated with Auransa Inc. on a phase 1 clinical trial to evaluate a new kind of treatment for cancers of the liver and solid tumors with liver-dominant disease. The drug, known as AU409, was developed by Auransa, a clinical-stage drug development company focused on identifying novel drug candidates for oncology, inflammatory diseases, and diseases of the central nervous system.
9. What pricing options are available for accessing the report?
Pricing options include single-user, multi-user, and enterprise licenses priced at USD 4750, USD 5250, and USD 8750 respectively.
10. Is the market size provided in terms of value or volume?
The market size is provided in terms of value, measured in Million and volume, measured in K Unit.
11. Are there any specific market keywords associated with the report?
Yes, the market keyword associated with the report is "Bile Duct Cancer Industry," which aids in identifying and referencing the specific market segment covered.
12. How do I determine which pricing option suits my needs best?
The pricing options vary based on user requirements and access needs. Individual users may opt for single-user licenses, while businesses requiring broader access may choose multi-user or enterprise licenses for cost-effective access to the report.
13. Are there any additional resources or data provided in the Bile Duct Cancer Industry report?
While the report offers comprehensive insights, it's advisable to review the specific contents or supplementary materials provided to ascertain if additional resources or data are available.
14. How can I stay updated on further developments or reports in the Bile Duct Cancer Industry?
To stay informed about further developments, trends, and reports in the Bile Duct Cancer Industry, consider subscribing to industry newsletters, following relevant companies and organizations, or regularly checking reputable industry news sources and publications.
Methodology
Step 1 - Identification of Relevant Samples Size from Population Database


Step 2 - Approaches for Defining Global Market Size (Value, Volume* & Price*)

Note*: In applicable scenarios
Step 3 - Data Sources
Primary Research
- Web Analytics
- Survey Reports
- Research Institute
- Latest Research Reports
- Opinion Leaders
Secondary Research
- Annual Reports
- White Paper
- Latest Press Release
- Industry Association
- Paid Database
- Investor Presentations

Step 4 - Data Triangulation
Involves using different sources of information in order to increase the validity of a study
These sources are likely to be stakeholders in a program - participants, other researchers, program staff, other community members, and so on.
Then we put all data in single framework & apply various statistical tools to find out the dynamic on the market.
During the analysis stage, feedback from the stakeholder groups would be compared to determine areas of agreement as well as areas of divergence


