


Key Insights
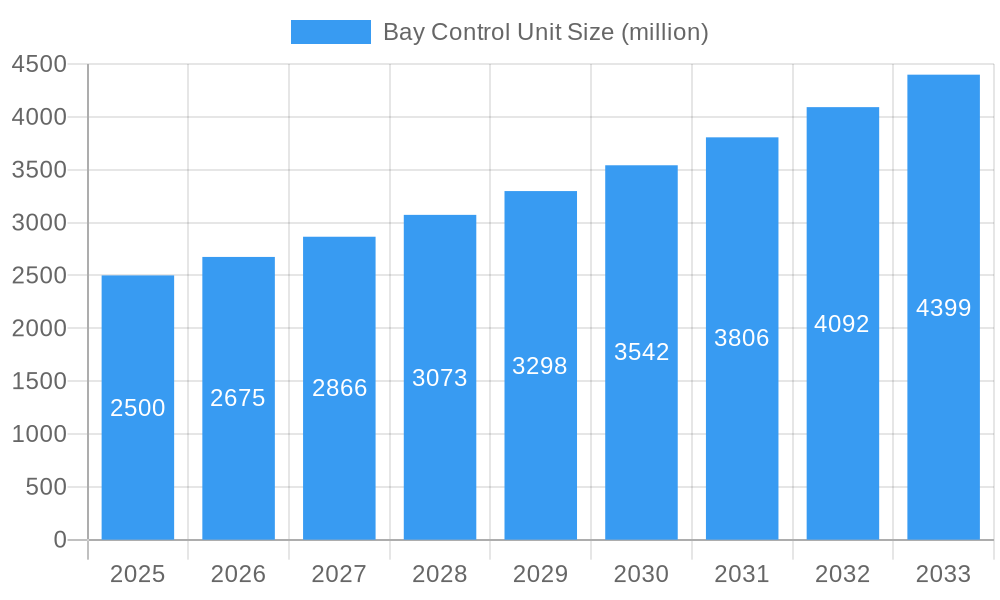
The Bay Control Unit (BCU) market is experiencing robust growth, driven by the increasing demand for efficient and reliable power distribution networks globally. The expanding power generation capacity, particularly in developing economies experiencing rapid industrialization and urbanization, fuels the need for sophisticated BCUs to manage and monitor complex substation operations. Furthermore, the integration of smart grid technologies and the adoption of advanced automation systems are key drivers, enhancing grid stability and enabling remote monitoring and control. The market is segmented by application (substations, power plants, others) and voltage level (medium voltage, high voltage), with substations currently dominating due to their extensive use in power transmission and distribution. High-voltage BCUs hold a significant market share owing to their application in large-scale power transmission projects. While the market faces restraints such as high initial investment costs and the complexity of integration with existing infrastructure, the long-term benefits of improved grid reliability and operational efficiency are outweighing these challenges. We estimate the global BCU market size to be approximately $2.5 billion in 2025, with a Compound Annual Growth Rate (CAGR) of 7% projected through 2033. This growth is fueled by government initiatives promoting grid modernization and renewable energy integration, along with increasing demand for enhanced grid security and resilience.
Bay Control Unit Market Size (In Billion)

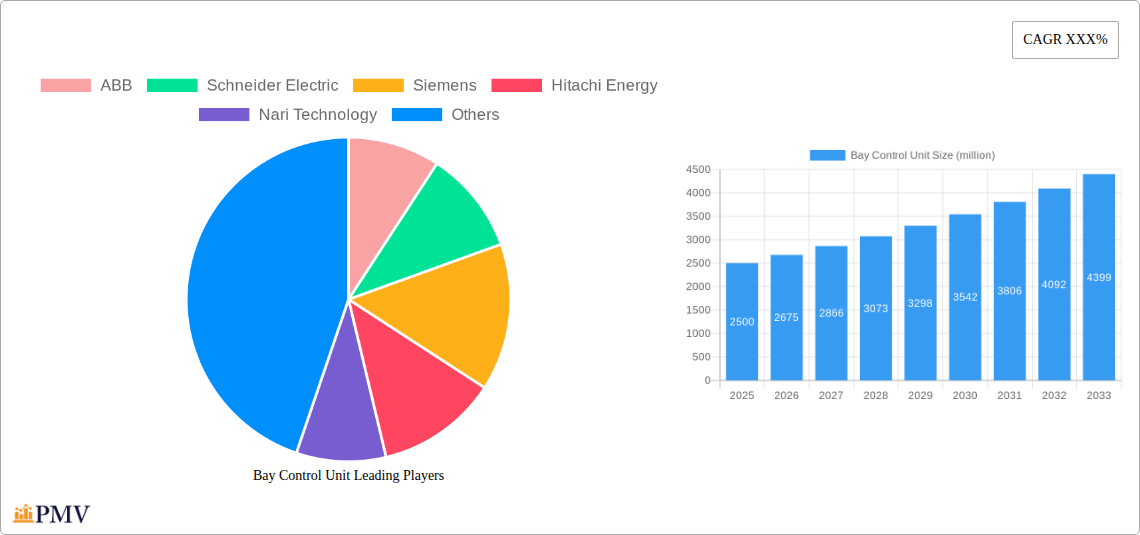
Major players like ABB, Schneider Electric, Siemens, and Hitachi Energy hold significant market share due to their established technological expertise and global presence. However, the market also features several regional players and specialized companies catering to niche applications. Competition is intense, with companies focusing on product innovation, strategic partnerships, and geographical expansion to gain a competitive edge. The North American and European markets currently represent the largest regional segments, driven by advanced grid infrastructure and stringent regulatory frameworks. However, rapid growth is anticipated in the Asia-Pacific region, particularly in countries like China and India, fueled by substantial investments in power infrastructure development. The increasing adoption of digital technologies within BCUs, such as artificial intelligence (AI) and machine learning (ML) for predictive maintenance and optimized grid management, presents a significant opportunity for market expansion in the coming years.
Bay Control Unit Company Market Share
Bay Control Unit Market Report: 2019-2033
This comprehensive report provides a detailed analysis of the global Bay Control Unit market, projecting robust growth from \$xx million in 2025 to \$xx million by 2033, representing a CAGR of xx%. The study period covers 2019-2033, with 2025 as the base and estimated year. This in-depth analysis covers market structure, competitive dynamics, industry trends, dominant segments, product innovations, and future outlooks, providing actionable insights for stakeholders across the power and energy sector.
Bay Control Unit Market Structure & Competitive Dynamics
The global Bay Control Unit market exhibits a moderately concentrated structure, with key players like ABB, Schneider Electric, Siemens, and Hitachi Energy holding significant market share. The combined market share of these top four players is estimated at xx% in 2025. The market is characterized by intense competition driven by technological advancements, increasing demand for smart grids, and stringent regulatory frameworks. Innovation ecosystems are thriving, with companies continuously investing in R&D to develop advanced functionalities, such as improved cybersecurity features and enhanced SCADA integration.
- Market Concentration: High, with top 4 players accounting for xx% of market share in 2025.
- M&A Activities: Significant M&A activity observed in the historical period (2019-2024), with total deal values exceeding \$xx million. These activities primarily aimed at expanding geographic reach and technological capabilities. Examples include [Insert Specific M&A examples, if available, with deal values].
- Regulatory Landscape: Stringent safety and regulatory compliance requirements significantly impact market dynamics, necessitating substantial investments in certifications and compliance-related activities.
- Product Substitutes: Limited direct substitutes exist, however, alternative control systems or decentralized architectures could pose challenges in niche segments.
- End-User Trends: Growing adoption of smart grids and the increasing demand for reliable and efficient power distribution are key drivers of market growth.
Bay Control Unit Industry Trends & Insights
The Bay Control Unit market is experiencing substantial growth, propelled by the global expansion of smart grids, the increasing need for automation in power systems, and the rising adoption of renewable energy sources. Technological disruptions, such as the integration of IoT and AI, are further shaping market dynamics. The market witnessed a CAGR of xx% during the historical period (2019-2024) and is expected to maintain a robust growth trajectory during the forecast period (2025-2033). Market penetration for advanced functionalities like predictive maintenance and remote diagnostics continues to increase, currently at xx% in 2025.
Consumer preferences are increasingly focused on enhanced cybersecurity, improved operational efficiency, and reduced maintenance costs. Competitive dynamics are characterized by a constant push for innovation, partnerships, and strategic alliances to secure a competitive edge in this rapidly evolving landscape.
Dominant Markets & Segments in Bay Control Unit
The Substation application segment dominates the Bay Control Unit market, accounting for xx% of the overall market share in 2025. This dominance is driven by the significant investments in grid modernization and expansion across various regions globally. Geographically, [Insert leading region, e.g., North America] is the leading market, attributed to its robust power infrastructure and ongoing investments in upgrading existing grids.
Key Drivers for Substation Segment Dominance:
- Extensive investments in grid modernization and expansion projects.
- Stringent grid reliability and safety regulations.
- Increasing adoption of smart grid technologies.
Key Drivers for [Leading Region] Market Dominance:
- Robust power infrastructure and continuous expansion projects.
- Favorable government policies and financial incentives.
- High adoption of advanced automation technologies.
The High Voltage segment holds a larger market share compared to Medium Voltage, driven by the increasing need for efficient transmission of large amounts of electricity over long distances. Other application areas, including industrial power distribution, are expected to witness notable growth during the forecast period.
Bay Control Unit Product Innovations
Recent product developments focus on enhanced cybersecurity features, improved integration with SCADA systems, and the incorporation of advanced analytics for predictive maintenance. The integration of IoT and AI capabilities allows for remote monitoring, real-time diagnostics, and optimized operational efficiency. These innovations offer significant competitive advantages by improving reliability, reducing operational costs, and enhancing grid stability.
Report Segmentation & Scope
This report segments the Bay Control Unit market by application (Substation, Power Plant, Others) and type (Medium Voltage, High Voltage). Each segment’s analysis includes historical market size, growth projections, competitive landscape, and key driving forces. The Substation segment is projected to witness the highest CAGR of xx% during the forecast period, primarily driven by increasing grid modernization initiatives. Similarly, the High Voltage segment is anticipated to grow at a robust pace due to the expanding capacity of power transmission networks. The 'Others' application segment encompasses various niche applications and will experience modest growth based on specific regional developments. Growth of each segment will vary depending on investments in renewable energy, aging infrastructure, and stringent regulatory landscape.
Key Drivers of Bay Control Unit Growth
Several factors contribute to the Bay Control Unit market's growth, including the increasing adoption of smart grid technologies, stringent grid reliability standards, the growing demand for automation in power systems, rising investments in renewable energy integration, and supportive government policies focused on infrastructure development. Technological advancements such as AI and IoT are further fueling market expansion by enabling predictive maintenance, real-time monitoring, and improved operational efficiency.
Challenges in the Bay Control Unit Sector
The Bay Control Unit sector faces challenges such as the high initial investment costs for implementing advanced technologies, the complexity of integrating new systems into existing infrastructure, and the need to comply with stringent safety and regulatory standards. Supply chain disruptions can also impact production and delivery timelines, potentially affecting project schedules and budgets. Intense competition among established players and emerging market entrants further complicates the market dynamics. Estimates suggest that supply chain disruptions could reduce the overall market growth by approximately xx% during periods of significant disruption.
Leading Players in the Bay Control Unit Market
- ABB
- Schneider Electric
- Siemens
- Hitachi Energy
- Nari Technology
- SATEC
- Advanio
- SCLE
- Sprecher Automation
- Arcteq
- COL GROUP
- Ingeteam
- ZIV Automation
- Beijing Sifang Automation
Key Developments in Bay Control Unit Sector
- 2022 Q4: ABB launched a new Bay Control Unit with enhanced cybersecurity features.
- 2023 Q1: Siemens and Schneider Electric announced a strategic partnership to integrate their respective Bay Control Units with smart grid platforms.
- 2023 Q3: Hitachi Energy acquired a smaller Bay Control Unit manufacturer, expanding its product portfolio and market reach.
- [Add more key developments with dates, as available]
Strategic Bay Control Unit Market Outlook
The Bay Control Unit market is poised for sustained growth, driven by continued investments in grid modernization, the expansion of smart grids, and the increasing integration of renewable energy sources. Strategic opportunities exist for companies focused on innovation, particularly in the areas of cybersecurity, predictive maintenance, and AI-driven optimization. The market will see a continued shift toward advanced functionalities and increased demand for integrated solutions. Partnerships and strategic alliances will play a crucial role in shaping the competitive landscape and accelerating market growth in the years to come.
Bay Control Unit Segmentation
-
1. Application
- 1.1. Substation
- 1.2. Power Plant
- 1.3. Others
-
2. Type
- 2.1. Medium Voltage
- 2.2. High Voltage
Bay Control Unit Segmentation By Geography
-
1. North America
- 1.1. United States
- 1.2. Canada
- 1.3. Mexico
-
2. South America
- 2.1. Brazil
- 2.2. Argentina
- 2.3. Rest of South America
-
3. Europe
- 3.1. United Kingdom
- 3.2. Germany
- 3.3. France
- 3.4. Italy
- 3.5. Spain
- 3.6. Russia
- 3.7. Benelux
- 3.8. Nordics
- 3.9. Rest of Europe
-
4. Middle East & Africa
- 4.1. Turkey
- 4.2. Israel
- 4.3. GCC
- 4.4. North Africa
- 4.5. South Africa
- 4.6. Rest of Middle East & Africa
-
5. Asia Pacific
- 5.1. China
- 5.2. India
- 5.3. Japan
- 5.4. South Korea
- 5.5. ASEAN
- 5.6. Oceania
- 5.7. Rest of Asia Pacific
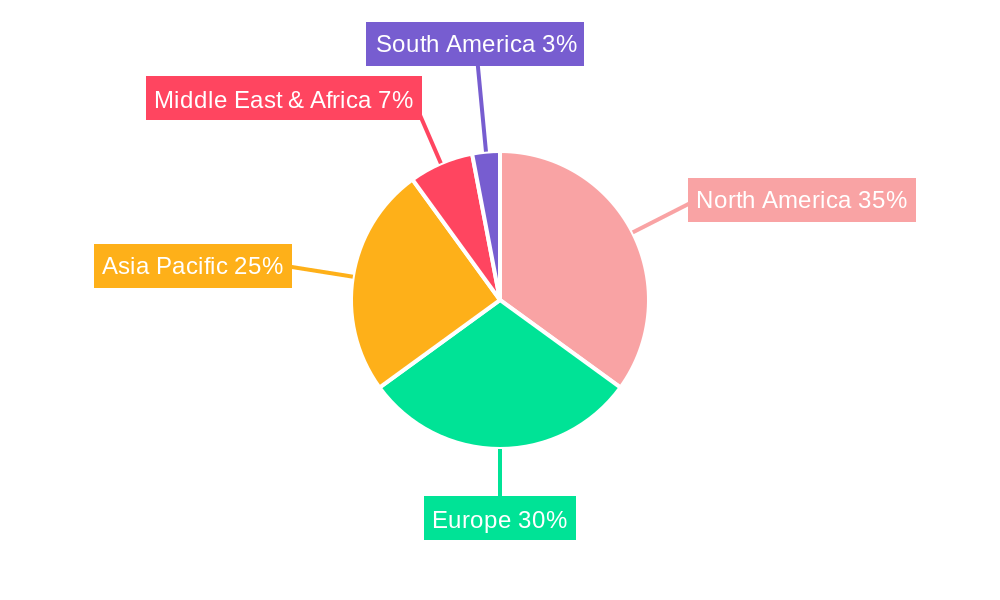
Bay Control Unit Regional Market Share
Geographic Coverage of Bay Control Unit
Bay Control Unit REPORT HIGHLIGHTS
| Aspects | Details |
|---|---|
| Study Period | 2020-2034 |
| Base Year | 2025 |
| Estimated Year | 2026 |
| Forecast Period | 2026-2034 |
| Historical Period | 2020-2025 |
| Growth Rate | CAGR of 13.4% from 2020-2034 |
| Segmentation |
|
Table of Contents
- 1. Introduction
- 1.1. Research Scope
- 1.2. Market Segmentation
- 1.3. Research Methodology
- 1.4. Definitions and Assumptions
- 2. Executive Summary
- 2.1. Introduction
- 3. Market Dynamics
- 3.1. Introduction
- 3.2. Market Drivers
- 3.3. Market Restrains
- 3.4. Market Trends
- 4. Market Factor Analysis
- 4.1. Porters Five Forces
- 4.2. Supply/Value Chain
- 4.3. PESTEL analysis
- 4.4. Market Entropy
- 4.5. Patent/Trademark Analysis
- 5. Global Bay Control Unit Analysis, Insights and Forecast, 2020-2032
- 5.1. Market Analysis, Insights and Forecast - by Application
- 5.1.1. Substation
- 5.1.2. Power Plant
- 5.1.3. Others
- 5.2. Market Analysis, Insights and Forecast - by Type
- 5.2.1. Medium Voltage
- 5.2.2. High Voltage
- 5.3. Market Analysis, Insights and Forecast - by Region
- 5.3.1. North America
- 5.3.2. South America
- 5.3.3. Europe
- 5.3.4. Middle East & Africa
- 5.3.5. Asia Pacific
- 5.1. Market Analysis, Insights and Forecast - by Application
- 6. North America Bay Control Unit Analysis, Insights and Forecast, 2020-2032
- 6.1. Market Analysis, Insights and Forecast - by Application
- 6.1.1. Substation
- 6.1.2. Power Plant
- 6.1.3. Others
- 6.2. Market Analysis, Insights and Forecast - by Type
- 6.2.1. Medium Voltage
- 6.2.2. High Voltage
- 6.1. Market Analysis, Insights and Forecast - by Application
- 7. South America Bay Control Unit Analysis, Insights and Forecast, 2020-2032
- 7.1. Market Analysis, Insights and Forecast - by Application
- 7.1.1. Substation
- 7.1.2. Power Plant
- 7.1.3. Others
- 7.2. Market Analysis, Insights and Forecast - by Type
- 7.2.1. Medium Voltage
- 7.2.2. High Voltage
- 7.1. Market Analysis, Insights and Forecast - by Application
- 8. Europe Bay Control Unit Analysis, Insights and Forecast, 2020-2032
- 8.1. Market Analysis, Insights and Forecast - by Application
- 8.1.1. Substation
- 8.1.2. Power Plant
- 8.1.3. Others
- 8.2. Market Analysis, Insights and Forecast - by Type
- 8.2.1. Medium Voltage
- 8.2.2. High Voltage
- 8.1. Market Analysis, Insights and Forecast - by Application
- 9. Middle East & Africa Bay Control Unit Analysis, Insights and Forecast, 2020-2032
- 9.1. Market Analysis, Insights and Forecast - by Application
- 9.1.1. Substation
- 9.1.2. Power Plant
- 9.1.3. Others
- 9.2. Market Analysis, Insights and Forecast - by Type
- 9.2.1. Medium Voltage
- 9.2.2. High Voltage
- 9.1. Market Analysis, Insights and Forecast - by Application
- 10. Asia Pacific Bay Control Unit Analysis, Insights and Forecast, 2020-2032
- 10.1. Market Analysis, Insights and Forecast - by Application
- 10.1.1. Substation
- 10.1.2. Power Plant
- 10.1.3. Others
- 10.2. Market Analysis, Insights and Forecast - by Type
- 10.2.1. Medium Voltage
- 10.2.2. High Voltage
- 10.1. Market Analysis, Insights and Forecast - by Application
- 11. Competitive Analysis
- 11.1. Global Market Share Analysis 2025
- 11.2. Company Profiles
- 11.2.1 ABB
- 11.2.1.1. Overview
- 11.2.1.2. Products
- 11.2.1.3. SWOT Analysis
- 11.2.1.4. Recent Developments
- 11.2.1.5. Financials (Based on Availability)
- 11.2.2 Schneider Electric
- 11.2.2.1. Overview
- 11.2.2.2. Products
- 11.2.2.3. SWOT Analysis
- 11.2.2.4. Recent Developments
- 11.2.2.5. Financials (Based on Availability)
- 11.2.3 Siemens
- 11.2.3.1. Overview
- 11.2.3.2. Products
- 11.2.3.3. SWOT Analysis
- 11.2.3.4. Recent Developments
- 11.2.3.5. Financials (Based on Availability)
- 11.2.4 Hitachi Energy
- 11.2.4.1. Overview
- 11.2.4.2. Products
- 11.2.4.3. SWOT Analysis
- 11.2.4.4. Recent Developments
- 11.2.4.5. Financials (Based on Availability)
- 11.2.5 Nari Technology
- 11.2.5.1. Overview
- 11.2.5.2. Products
- 11.2.5.3. SWOT Analysis
- 11.2.5.4. Recent Developments
- 11.2.5.5. Financials (Based on Availability)
- 11.2.6 SATEC
- 11.2.6.1. Overview
- 11.2.6.2. Products
- 11.2.6.3. SWOT Analysis
- 11.2.6.4. Recent Developments
- 11.2.6.5. Financials (Based on Availability)
- 11.2.7 Advanio
- 11.2.7.1. Overview
- 11.2.7.2. Products
- 11.2.7.3. SWOT Analysis
- 11.2.7.4. Recent Developments
- 11.2.7.5. Financials (Based on Availability)
- 11.2.8 SCLE
- 11.2.8.1. Overview
- 11.2.8.2. Products
- 11.2.8.3. SWOT Analysis
- 11.2.8.4. Recent Developments
- 11.2.8.5. Financials (Based on Availability)
- 11.2.9 Sprecher Automation
- 11.2.9.1. Overview
- 11.2.9.2. Products
- 11.2.9.3. SWOT Analysis
- 11.2.9.4. Recent Developments
- 11.2.9.5. Financials (Based on Availability)
- 11.2.10 Arcteq
- 11.2.10.1. Overview
- 11.2.10.2. Products
- 11.2.10.3. SWOT Analysis
- 11.2.10.4. Recent Developments
- 11.2.10.5. Financials (Based on Availability)
- 11.2.11 COL GROUP
- 11.2.11.1. Overview
- 11.2.11.2. Products
- 11.2.11.3. SWOT Analysis
- 11.2.11.4. Recent Developments
- 11.2.11.5. Financials (Based on Availability)
- 11.2.12 Ingeteam
- 11.2.12.1. Overview
- 11.2.12.2. Products
- 11.2.12.3. SWOT Analysis
- 11.2.12.4. Recent Developments
- 11.2.12.5. Financials (Based on Availability)
- 11.2.13 ZIV Automation
- 11.2.13.1. Overview
- 11.2.13.2. Products
- 11.2.13.3. SWOT Analysis
- 11.2.13.4. Recent Developments
- 11.2.13.5. Financials (Based on Availability)
- 11.2.14 Beijing Sifang Automation
- 11.2.14.1. Overview
- 11.2.14.2. Products
- 11.2.14.3. SWOT Analysis
- 11.2.14.4. Recent Developments
- 11.2.14.5. Financials (Based on Availability)
- 11.2.1 ABB
List of Figures
- Figure 1: Global Bay Control Unit Revenue Breakdown (undefined, %) by Region 2025 & 2033
- Figure 2: Global Bay Control Unit Volume Breakdown (K, %) by Region 2025 & 2033
- Figure 3: North America Bay Control Unit Revenue (undefined), by Application 2025 & 2033
- Figure 4: North America Bay Control Unit Volume (K), by Application 2025 & 2033
- Figure 5: North America Bay Control Unit Revenue Share (%), by Application 2025 & 2033
- Figure 6: North America Bay Control Unit Volume Share (%), by Application 2025 & 2033
- Figure 7: North America Bay Control Unit Revenue (undefined), by Type 2025 & 2033
- Figure 8: North America Bay Control Unit Volume (K), by Type 2025 & 2033
- Figure 9: North America Bay Control Unit Revenue Share (%), by Type 2025 & 2033
- Figure 10: North America Bay Control Unit Volume Share (%), by Type 2025 & 2033
- Figure 11: North America Bay Control Unit Revenue (undefined), by Country 2025 & 2033
- Figure 12: North America Bay Control Unit Volume (K), by Country 2025 & 2033
- Figure 13: North America Bay Control Unit Revenue Share (%), by Country 2025 & 2033
- Figure 14: North America Bay Control Unit Volume Share (%), by Country 2025 & 2033
- Figure 15: South America Bay Control Unit Revenue (undefined), by Application 2025 & 2033
- Figure 16: South America Bay Control Unit Volume (K), by Application 2025 & 2033
- Figure 17: South America Bay Control Unit Revenue Share (%), by Application 2025 & 2033
- Figure 18: South America Bay Control Unit Volume Share (%), by Application 2025 & 2033
- Figure 19: South America Bay Control Unit Revenue (undefined), by Type 2025 & 2033
- Figure 20: South America Bay Control Unit Volume (K), by Type 2025 & 2033
- Figure 21: South America Bay Control Unit Revenue Share (%), by Type 2025 & 2033
- Figure 22: South America Bay Control Unit Volume Share (%), by Type 2025 & 2033
- Figure 23: South America Bay Control Unit Revenue (undefined), by Country 2025 & 2033
- Figure 24: South America Bay Control Unit Volume (K), by Country 2025 & 2033
- Figure 25: South America Bay Control Unit Revenue Share (%), by Country 2025 & 2033
- Figure 26: South America Bay Control Unit Volume Share (%), by Country 2025 & 2033
- Figure 27: Europe Bay Control Unit Revenue (undefined), by Application 2025 & 2033
- Figure 28: Europe Bay Control Unit Volume (K), by Application 2025 & 2033
- Figure 29: Europe Bay Control Unit Revenue Share (%), by Application 2025 & 2033
- Figure 30: Europe Bay Control Unit Volume Share (%), by Application 2025 & 2033
- Figure 31: Europe Bay Control Unit Revenue (undefined), by Type 2025 & 2033
- Figure 32: Europe Bay Control Unit Volume (K), by Type 2025 & 2033
- Figure 33: Europe Bay Control Unit Revenue Share (%), by Type 2025 & 2033
- Figure 34: Europe Bay Control Unit Volume Share (%), by Type 2025 & 2033
- Figure 35: Europe Bay Control Unit Revenue (undefined), by Country 2025 & 2033
- Figure 36: Europe Bay Control Unit Volume (K), by Country 2025 & 2033
- Figure 37: Europe Bay Control Unit Revenue Share (%), by Country 2025 & 2033
- Figure 38: Europe Bay Control Unit Volume Share (%), by Country 2025 & 2033
- Figure 39: Middle East & Africa Bay Control Unit Revenue (undefined), by Application 2025 & 2033
- Figure 40: Middle East & Africa Bay Control Unit Volume (K), by Application 2025 & 2033
- Figure 41: Middle East & Africa Bay Control Unit Revenue Share (%), by Application 2025 & 2033
- Figure 42: Middle East & Africa Bay Control Unit Volume Share (%), by Application 2025 & 2033
- Figure 43: Middle East & Africa Bay Control Unit Revenue (undefined), by Type 2025 & 2033
- Figure 44: Middle East & Africa Bay Control Unit Volume (K), by Type 2025 & 2033
- Figure 45: Middle East & Africa Bay Control Unit Revenue Share (%), by Type 2025 & 2033
- Figure 46: Middle East & Africa Bay Control Unit Volume Share (%), by Type 2025 & 2033
- Figure 47: Middle East & Africa Bay Control Unit Revenue (undefined), by Country 2025 & 2033
- Figure 48: Middle East & Africa Bay Control Unit Volume (K), by Country 2025 & 2033
- Figure 49: Middle East & Africa Bay Control Unit Revenue Share (%), by Country 2025 & 2033
- Figure 50: Middle East & Africa Bay Control Unit Volume Share (%), by Country 2025 & 2033
- Figure 51: Asia Pacific Bay Control Unit Revenue (undefined), by Application 2025 & 2033
- Figure 52: Asia Pacific Bay Control Unit Volume (K), by Application 2025 & 2033
- Figure 53: Asia Pacific Bay Control Unit Revenue Share (%), by Application 2025 & 2033
- Figure 54: Asia Pacific Bay Control Unit Volume Share (%), by Application 2025 & 2033
- Figure 55: Asia Pacific Bay Control Unit Revenue (undefined), by Type 2025 & 2033
- Figure 56: Asia Pacific Bay Control Unit Volume (K), by Type 2025 & 2033
- Figure 57: Asia Pacific Bay Control Unit Revenue Share (%), by Type 2025 & 2033
- Figure 58: Asia Pacific Bay Control Unit Volume Share (%), by Type 2025 & 2033
- Figure 59: Asia Pacific Bay Control Unit Revenue (undefined), by Country 2025 & 2033
- Figure 60: Asia Pacific Bay Control Unit Volume (K), by Country 2025 & 2033
- Figure 61: Asia Pacific Bay Control Unit Revenue Share (%), by Country 2025 & 2033
- Figure 62: Asia Pacific Bay Control Unit Volume Share (%), by Country 2025 & 2033
List of Tables
- Table 1: Global Bay Control Unit Revenue undefined Forecast, by Application 2020 & 2033
- Table 2: Global Bay Control Unit Volume K Forecast, by Application 2020 & 2033
- Table 3: Global Bay Control Unit Revenue undefined Forecast, by Type 2020 & 2033
- Table 4: Global Bay Control Unit Volume K Forecast, by Type 2020 & 2033
- Table 5: Global Bay Control Unit Revenue undefined Forecast, by Region 2020 & 2033
- Table 6: Global Bay Control Unit Volume K Forecast, by Region 2020 & 2033
- Table 7: Global Bay Control Unit Revenue undefined Forecast, by Application 2020 & 2033
- Table 8: Global Bay Control Unit Volume K Forecast, by Application 2020 & 2033
- Table 9: Global Bay Control Unit Revenue undefined Forecast, by Type 2020 & 2033
- Table 10: Global Bay Control Unit Volume K Forecast, by Type 2020 & 2033
- Table 11: Global Bay Control Unit Revenue undefined Forecast, by Country 2020 & 2033
- Table 12: Global Bay Control Unit Volume K Forecast, by Country 2020 & 2033
- Table 13: United States Bay Control Unit Revenue (undefined) Forecast, by Application 2020 & 2033
- Table 14: United States Bay Control Unit Volume (K) Forecast, by Application 2020 & 2033
- Table 15: Canada Bay Control Unit Revenue (undefined) Forecast, by Application 2020 & 2033
- Table 16: Canada Bay Control Unit Volume (K) Forecast, by Application 2020 & 2033
- Table 17: Mexico Bay Control Unit Revenue (undefined) Forecast, by Application 2020 & 2033
- Table 18: Mexico Bay Control Unit Volume (K) Forecast, by Application 2020 & 2033
- Table 19: Global Bay Control Unit Revenue undefined Forecast, by Application 2020 & 2033
- Table 20: Global Bay Control Unit Volume K Forecast, by Application 2020 & 2033
- Table 21: Global Bay Control Unit Revenue undefined Forecast, by Type 2020 & 2033
- Table 22: Global Bay Control Unit Volume K Forecast, by Type 2020 & 2033
- Table 23: Global Bay Control Unit Revenue undefined Forecast, by Country 2020 & 2033
- Table 24: Global Bay Control Unit Volume K Forecast, by Country 2020 & 2033
- Table 25: Brazil Bay Control Unit Revenue (undefined) Forecast, by Application 2020 & 2033
- Table 26: Brazil Bay Control Unit Volume (K) Forecast, by Application 2020 & 2033
- Table 27: Argentina Bay Control Unit Revenue (undefined) Forecast, by Application 2020 & 2033
- Table 28: Argentina Bay Control Unit Volume (K) Forecast, by Application 2020 & 2033
- Table 29: Rest of South America Bay Control Unit Revenue (undefined) Forecast, by Application 2020 & 2033
- Table 30: Rest of South America Bay Control Unit Volume (K) Forecast, by Application 2020 & 2033
- Table 31: Global Bay Control Unit Revenue undefined Forecast, by Application 2020 & 2033
- Table 32: Global Bay Control Unit Volume K Forecast, by Application 2020 & 2033
- Table 33: Global Bay Control Unit Revenue undefined Forecast, by Type 2020 & 2033
- Table 34: Global Bay Control Unit Volume K Forecast, by Type 2020 & 2033
- Table 35: Global Bay Control Unit Revenue undefined Forecast, by Country 2020 & 2033
- Table 36: Global Bay Control Unit Volume K Forecast, by Country 2020 & 2033
- Table 37: United Kingdom Bay Control Unit Revenue (undefined) Forecast, by Application 2020 & 2033
- Table 38: United Kingdom Bay Control Unit Volume (K) Forecast, by Application 2020 & 2033
- Table 39: Germany Bay Control Unit Revenue (undefined) Forecast, by Application 2020 & 2033
- Table 40: Germany Bay Control Unit Volume (K) Forecast, by Application 2020 & 2033
- Table 41: France Bay Control Unit Revenue (undefined) Forecast, by Application 2020 & 2033
- Table 42: France Bay Control Unit Volume (K) Forecast, by Application 2020 & 2033
- Table 43: Italy Bay Control Unit Revenue (undefined) Forecast, by Application 2020 & 2033
- Table 44: Italy Bay Control Unit Volume (K) Forecast, by Application 2020 & 2033
- Table 45: Spain Bay Control Unit Revenue (undefined) Forecast, by Application 2020 & 2033
- Table 46: Spain Bay Control Unit Volume (K) Forecast, by Application 2020 & 2033
- Table 47: Russia Bay Control Unit Revenue (undefined) Forecast, by Application 2020 & 2033
- Table 48: Russia Bay Control Unit Volume (K) Forecast, by Application 2020 & 2033
- Table 49: Benelux Bay Control Unit Revenue (undefined) Forecast, by Application 2020 & 2033
- Table 50: Benelux Bay Control Unit Volume (K) Forecast, by Application 2020 & 2033
- Table 51: Nordics Bay Control Unit Revenue (undefined) Forecast, by Application 2020 & 2033
- Table 52: Nordics Bay Control Unit Volume (K) Forecast, by Application 2020 & 2033
- Table 53: Rest of Europe Bay Control Unit Revenue (undefined) Forecast, by Application 2020 & 2033
- Table 54: Rest of Europe Bay Control Unit Volume (K) Forecast, by Application 2020 & 2033
- Table 55: Global Bay Control Unit Revenue undefined Forecast, by Application 2020 & 2033
- Table 56: Global Bay Control Unit Volume K Forecast, by Application 2020 & 2033
- Table 57: Global Bay Control Unit Revenue undefined Forecast, by Type 2020 & 2033
- Table 58: Global Bay Control Unit Volume K Forecast, by Type 2020 & 2033
- Table 59: Global Bay Control Unit Revenue undefined Forecast, by Country 2020 & 2033
- Table 60: Global Bay Control Unit Volume K Forecast, by Country 2020 & 2033
- Table 61: Turkey Bay Control Unit Revenue (undefined) Forecast, by Application 2020 & 2033
- Table 62: Turkey Bay Control Unit Volume (K) Forecast, by Application 2020 & 2033
- Table 63: Israel Bay Control Unit Revenue (undefined) Forecast, by Application 2020 & 2033
- Table 64: Israel Bay Control Unit Volume (K) Forecast, by Application 2020 & 2033
- Table 65: GCC Bay Control Unit Revenue (undefined) Forecast, by Application 2020 & 2033
- Table 66: GCC Bay Control Unit Volume (K) Forecast, by Application 2020 & 2033
- Table 67: North Africa Bay Control Unit Revenue (undefined) Forecast, by Application 2020 & 2033
- Table 68: North Africa Bay Control Unit Volume (K) Forecast, by Application 2020 & 2033
- Table 69: South Africa Bay Control Unit Revenue (undefined) Forecast, by Application 2020 & 2033
- Table 70: South Africa Bay Control Unit Volume (K) Forecast, by Application 2020 & 2033
- Table 71: Rest of Middle East & Africa Bay Control Unit Revenue (undefined) Forecast, by Application 2020 & 2033
- Table 72: Rest of Middle East & Africa Bay Control Unit Volume (K) Forecast, by Application 2020 & 2033
- Table 73: Global Bay Control Unit Revenue undefined Forecast, by Application 2020 & 2033
- Table 74: Global Bay Control Unit Volume K Forecast, by Application 2020 & 2033
- Table 75: Global Bay Control Unit Revenue undefined Forecast, by Type 2020 & 2033
- Table 76: Global Bay Control Unit Volume K Forecast, by Type 2020 & 2033
- Table 77: Global Bay Control Unit Revenue undefined Forecast, by Country 2020 & 2033
- Table 78: Global Bay Control Unit Volume K Forecast, by Country 2020 & 2033
- Table 79: China Bay Control Unit Revenue (undefined) Forecast, by Application 2020 & 2033
- Table 80: China Bay Control Unit Volume (K) Forecast, by Application 2020 & 2033
- Table 81: India Bay Control Unit Revenue (undefined) Forecast, by Application 2020 & 2033
- Table 82: India Bay Control Unit Volume (K) Forecast, by Application 2020 & 2033
- Table 83: Japan Bay Control Unit Revenue (undefined) Forecast, by Application 2020 & 2033
- Table 84: Japan Bay Control Unit Volume (K) Forecast, by Application 2020 & 2033
- Table 85: South Korea Bay Control Unit Revenue (undefined) Forecast, by Application 2020 & 2033
- Table 86: South Korea Bay Control Unit Volume (K) Forecast, by Application 2020 & 2033
- Table 87: ASEAN Bay Control Unit Revenue (undefined) Forecast, by Application 2020 & 2033
- Table 88: ASEAN Bay Control Unit Volume (K) Forecast, by Application 2020 & 2033
- Table 89: Oceania Bay Control Unit Revenue (undefined) Forecast, by Application 2020 & 2033
- Table 90: Oceania Bay Control Unit Volume (K) Forecast, by Application 2020 & 2033
- Table 91: Rest of Asia Pacific Bay Control Unit Revenue (undefined) Forecast, by Application 2020 & 2033
- Table 92: Rest of Asia Pacific Bay Control Unit Volume (K) Forecast, by Application 2020 & 2033
Frequently Asked Questions
1. What is the projected Compound Annual Growth Rate (CAGR) of the Bay Control Unit?
The projected CAGR is approximately 13.4%.
2. Which companies are prominent players in the Bay Control Unit?
Key companies in the market include ABB, Schneider Electric, Siemens, Hitachi Energy, Nari Technology, SATEC, Advanio, SCLE, Sprecher Automation, Arcteq, COL GROUP, Ingeteam, ZIV Automation, Beijing Sifang Automation.
3. What are the main segments of the Bay Control Unit?
The market segments include Application, Type.
4. Can you provide details about the market size?
The market size is estimated to be USD XXX N/A as of 2022.
5. What are some drivers contributing to market growth?
N/A
6. What are the notable trends driving market growth?
N/A
7. Are there any restraints impacting market growth?
N/A
8. Can you provide examples of recent developments in the market?
N/A
9. What pricing options are available for accessing the report?
Pricing options include single-user, multi-user, and enterprise licenses priced at USD 3950.00, USD 5925.00, and USD 7900.00 respectively.
10. Is the market size provided in terms of value or volume?
The market size is provided in terms of value, measured in N/A and volume, measured in K.
11. Are there any specific market keywords associated with the report?
Yes, the market keyword associated with the report is "Bay Control Unit," which aids in identifying and referencing the specific market segment covered.
12. How do I determine which pricing option suits my needs best?
The pricing options vary based on user requirements and access needs. Individual users may opt for single-user licenses, while businesses requiring broader access may choose multi-user or enterprise licenses for cost-effective access to the report.
13. Are there any additional resources or data provided in the Bay Control Unit report?
While the report offers comprehensive insights, it's advisable to review the specific contents or supplementary materials provided to ascertain if additional resources or data are available.
14. How can I stay updated on further developments or reports in the Bay Control Unit?
To stay informed about further developments, trends, and reports in the Bay Control Unit, consider subscribing to industry newsletters, following relevant companies and organizations, or regularly checking reputable industry news sources and publications.
Methodology
Step 1 - Identification of Relevant Samples Size from Population Database


Step 2 - Approaches for Defining Global Market Size (Value, Volume* & Price*)

Note*: In applicable scenarios
Step 3 - Data Sources
Primary Research
- Web Analytics
- Survey Reports
- Research Institute
- Latest Research Reports
- Opinion Leaders
Secondary Research
- Annual Reports
- White Paper
- Latest Press Release
- Industry Association
- Paid Database
- Investor Presentations

Step 4 - Data Triangulation
Involves using different sources of information in order to increase the validity of a study
These sources are likely to be stakeholders in a program - participants, other researchers, program staff, other community members, and so on.
Then we put all data in single framework & apply various statistical tools to find out the dynamic on the market.
During the analysis stage, feedback from the stakeholder groups would be compared to determine areas of agreement as well as areas of divergence