
Key Insights
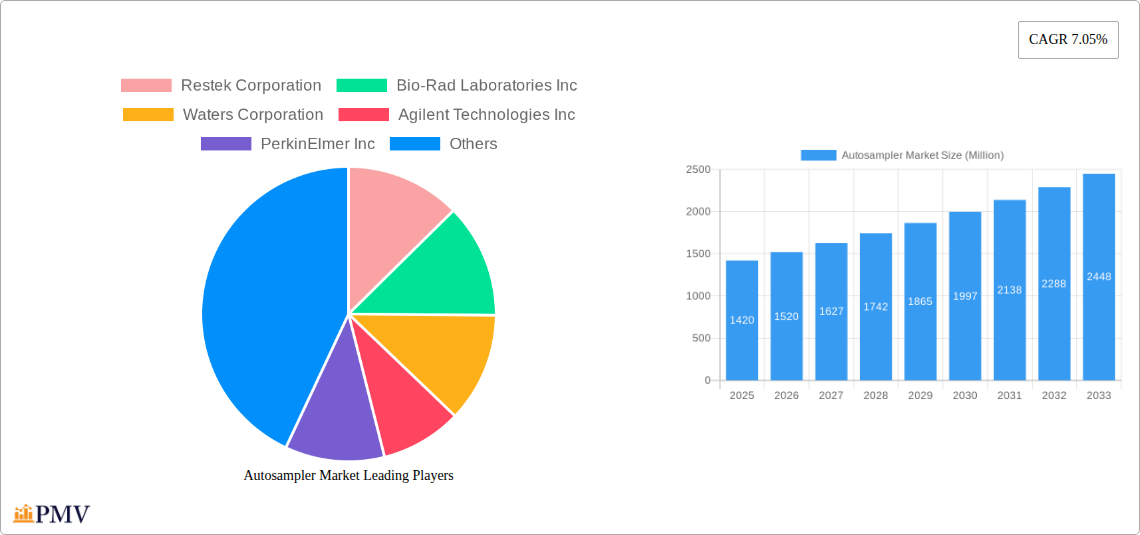
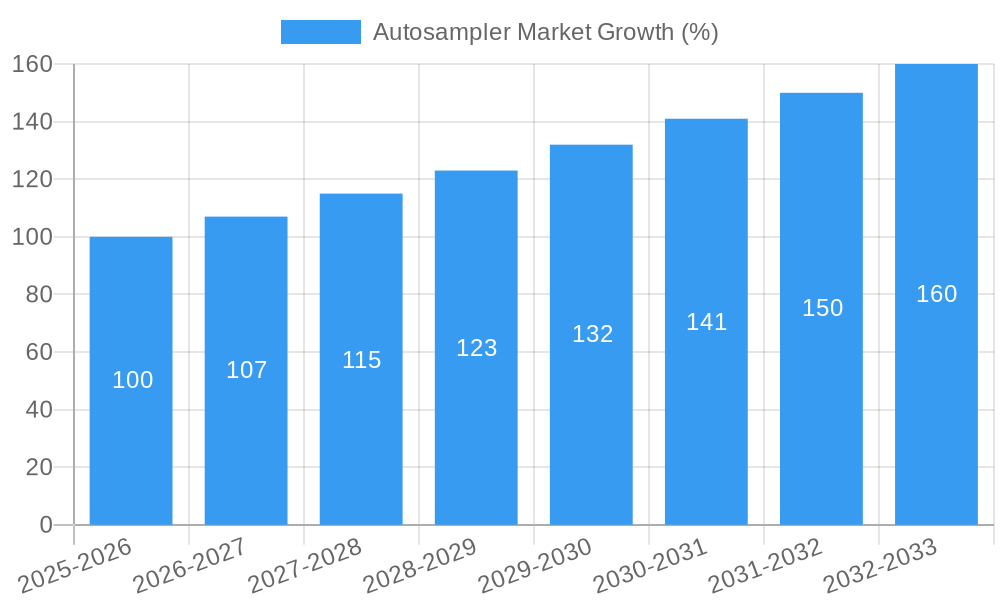
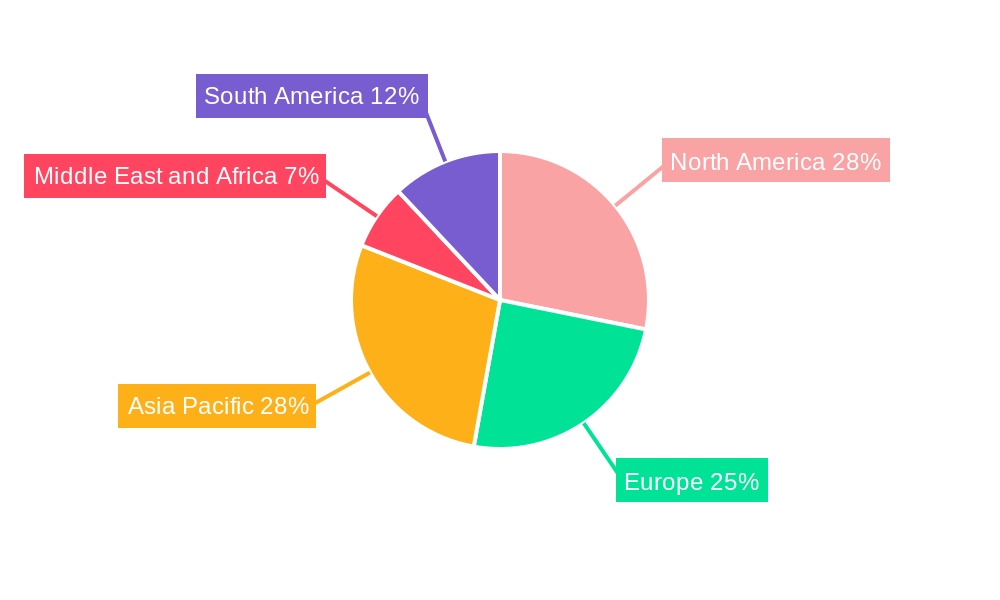
The global autosampler market, valued at $1.42 billion in 2025, is projected to experience robust growth, driven by the increasing adoption of automation in analytical laboratories across diverse sectors. The 7.05% CAGR from 2025 to 2033 indicates a significant expansion, fueled by several key factors. The pharmaceutical and biopharmaceutical industry, a major end-user, is adopting autosamplers extensively for high-throughput screening and quality control processes in drug development and manufacturing. Similarly, the food and beverage industry utilizes autosamplers for efficient quality testing and safety assurance. The growing environmental awareness and stringent regulations related to environmental monitoring are further propelling demand in the environmental testing sector. Technological advancements, such as the integration of advanced software and improved precision, are also contributing to market growth. While the initial investment cost can be a restraint for some smaller laboratories, the long-term benefits of increased efficiency and reduced manual labor outweigh the initial expense. The market is segmented by product type (systems, accessories, gas chromatography autosamplers) and by end-user (pharmaceutical and biopharmaceutical, food and beverage, environmental testing, and others). North America currently holds a significant market share, driven by the presence of major analytical instrument manufacturers and a strong regulatory framework. However, Asia-Pacific is poised for substantial growth, fueled by economic development and increasing investments in research and development.
The competitive landscape is characterized by the presence of established players like Agilent Technologies, Thermo Fisher Scientific, and Waters Corporation, alongside specialized manufacturers such as Restek Corporation and Scion Instruments. These companies are focusing on product innovation, strategic partnerships, and acquisitions to consolidate their market position. Future growth will be influenced by the development of more sophisticated autosamplers with increased throughput, improved precision, and enhanced ease of use. Furthermore, the integration of autosamplers with other analytical instruments and the development of cloud-based data management solutions are expected to shape the market's future trajectory. The continuous need for faster, more reliable, and cost-effective analytical solutions across various industries will further drive the growth of the autosampler market in the coming years.
Autosampler Market: A Comprehensive Report (2019-2033)
This in-depth report provides a comprehensive analysis of the global Autosampler Market, offering valuable insights for stakeholders across the industry. Covering the period from 2019 to 2033, with a focus on 2025, this report meticulously examines market dynamics, competitive landscapes, and future growth potential. The report is designed to empower informed decision-making with actionable insights and detailed forecasts. The global Autosampler Market is estimated to be valued at xx Million in 2025 and is projected to reach xx Million by 2033, exhibiting a CAGR of xx% during the forecast period (2025-2033).
Autosampler Market Market Structure & Competitive Dynamics
The Autosampler Market is characterized by a moderately concentrated structure, with key players holding significant market share. The market is witnessing a surge in innovation, driven by advancements in liquid chromatography (LC) and gas chromatography (GC) technologies. Stringent regulatory frameworks, particularly in the pharmaceutical and environmental sectors, influence product development and market access. Product substitutes are limited, with the primary alternative being manual sample handling, which is significantly less efficient and prone to human error. End-user trends lean towards automation and increased throughput, fueled by growing demand for faster and more precise analytical results. Mergers and acquisitions (M&A) activities are prevalent, with deal values ranging from xx Million to xx Million in recent years, reflecting the strategic importance of this market segment.
- Market Concentration: The top five players hold an estimated xx% market share in 2025.
- Innovation Ecosystems: Significant R&D investments are driving advancements in miniaturization, automation, and integration with other analytical instruments.
- Regulatory Frameworks: Compliance with standards like GMP (Good Manufacturing Practices) and GLP (Good Laboratory Practices) shapes market requirements.
- M&A Activities: Recent years have witnessed several acquisitions, including Bruker Corporation's acquisition of Prolab Instruments GmbH in 2022, signifying consolidation in the sector.
Autosampler Market Industry Trends & Insights
The Autosampler Market is experiencing robust growth, driven by the increasing demand for high-throughput screening in various industries. Technological advancements, including the development of more robust and user-friendly systems, are further fueling market expansion. Consumer preferences are shifting towards automated solutions offering enhanced precision, accuracy, and reduced manual intervention. Competitive dynamics are intensifying, with established players focusing on product innovation and expanding their market reach, while new entrants leverage technological advancements to gain market share. The market penetration of automated sampling systems is steadily increasing across various end-user segments, particularly in the pharmaceutical and environmental testing industries.
- Market Growth Drivers: Rising demand for automation in analytical laboratories, advancements in chromatography techniques, and increasing regulatory scrutiny are key drivers.
- Technological Disruptions: Miniaturization, improved precision, and integration with other analytical platforms are reshaping the competitive landscape.
- Consumer Preferences: Ease of use, enhanced reliability, and reduced operational costs are becoming increasingly important factors influencing purchase decisions.
- Competitive Dynamics: Intense competition is driving innovation, price optimization, and strategic partnerships.
Dominant Markets & Segments in Autosampler Market
The North American region currently holds a dominant position in the global Autosampler Market, driven by a high concentration of pharmaceutical and biotechnology companies, coupled with robust research infrastructure. Within the product segments, systems command a larger market share than accessories. The pharmaceutical and biopharmaceutical industry represents the largest end-user segment.
- Leading Region: North America
- Dominant Product Segment: Systems
- Largest End-User Segment: Pharmaceutical and Biopharmaceutical Companies
Key Drivers for Dominant Segments:
- Pharmaceutical and Biopharmaceutical Companies: Stringent regulatory requirements, high-throughput screening needs, and continuous advancements in drug discovery and development.
- North America: Strong research infrastructure, high adoption of advanced technologies, and a significant presence of major players.
- Systems Segment: Higher value proposition, integrated functionalities, and enhanced automation capabilities.
Autosampler Market Product Innovations
Recent innovations in autosamplers focus on increased throughput, improved sample handling capabilities (e.g., handling viscous samples, minimizing carry-over), enhanced integration with various analytical instruments, and user-friendly software interfaces. These innovations cater to the growing demand for efficient and reliable automation in analytical laboratories across diverse applications, providing significant competitive advantages for manufacturers.
Report Segmentation & Scope
This report segments the Autosampler Market based on product type (Systems and Accessories) and end-user (Pharmaceutical and Biopharmaceutical Companies, Food and Beverage Industry, Environmental Testing Industry, and Others). Each segment's growth projections, market size estimations, and competitive dynamics are thoroughly analyzed. The report projects substantial growth in all segments, with the pharmaceutical sector expected to lead in terms of market size and growth rate throughout the forecast period.
Key Drivers of Autosampler Market Growth
Several factors are contributing to the expansion of the Autosampler Market. Firstly, technological advancements, such as the development of more precise and efficient autosamplers, are increasing demand. Secondly, the rising adoption of automation in various industries for improved throughput and reduced labor costs fuels market growth. Thirdly, stringent regulatory requirements in sectors like pharmaceuticals and environmental testing are driving the demand for reliable and compliant autosampler systems.
Challenges in the Autosampler Market Sector
The Autosampler Market faces certain challenges. High initial investment costs can deter some smaller laboratories from adopting automation. The complexity of these systems may require significant training and expertise, adding to overall costs. Furthermore, supply chain disruptions and potential fluctuations in raw material prices can affect the overall profitability of manufacturers. Intense competition and pricing pressures are further challenges in this market.
Leading Players in the Autosampler Market Market
- Restek Corporation
- Bio-Rad Laboratories Inc
- Waters Corporation
- Agilent Technologies Inc
- PerkinElmer Inc
- Scion Instruments
- Gilson Inc
- Thermo Fisher Scientific
- Shimadzu Corporation
Key Developments in Autosampler Market Sector
- May 2022: Agilent Technologies Inc. collaborated with APC Ltd. to integrate their technologies for automated process analysis via liquid chromatography (LC).
- February 2022: Thermo Scientific launched the SureStart portfolio of chromatography and mass spectrometry consumables, compatible with various autosamplers.
- January 2022: Bruker Corporation acquired Prolab Instruments GmbH, expanding its capabilities in liquid chromatography technology.
Strategic Autosampler Market Market Outlook
The Autosampler Market is poised for continued growth, driven by sustained demand for automation and advancements in analytical techniques. Strategic opportunities exist for companies focusing on innovative product development, expanding into new geographic markets, and establishing strategic partnerships to broaden their market reach. The increasing adoption of automation in emerging economies presents a significant growth potential.
Autosampler Market Segmentation
-
1. Product
-
1.1. Systems
- 1.1.1. Liquid Chromatography Autosamplers
- 1.1.2. Gas Chromatography Autosamplers
- 1.2. Accessories
-
1.1. Systems
-
2. End-User
- 2.1. Pharmaceutical and Biopharmaceutical Companies
- 2.2. Food and Beverage Industry
- 2.3. Environmental Testing Industry
- 2.4. Others
Autosampler Market Segmentation By Geography
-
1. North America
- 1.1. United States
- 1.2. Canada
- 1.3. Mexico
-
2. Europe
- 2.1. Germany
- 2.2. United Kingdom
- 2.3. France
- 2.4. Italy
- 2.5. Spain
- 2.6. Rest of Europe
-
3. Asia Pacific
- 3.1. China
- 3.2. Japan
- 3.3. India
- 3.4. Australia
- 3.5. South Korea
- 3.6. Rest of Asia Pacific
-
4. Middle East and Africa
- 4.1. GCC
- 4.2. South Africa
- 4.3. Rest of Middle East and Africa
-
5. South America
- 5.1. Brazil
- 5.2. Argentina
- 5.3. Rest of South America
Autosampler Market REPORT HIGHLIGHTS
| Aspects | Details |
|---|---|
| Study Period | 2019-2033 |
| Base Year | 2024 |
| Estimated Year | 2025 |
| Forecast Period | 2025-2033 |
| Historical Period | 2019-2024 |
| Growth Rate | CAGR of 7.05% from 2019-2033 |
| Segmentation |
|
Table of Contents
- 1. Introduction
- 1.1. Research Scope
- 1.2. Market Segmentation
- 1.3. Research Methodology
- 1.4. Definitions and Assumptions
- 2. Executive Summary
- 2.1. Introduction
- 3. Market Dynamics
- 3.1. Introduction
- 3.2. Market Drivers
- 3.2.1. Various Advantages of Autosamplers Coupled with Growing Importance of Chromatography in Drug Approval; Increasing Food Safety Concerns
- 3.3. Market Restrains
- 3.3.1. Lack of Skilled Professionals; Limitations in Budget of Small and Mid-Size Market Players
- 3.4. Market Trends
- 3.4.1. Pharmaceutical and Biotechnology Companies are Expected to Witness High Growth Over the Forecast Period
- 4. Market Factor Analysis
- 4.1. Porters Five Forces
- 4.2. Supply/Value Chain
- 4.3. PESTEL analysis
- 4.4. Market Entropy
- 4.5. Patent/Trademark Analysis
- 5. Global Autosampler Market Analysis, Insights and Forecast, 2019-2031
- 5.1. Market Analysis, Insights and Forecast - by Product
- 5.1.1. Systems
- 5.1.1.1. Liquid Chromatography Autosamplers
- 5.1.1.2. Gas Chromatography Autosamplers
- 5.1.2. Accessories
- 5.1.1. Systems
- 5.2. Market Analysis, Insights and Forecast - by End-User
- 5.2.1. Pharmaceutical and Biopharmaceutical Companies
- 5.2.2. Food and Beverage Industry
- 5.2.3. Environmental Testing Industry
- 5.2.4. Others
- 5.3. Market Analysis, Insights and Forecast - by Region
- 5.3.1. North America
- 5.3.2. Europe
- 5.3.3. Asia Pacific
- 5.3.4. Middle East and Africa
- 5.3.5. South America
- 5.1. Market Analysis, Insights and Forecast - by Product
- 6. North America Autosampler Market Analysis, Insights and Forecast, 2019-2031
- 6.1. Market Analysis, Insights and Forecast - by Product
- 6.1.1. Systems
- 6.1.1.1. Liquid Chromatography Autosamplers
- 6.1.1.2. Gas Chromatography Autosamplers
- 6.1.2. Accessories
- 6.1.1. Systems
- 6.2. Market Analysis, Insights and Forecast - by End-User
- 6.2.1. Pharmaceutical and Biopharmaceutical Companies
- 6.2.2. Food and Beverage Industry
- 6.2.3. Environmental Testing Industry
- 6.2.4. Others
- 6.1. Market Analysis, Insights and Forecast - by Product
- 7. Europe Autosampler Market Analysis, Insights and Forecast, 2019-2031
- 7.1. Market Analysis, Insights and Forecast - by Product
- 7.1.1. Systems
- 7.1.1.1. Liquid Chromatography Autosamplers
- 7.1.1.2. Gas Chromatography Autosamplers
- 7.1.2. Accessories
- 7.1.1. Systems
- 7.2. Market Analysis, Insights and Forecast - by End-User
- 7.2.1. Pharmaceutical and Biopharmaceutical Companies
- 7.2.2. Food and Beverage Industry
- 7.2.3. Environmental Testing Industry
- 7.2.4. Others
- 7.1. Market Analysis, Insights and Forecast - by Product
- 8. Asia Pacific Autosampler Market Analysis, Insights and Forecast, 2019-2031
- 8.1. Market Analysis, Insights and Forecast - by Product
- 8.1.1. Systems
- 8.1.1.1. Liquid Chromatography Autosamplers
- 8.1.1.2. Gas Chromatography Autosamplers
- 8.1.2. Accessories
- 8.1.1. Systems
- 8.2. Market Analysis, Insights and Forecast - by End-User
- 8.2.1. Pharmaceutical and Biopharmaceutical Companies
- 8.2.2. Food and Beverage Industry
- 8.2.3. Environmental Testing Industry
- 8.2.4. Others
- 8.1. Market Analysis, Insights and Forecast - by Product
- 9. Middle East and Africa Autosampler Market Analysis, Insights and Forecast, 2019-2031
- 9.1. Market Analysis, Insights and Forecast - by Product
- 9.1.1. Systems
- 9.1.1.1. Liquid Chromatography Autosamplers
- 9.1.1.2. Gas Chromatography Autosamplers
- 9.1.2. Accessories
- 9.1.1. Systems
- 9.2. Market Analysis, Insights and Forecast - by End-User
- 9.2.1. Pharmaceutical and Biopharmaceutical Companies
- 9.2.2. Food and Beverage Industry
- 9.2.3. Environmental Testing Industry
- 9.2.4. Others
- 9.1. Market Analysis, Insights and Forecast - by Product
- 10. South America Autosampler Market Analysis, Insights and Forecast, 2019-2031
- 10.1. Market Analysis, Insights and Forecast - by Product
- 10.1.1. Systems
- 10.1.1.1. Liquid Chromatography Autosamplers
- 10.1.1.2. Gas Chromatography Autosamplers
- 10.1.2. Accessories
- 10.1.1. Systems
- 10.2. Market Analysis, Insights and Forecast - by End-User
- 10.2.1. Pharmaceutical and Biopharmaceutical Companies
- 10.2.2. Food and Beverage Industry
- 10.2.3. Environmental Testing Industry
- 10.2.4. Others
- 10.1. Market Analysis, Insights and Forecast - by Product
- 11. North America Autosampler Market Analysis, Insights and Forecast, 2019-2031
- 11.1. Market Analysis, Insights and Forecast - By Country/Sub-region
- 11.1.1 United States
- 11.1.2 Canada
- 11.1.3 Mexico
- 12. Europe Autosampler Market Analysis, Insights and Forecast, 2019-2031
- 12.1. Market Analysis, Insights and Forecast - By Country/Sub-region
- 12.1.1 Germany
- 12.1.2 United Kingdom
- 12.1.3 France
- 12.1.4 Italy
- 12.1.5 Spain
- 12.1.6 Rest of Europe
- 13. Asia Pacific Autosampler Market Analysis, Insights and Forecast, 2019-2031
- 13.1. Market Analysis, Insights and Forecast - By Country/Sub-region
- 13.1.1 China
- 13.1.2 Japan
- 13.1.3 India
- 13.1.4 Australia
- 13.1.5 South Korea
- 13.1.6 Rest of Asia Pacific
- 14. Middle East and Africa Autosampler Market Analysis, Insights and Forecast, 2019-2031
- 14.1. Market Analysis, Insights and Forecast - By Country/Sub-region
- 14.1.1 GCC
- 14.1.2 South Africa
- 14.1.3 Rest of Middle East and Africa
- 15. South America Autosampler Market Analysis, Insights and Forecast, 2019-2031
- 15.1. Market Analysis, Insights and Forecast - By Country/Sub-region
- 15.1.1 Brazil
- 15.1.2 Argentina
- 15.1.3 Rest of South America
- 16. Competitive Analysis
- 16.1. Global Market Share Analysis 2024
- 16.2. Company Profiles
- 16.2.1 Restek Corporation
- 16.2.1.1. Overview
- 16.2.1.2. Products
- 16.2.1.3. SWOT Analysis
- 16.2.1.4. Recent Developments
- 16.2.1.5. Financials (Based on Availability)
- 16.2.2 Bio-Rad Laboratories Inc
- 16.2.2.1. Overview
- 16.2.2.2. Products
- 16.2.2.3. SWOT Analysis
- 16.2.2.4. Recent Developments
- 16.2.2.5. Financials (Based on Availability)
- 16.2.3 Waters Corporation
- 16.2.3.1. Overview
- 16.2.3.2. Products
- 16.2.3.3. SWOT Analysis
- 16.2.3.4. Recent Developments
- 16.2.3.5. Financials (Based on Availability)
- 16.2.4 Agilent Technologies Inc
- 16.2.4.1. Overview
- 16.2.4.2. Products
- 16.2.4.3. SWOT Analysis
- 16.2.4.4. Recent Developments
- 16.2.4.5. Financials (Based on Availability)
- 16.2.5 PerkinElmer Inc
- 16.2.5.1. Overview
- 16.2.5.2. Products
- 16.2.5.3. SWOT Analysis
- 16.2.5.4. Recent Developments
- 16.2.5.5. Financials (Based on Availability)
- 16.2.6 Scion Instruments
- 16.2.6.1. Overview
- 16.2.6.2. Products
- 16.2.6.3. SWOT Analysis
- 16.2.6.4. Recent Developments
- 16.2.6.5. Financials (Based on Availability)
- 16.2.7 Gilson Inc
- 16.2.7.1. Overview
- 16.2.7.2. Products
- 16.2.7.3. SWOT Analysis
- 16.2.7.4. Recent Developments
- 16.2.7.5. Financials (Based on Availability)
- 16.2.8 Thermo Fisher Scientific
- 16.2.8.1. Overview
- 16.2.8.2. Products
- 16.2.8.3. SWOT Analysis
- 16.2.8.4. Recent Developments
- 16.2.8.5. Financials (Based on Availability)
- 16.2.9 Shimadzu Corporation
- 16.2.9.1. Overview
- 16.2.9.2. Products
- 16.2.9.3. SWOT Analysis
- 16.2.9.4. Recent Developments
- 16.2.9.5. Financials (Based on Availability)
- 16.2.1 Restek Corporation
List of Figures
- Figure 1: Global Autosampler Market Revenue Breakdown (Million, %) by Region 2024 & 2032
- Figure 2: Global Autosampler Market Volume Breakdown (K Unit, %) by Region 2024 & 2032
- Figure 3: North America Autosampler Market Revenue (Million), by Country 2024 & 2032
- Figure 4: North America Autosampler Market Volume (K Unit), by Country 2024 & 2032
- Figure 5: North America Autosampler Market Revenue Share (%), by Country 2024 & 2032
- Figure 6: North America Autosampler Market Volume Share (%), by Country 2024 & 2032
- Figure 7: Europe Autosampler Market Revenue (Million), by Country 2024 & 2032
- Figure 8: Europe Autosampler Market Volume (K Unit), by Country 2024 & 2032
- Figure 9: Europe Autosampler Market Revenue Share (%), by Country 2024 & 2032
- Figure 10: Europe Autosampler Market Volume Share (%), by Country 2024 & 2032
- Figure 11: Asia Pacific Autosampler Market Revenue (Million), by Country 2024 & 2032
- Figure 12: Asia Pacific Autosampler Market Volume (K Unit), by Country 2024 & 2032
- Figure 13: Asia Pacific Autosampler Market Revenue Share (%), by Country 2024 & 2032
- Figure 14: Asia Pacific Autosampler Market Volume Share (%), by Country 2024 & 2032
- Figure 15: Middle East and Africa Autosampler Market Revenue (Million), by Country 2024 & 2032
- Figure 16: Middle East and Africa Autosampler Market Volume (K Unit), by Country 2024 & 2032
- Figure 17: Middle East and Africa Autosampler Market Revenue Share (%), by Country 2024 & 2032
- Figure 18: Middle East and Africa Autosampler Market Volume Share (%), by Country 2024 & 2032
- Figure 19: South America Autosampler Market Revenue (Million), by Country 2024 & 2032
- Figure 20: South America Autosampler Market Volume (K Unit), by Country 2024 & 2032
- Figure 21: South America Autosampler Market Revenue Share (%), by Country 2024 & 2032
- Figure 22: South America Autosampler Market Volume Share (%), by Country 2024 & 2032
- Figure 23: North America Autosampler Market Revenue (Million), by Product 2024 & 2032
- Figure 24: North America Autosampler Market Volume (K Unit), by Product 2024 & 2032
- Figure 25: North America Autosampler Market Revenue Share (%), by Product 2024 & 2032
- Figure 26: North America Autosampler Market Volume Share (%), by Product 2024 & 2032
- Figure 27: North America Autosampler Market Revenue (Million), by End-User 2024 & 2032
- Figure 28: North America Autosampler Market Volume (K Unit), by End-User 2024 & 2032
- Figure 29: North America Autosampler Market Revenue Share (%), by End-User 2024 & 2032
- Figure 30: North America Autosampler Market Volume Share (%), by End-User 2024 & 2032
- Figure 31: North America Autosampler Market Revenue (Million), by Country 2024 & 2032
- Figure 32: North America Autosampler Market Volume (K Unit), by Country 2024 & 2032
- Figure 33: North America Autosampler Market Revenue Share (%), by Country 2024 & 2032
- Figure 34: North America Autosampler Market Volume Share (%), by Country 2024 & 2032
- Figure 35: Europe Autosampler Market Revenue (Million), by Product 2024 & 2032
- Figure 36: Europe Autosampler Market Volume (K Unit), by Product 2024 & 2032
- Figure 37: Europe Autosampler Market Revenue Share (%), by Product 2024 & 2032
- Figure 38: Europe Autosampler Market Volume Share (%), by Product 2024 & 2032
- Figure 39: Europe Autosampler Market Revenue (Million), by End-User 2024 & 2032
- Figure 40: Europe Autosampler Market Volume (K Unit), by End-User 2024 & 2032
- Figure 41: Europe Autosampler Market Revenue Share (%), by End-User 2024 & 2032
- Figure 42: Europe Autosampler Market Volume Share (%), by End-User 2024 & 2032
- Figure 43: Europe Autosampler Market Revenue (Million), by Country 2024 & 2032
- Figure 44: Europe Autosampler Market Volume (K Unit), by Country 2024 & 2032
- Figure 45: Europe Autosampler Market Revenue Share (%), by Country 2024 & 2032
- Figure 46: Europe Autosampler Market Volume Share (%), by Country 2024 & 2032
- Figure 47: Asia Pacific Autosampler Market Revenue (Million), by Product 2024 & 2032
- Figure 48: Asia Pacific Autosampler Market Volume (K Unit), by Product 2024 & 2032
- Figure 49: Asia Pacific Autosampler Market Revenue Share (%), by Product 2024 & 2032
- Figure 50: Asia Pacific Autosampler Market Volume Share (%), by Product 2024 & 2032
- Figure 51: Asia Pacific Autosampler Market Revenue (Million), by End-User 2024 & 2032
- Figure 52: Asia Pacific Autosampler Market Volume (K Unit), by End-User 2024 & 2032
- Figure 53: Asia Pacific Autosampler Market Revenue Share (%), by End-User 2024 & 2032
- Figure 54: Asia Pacific Autosampler Market Volume Share (%), by End-User 2024 & 2032
- Figure 55: Asia Pacific Autosampler Market Revenue (Million), by Country 2024 & 2032
- Figure 56: Asia Pacific Autosampler Market Volume (K Unit), by Country 2024 & 2032
- Figure 57: Asia Pacific Autosampler Market Revenue Share (%), by Country 2024 & 2032
- Figure 58: Asia Pacific Autosampler Market Volume Share (%), by Country 2024 & 2032
- Figure 59: Middle East and Africa Autosampler Market Revenue (Million), by Product 2024 & 2032
- Figure 60: Middle East and Africa Autosampler Market Volume (K Unit), by Product 2024 & 2032
- Figure 61: Middle East and Africa Autosampler Market Revenue Share (%), by Product 2024 & 2032
- Figure 62: Middle East and Africa Autosampler Market Volume Share (%), by Product 2024 & 2032
- Figure 63: Middle East and Africa Autosampler Market Revenue (Million), by End-User 2024 & 2032
- Figure 64: Middle East and Africa Autosampler Market Volume (K Unit), by End-User 2024 & 2032
- Figure 65: Middle East and Africa Autosampler Market Revenue Share (%), by End-User 2024 & 2032
- Figure 66: Middle East and Africa Autosampler Market Volume Share (%), by End-User 2024 & 2032
- Figure 67: Middle East and Africa Autosampler Market Revenue (Million), by Country 2024 & 2032
- Figure 68: Middle East and Africa Autosampler Market Volume (K Unit), by Country 2024 & 2032
- Figure 69: Middle East and Africa Autosampler Market Revenue Share (%), by Country 2024 & 2032
- Figure 70: Middle East and Africa Autosampler Market Volume Share (%), by Country 2024 & 2032
- Figure 71: South America Autosampler Market Revenue (Million), by Product 2024 & 2032
- Figure 72: South America Autosampler Market Volume (K Unit), by Product 2024 & 2032
- Figure 73: South America Autosampler Market Revenue Share (%), by Product 2024 & 2032
- Figure 74: South America Autosampler Market Volume Share (%), by Product 2024 & 2032
- Figure 75: South America Autosampler Market Revenue (Million), by End-User 2024 & 2032
- Figure 76: South America Autosampler Market Volume (K Unit), by End-User 2024 & 2032
- Figure 77: South America Autosampler Market Revenue Share (%), by End-User 2024 & 2032
- Figure 78: South America Autosampler Market Volume Share (%), by End-User 2024 & 2032
- Figure 79: South America Autosampler Market Revenue (Million), by Country 2024 & 2032
- Figure 80: South America Autosampler Market Volume (K Unit), by Country 2024 & 2032
- Figure 81: South America Autosampler Market Revenue Share (%), by Country 2024 & 2032
- Figure 82: South America Autosampler Market Volume Share (%), by Country 2024 & 2032
List of Tables
- Table 1: Global Autosampler Market Revenue Million Forecast, by Region 2019 & 2032
- Table 2: Global Autosampler Market Volume K Unit Forecast, by Region 2019 & 2032
- Table 3: Global Autosampler Market Revenue Million Forecast, by Product 2019 & 2032
- Table 4: Global Autosampler Market Volume K Unit Forecast, by Product 2019 & 2032
- Table 5: Global Autosampler Market Revenue Million Forecast, by End-User 2019 & 2032
- Table 6: Global Autosampler Market Volume K Unit Forecast, by End-User 2019 & 2032
- Table 7: Global Autosampler Market Revenue Million Forecast, by Region 2019 & 2032
- Table 8: Global Autosampler Market Volume K Unit Forecast, by Region 2019 & 2032
- Table 9: Global Autosampler Market Revenue Million Forecast, by Country 2019 & 2032
- Table 10: Global Autosampler Market Volume K Unit Forecast, by Country 2019 & 2032
- Table 11: United States Autosampler Market Revenue (Million) Forecast, by Application 2019 & 2032
- Table 12: United States Autosampler Market Volume (K Unit) Forecast, by Application 2019 & 2032
- Table 13: Canada Autosampler Market Revenue (Million) Forecast, by Application 2019 & 2032
- Table 14: Canada Autosampler Market Volume (K Unit) Forecast, by Application 2019 & 2032
- Table 15: Mexico Autosampler Market Revenue (Million) Forecast, by Application 2019 & 2032
- Table 16: Mexico Autosampler Market Volume (K Unit) Forecast, by Application 2019 & 2032
- Table 17: Global Autosampler Market Revenue Million Forecast, by Country 2019 & 2032
- Table 18: Global Autosampler Market Volume K Unit Forecast, by Country 2019 & 2032
- Table 19: Germany Autosampler Market Revenue (Million) Forecast, by Application 2019 & 2032
- Table 20: Germany Autosampler Market Volume (K Unit) Forecast, by Application 2019 & 2032
- Table 21: United Kingdom Autosampler Market Revenue (Million) Forecast, by Application 2019 & 2032
- Table 22: United Kingdom Autosampler Market Volume (K Unit) Forecast, by Application 2019 & 2032
- Table 23: France Autosampler Market Revenue (Million) Forecast, by Application 2019 & 2032
- Table 24: France Autosampler Market Volume (K Unit) Forecast, by Application 2019 & 2032
- Table 25: Italy Autosampler Market Revenue (Million) Forecast, by Application 2019 & 2032
- Table 26: Italy Autosampler Market Volume (K Unit) Forecast, by Application 2019 & 2032
- Table 27: Spain Autosampler Market Revenue (Million) Forecast, by Application 2019 & 2032
- Table 28: Spain Autosampler Market Volume (K Unit) Forecast, by Application 2019 & 2032
- Table 29: Rest of Europe Autosampler Market Revenue (Million) Forecast, by Application 2019 & 2032
- Table 30: Rest of Europe Autosampler Market Volume (K Unit) Forecast, by Application 2019 & 2032
- Table 31: Global Autosampler Market Revenue Million Forecast, by Country 2019 & 2032
- Table 32: Global Autosampler Market Volume K Unit Forecast, by Country 2019 & 2032
- Table 33: China Autosampler Market Revenue (Million) Forecast, by Application 2019 & 2032
- Table 34: China Autosampler Market Volume (K Unit) Forecast, by Application 2019 & 2032
- Table 35: Japan Autosampler Market Revenue (Million) Forecast, by Application 2019 & 2032
- Table 36: Japan Autosampler Market Volume (K Unit) Forecast, by Application 2019 & 2032
- Table 37: India Autosampler Market Revenue (Million) Forecast, by Application 2019 & 2032
- Table 38: India Autosampler Market Volume (K Unit) Forecast, by Application 2019 & 2032
- Table 39: Australia Autosampler Market Revenue (Million) Forecast, by Application 2019 & 2032
- Table 40: Australia Autosampler Market Volume (K Unit) Forecast, by Application 2019 & 2032
- Table 41: South Korea Autosampler Market Revenue (Million) Forecast, by Application 2019 & 2032
- Table 42: South Korea Autosampler Market Volume (K Unit) Forecast, by Application 2019 & 2032
- Table 43: Rest of Asia Pacific Autosampler Market Revenue (Million) Forecast, by Application 2019 & 2032
- Table 44: Rest of Asia Pacific Autosampler Market Volume (K Unit) Forecast, by Application 2019 & 2032
- Table 45: Global Autosampler Market Revenue Million Forecast, by Country 2019 & 2032
- Table 46: Global Autosampler Market Volume K Unit Forecast, by Country 2019 & 2032
- Table 47: GCC Autosampler Market Revenue (Million) Forecast, by Application 2019 & 2032
- Table 48: GCC Autosampler Market Volume (K Unit) Forecast, by Application 2019 & 2032
- Table 49: South Africa Autosampler Market Revenue (Million) Forecast, by Application 2019 & 2032
- Table 50: South Africa Autosampler Market Volume (K Unit) Forecast, by Application 2019 & 2032
- Table 51: Rest of Middle East and Africa Autosampler Market Revenue (Million) Forecast, by Application 2019 & 2032
- Table 52: Rest of Middle East and Africa Autosampler Market Volume (K Unit) Forecast, by Application 2019 & 2032
- Table 53: Global Autosampler Market Revenue Million Forecast, by Country 2019 & 2032
- Table 54: Global Autosampler Market Volume K Unit Forecast, by Country 2019 & 2032
- Table 55: Brazil Autosampler Market Revenue (Million) Forecast, by Application 2019 & 2032
- Table 56: Brazil Autosampler Market Volume (K Unit) Forecast, by Application 2019 & 2032
- Table 57: Argentina Autosampler Market Revenue (Million) Forecast, by Application 2019 & 2032
- Table 58: Argentina Autosampler Market Volume (K Unit) Forecast, by Application 2019 & 2032
- Table 59: Rest of South America Autosampler Market Revenue (Million) Forecast, by Application 2019 & 2032
- Table 60: Rest of South America Autosampler Market Volume (K Unit) Forecast, by Application 2019 & 2032
- Table 61: Global Autosampler Market Revenue Million Forecast, by Product 2019 & 2032
- Table 62: Global Autosampler Market Volume K Unit Forecast, by Product 2019 & 2032
- Table 63: Global Autosampler Market Revenue Million Forecast, by End-User 2019 & 2032
- Table 64: Global Autosampler Market Volume K Unit Forecast, by End-User 2019 & 2032
- Table 65: Global Autosampler Market Revenue Million Forecast, by Country 2019 & 2032
- Table 66: Global Autosampler Market Volume K Unit Forecast, by Country 2019 & 2032
- Table 67: United States Autosampler Market Revenue (Million) Forecast, by Application 2019 & 2032
- Table 68: United States Autosampler Market Volume (K Unit) Forecast, by Application 2019 & 2032
- Table 69: Canada Autosampler Market Revenue (Million) Forecast, by Application 2019 & 2032
- Table 70: Canada Autosampler Market Volume (K Unit) Forecast, by Application 2019 & 2032
- Table 71: Mexico Autosampler Market Revenue (Million) Forecast, by Application 2019 & 2032
- Table 72: Mexico Autosampler Market Volume (K Unit) Forecast, by Application 2019 & 2032
- Table 73: Global Autosampler Market Revenue Million Forecast, by Product 2019 & 2032
- Table 74: Global Autosampler Market Volume K Unit Forecast, by Product 2019 & 2032
- Table 75: Global Autosampler Market Revenue Million Forecast, by End-User 2019 & 2032
- Table 76: Global Autosampler Market Volume K Unit Forecast, by End-User 2019 & 2032
- Table 77: Global Autosampler Market Revenue Million Forecast, by Country 2019 & 2032
- Table 78: Global Autosampler Market Volume K Unit Forecast, by Country 2019 & 2032
- Table 79: Germany Autosampler Market Revenue (Million) Forecast, by Application 2019 & 2032
- Table 80: Germany Autosampler Market Volume (K Unit) Forecast, by Application 2019 & 2032
- Table 81: United Kingdom Autosampler Market Revenue (Million) Forecast, by Application 2019 & 2032
- Table 82: United Kingdom Autosampler Market Volume (K Unit) Forecast, by Application 2019 & 2032
- Table 83: France Autosampler Market Revenue (Million) Forecast, by Application 2019 & 2032
- Table 84: France Autosampler Market Volume (K Unit) Forecast, by Application 2019 & 2032
- Table 85: Italy Autosampler Market Revenue (Million) Forecast, by Application 2019 & 2032
- Table 86: Italy Autosampler Market Volume (K Unit) Forecast, by Application 2019 & 2032
- Table 87: Spain Autosampler Market Revenue (Million) Forecast, by Application 2019 & 2032
- Table 88: Spain Autosampler Market Volume (K Unit) Forecast, by Application 2019 & 2032
- Table 89: Rest of Europe Autosampler Market Revenue (Million) Forecast, by Application 2019 & 2032
- Table 90: Rest of Europe Autosampler Market Volume (K Unit) Forecast, by Application 2019 & 2032
- Table 91: Global Autosampler Market Revenue Million Forecast, by Product 2019 & 2032
- Table 92: Global Autosampler Market Volume K Unit Forecast, by Product 2019 & 2032
- Table 93: Global Autosampler Market Revenue Million Forecast, by End-User 2019 & 2032
- Table 94: Global Autosampler Market Volume K Unit Forecast, by End-User 2019 & 2032
- Table 95: Global Autosampler Market Revenue Million Forecast, by Country 2019 & 2032
- Table 96: Global Autosampler Market Volume K Unit Forecast, by Country 2019 & 2032
- Table 97: China Autosampler Market Revenue (Million) Forecast, by Application 2019 & 2032
- Table 98: China Autosampler Market Volume (K Unit) Forecast, by Application 2019 & 2032
- Table 99: Japan Autosampler Market Revenue (Million) Forecast, by Application 2019 & 2032
- Table 100: Japan Autosampler Market Volume (K Unit) Forecast, by Application 2019 & 2032
- Table 101: India Autosampler Market Revenue (Million) Forecast, by Application 2019 & 2032
- Table 102: India Autosampler Market Volume (K Unit) Forecast, by Application 2019 & 2032
- Table 103: Australia Autosampler Market Revenue (Million) Forecast, by Application 2019 & 2032
- Table 104: Australia Autosampler Market Volume (K Unit) Forecast, by Application 2019 & 2032
- Table 105: South Korea Autosampler Market Revenue (Million) Forecast, by Application 2019 & 2032
- Table 106: South Korea Autosampler Market Volume (K Unit) Forecast, by Application 2019 & 2032
- Table 107: Rest of Asia Pacific Autosampler Market Revenue (Million) Forecast, by Application 2019 & 2032
- Table 108: Rest of Asia Pacific Autosampler Market Volume (K Unit) Forecast, by Application 2019 & 2032
- Table 109: Global Autosampler Market Revenue Million Forecast, by Product 2019 & 2032
- Table 110: Global Autosampler Market Volume K Unit Forecast, by Product 2019 & 2032
- Table 111: Global Autosampler Market Revenue Million Forecast, by End-User 2019 & 2032
- Table 112: Global Autosampler Market Volume K Unit Forecast, by End-User 2019 & 2032
- Table 113: Global Autosampler Market Revenue Million Forecast, by Country 2019 & 2032
- Table 114: Global Autosampler Market Volume K Unit Forecast, by Country 2019 & 2032
- Table 115: GCC Autosampler Market Revenue (Million) Forecast, by Application 2019 & 2032
- Table 116: GCC Autosampler Market Volume (K Unit) Forecast, by Application 2019 & 2032
- Table 117: South Africa Autosampler Market Revenue (Million) Forecast, by Application 2019 & 2032
- Table 118: South Africa Autosampler Market Volume (K Unit) Forecast, by Application 2019 & 2032
- Table 119: Rest of Middle East and Africa Autosampler Market Revenue (Million) Forecast, by Application 2019 & 2032
- Table 120: Rest of Middle East and Africa Autosampler Market Volume (K Unit) Forecast, by Application 2019 & 2032
- Table 121: Global Autosampler Market Revenue Million Forecast, by Product 2019 & 2032
- Table 122: Global Autosampler Market Volume K Unit Forecast, by Product 2019 & 2032
- Table 123: Global Autosampler Market Revenue Million Forecast, by End-User 2019 & 2032
- Table 124: Global Autosampler Market Volume K Unit Forecast, by End-User 2019 & 2032
- Table 125: Global Autosampler Market Revenue Million Forecast, by Country 2019 & 2032
- Table 126: Global Autosampler Market Volume K Unit Forecast, by Country 2019 & 2032
- Table 127: Brazil Autosampler Market Revenue (Million) Forecast, by Application 2019 & 2032
- Table 128: Brazil Autosampler Market Volume (K Unit) Forecast, by Application 2019 & 2032
- Table 129: Argentina Autosampler Market Revenue (Million) Forecast, by Application 2019 & 2032
- Table 130: Argentina Autosampler Market Volume (K Unit) Forecast, by Application 2019 & 2032
- Table 131: Rest of South America Autosampler Market Revenue (Million) Forecast, by Application 2019 & 2032
- Table 132: Rest of South America Autosampler Market Volume (K Unit) Forecast, by Application 2019 & 2032
Frequently Asked Questions
1. What is the projected Compound Annual Growth Rate (CAGR) of the Autosampler Market?
The projected CAGR is approximately 7.05%.
2. Which companies are prominent players in the Autosampler Market?
Key companies in the market include Restek Corporation, Bio-Rad Laboratories Inc, Waters Corporation, Agilent Technologies Inc, PerkinElmer Inc, Scion Instruments, Gilson Inc, Thermo Fisher Scientific, Shimadzu Corporation.
3. What are the main segments of the Autosampler Market?
The market segments include Product, End-User.
4. Can you provide details about the market size?
The market size is estimated to be USD 1.42 Million as of 2022.
5. What are some drivers contributing to market growth?
Various Advantages of Autosamplers Coupled with Growing Importance of Chromatography in Drug Approval; Increasing Food Safety Concerns.
6. What are the notable trends driving market growth?
Pharmaceutical and Biotechnology Companies are Expected to Witness High Growth Over the Forecast Period.
7. Are there any restraints impacting market growth?
Lack of Skilled Professionals; Limitations in Budget of Small and Mid-Size Market Players.
8. Can you provide examples of recent developments in the market?
In May 2022, Agilent Technologies Inc. collaborated with APC Ltd., committing to work towards combining their technologies to provide unique workflows to customers that support automated process analysis via liquid chromatography (LC).
9. What pricing options are available for accessing the report?
Pricing options include single-user, multi-user, and enterprise licenses priced at USD 4750, USD 5250, and USD 8750 respectively.
10. Is the market size provided in terms of value or volume?
The market size is provided in terms of value, measured in Million and volume, measured in K Unit.
11. Are there any specific market keywords associated with the report?
Yes, the market keyword associated with the report is "Autosampler Market," which aids in identifying and referencing the specific market segment covered.
12. How do I determine which pricing option suits my needs best?
The pricing options vary based on user requirements and access needs. Individual users may opt for single-user licenses, while businesses requiring broader access may choose multi-user or enterprise licenses for cost-effective access to the report.
13. Are there any additional resources or data provided in the Autosampler Market report?
While the report offers comprehensive insights, it's advisable to review the specific contents or supplementary materials provided to ascertain if additional resources or data are available.
14. How can I stay updated on further developments or reports in the Autosampler Market?
To stay informed about further developments, trends, and reports in the Autosampler Market, consider subscribing to industry newsletters, following relevant companies and organizations, or regularly checking reputable industry news sources and publications.
Methodology
Step 1 - Identification of Relevant Samples Size from Population Database


Step 2 - Approaches for Defining Global Market Size (Value, Volume* & Price*)

Note*: In applicable scenarios
Step 3 - Data Sources
Primary Research
- Web Analytics
- Survey Reports
- Research Institute
- Latest Research Reports
- Opinion Leaders
Secondary Research
- Annual Reports
- White Paper
- Latest Press Release
- Industry Association
- Paid Database
- Investor Presentations

Step 4 - Data Triangulation
Involves using different sources of information in order to increase the validity of a study
These sources are likely to be stakeholders in a program - participants, other researchers, program staff, other community members, and so on.
Then we put all data in single framework & apply various statistical tools to find out the dynamic on the market.
During the analysis stage, feedback from the stakeholder groups would be compared to determine areas of agreement as well as areas of divergence


