
Key Insights
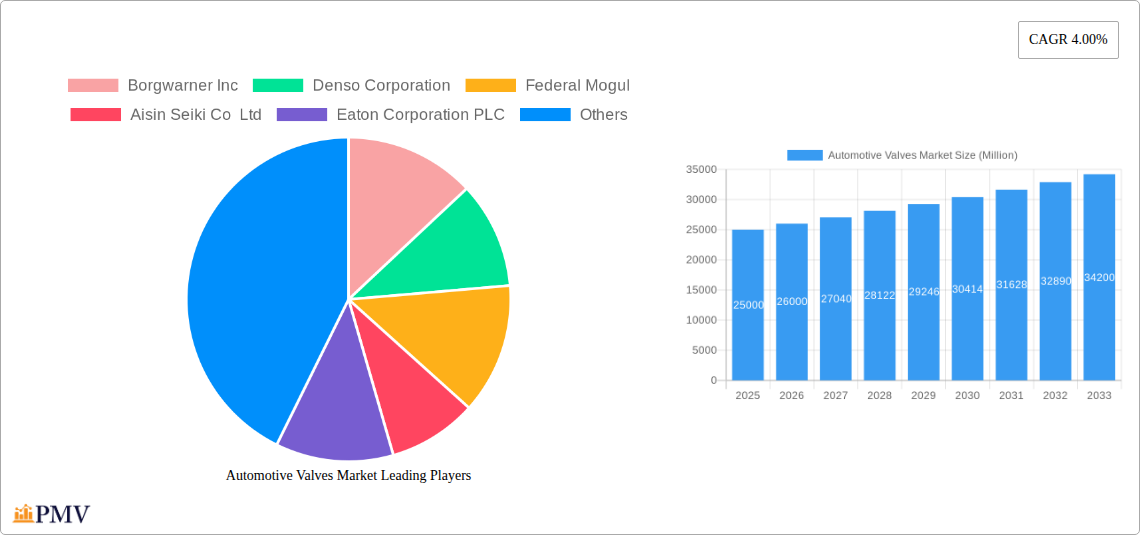
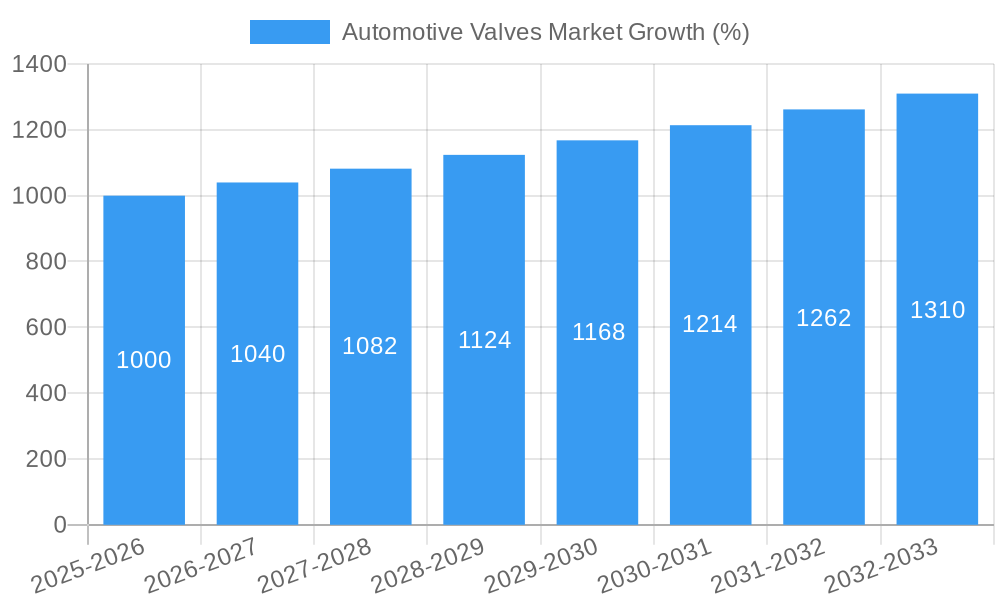
The global automotive valves market is experiencing steady growth, projected to reach a substantial size by 2033. A 4.00% CAGR indicates consistent expansion driven by several key factors. The increasing production of vehicles, particularly passenger cars and commercial vehicles across major economies like China, India, and the US, fuels demand for a wider range of valves. Technological advancements leading to the adoption of more efficient and sophisticated engine designs, including the integration of advanced features like electric and hybrid systems, also contribute significantly to market growth. Furthermore, stringent emission regulations globally are pushing automakers towards improved engine performance and fuel efficiency, leading to a higher demand for advanced automotive valves like EGR valves. The aftermarket segment is also showing promise, driven by the increasing age of vehicles on the road and the need for replacement parts. Competitive pressures among established players like Borgwarner, Denso, and Bosch, alongside the emergence of innovative smaller companies, are driving product innovation and market diversification.
However, certain restraints impact the market's trajectory. Fluctuations in raw material prices, particularly metals used in valve manufacturing, can affect profitability. Economic downturns in key regions could reduce vehicle production, thereby impacting demand. The automotive industry’s ongoing transition towards electric vehicles (EVs) presents both an opportunity and a challenge. While EVs require fewer traditional internal combustion engine valves, the growth of hybrid electric vehicles (HEVs) continues to support demand for specific types of valves, creating a need for adaptation and innovation within the market. Market segmentation analysis reveals that passenger car applications currently dominate, but the commercial vehicle segment exhibits significant growth potential, particularly in emerging economies experiencing rapid industrialization and infrastructure development. This suggests a strategic focus on developing specialized valves tailored to the unique requirements of commercial vehicles.
Automotive Valves Market: A Comprehensive Market Analysis (2019-2033)
This in-depth report provides a comprehensive analysis of the global Automotive Valves Market, offering valuable insights into market dynamics, competitive landscape, and future growth prospects. Covering the period from 2019 to 2033, with a focus on 2025 as the base and estimated year, this report is an essential resource for industry stakeholders, investors, and strategic decision-makers. The global Automotive Valves market size is estimated at xx Million in 2025 and is projected to reach xx Million by 2033, exhibiting a CAGR of xx% during the forecast period (2025-2033).
Automotive Valves Market Market Structure & Competitive Dynamics
The Automotive Valves market exhibits a moderately concentrated structure, with key players holding significant market share. The industry is characterized by intense competition, driven by technological advancements, stringent emission regulations, and evolving consumer preferences. Innovation ecosystems are crucial, fostering the development of advanced valve technologies like variable valve actuation. Regulatory frameworks, particularly concerning emissions standards (e.g., Euro 7, China VI), significantly influence market growth and product development. Product substitutes, such as alternative fuel systems, pose a long-term challenge, though the market dominance of internal combustion engines (ICE) currently minimizes their impact. End-user trends toward fuel efficiency and electric vehicles necessitate continuous adaptation from manufacturers. Mergers and acquisitions (M&A) are common, with deal values fluctuating based on technological breakthroughs and strategic alignment.
- Market Concentration: The top 5 players hold approximately xx% of the market share in 2025.
- Innovation Ecosystems: Collaboration between OEMs and valve suppliers drives technological advancements.
- Regulatory Frameworks: Stringent emission regulations in regions like Europe and China are key market drivers.
- M&A Activity: Significant M&A activity occurred between 2019 and 2024, with deal values totaling approximately xx Million. Deals focused primarily on acquiring specialized technologies and expanding product portfolios.
Automotive Valves Market Industry Trends & Insights
The Automotive Valves market is experiencing dynamic growth, driven by a confluence of factors. The increasing demand for fuel-efficient vehicles is a major driver, prompting the adoption of advanced valve technologies. Technological disruptions, particularly the rise of electric and hybrid vehicles, present both opportunities and challenges. While these technologies reduce the demand for traditional combustion engine valves, it simultaneously boosts demand for electric valve solutions within these new powertrains. Consumer preferences for environmentally friendly vehicles further amplify the demand for improved emission control technologies, including advanced EGR valves. Competitive dynamics are intense, with companies investing heavily in R&D to improve valve performance, durability, and efficiency. Market penetration of advanced valve technologies is steadily increasing, particularly in the premium vehicle segment. The market is expected to experience a CAGR of xx% during the forecast period.
Dominant Markets & Segments in Automotive Valves Market
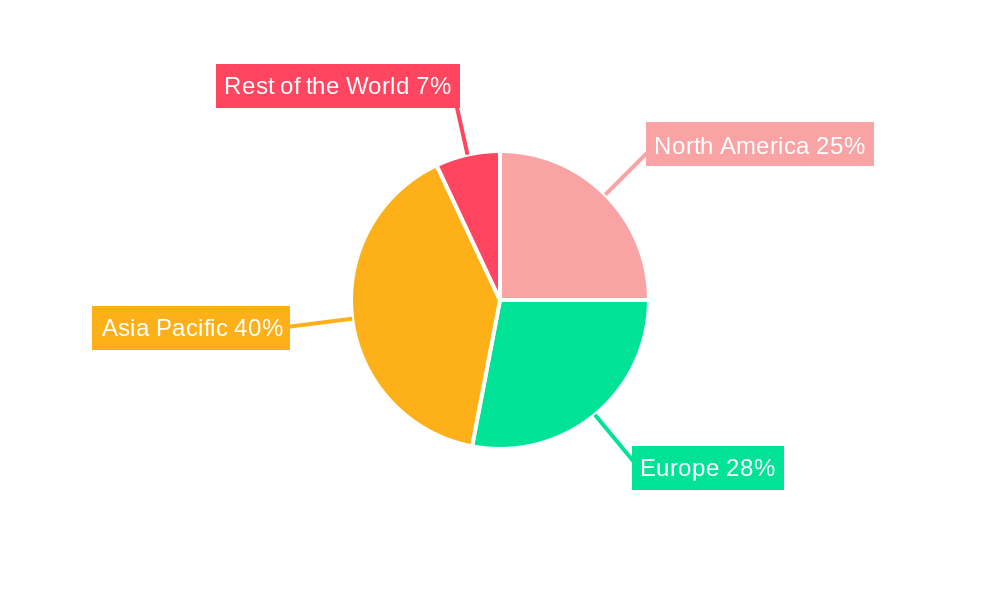
The Passenger Cars segment dominates the Automotive Valves market, owing to the larger vehicle population compared to commercial vehicles. Within application types, Engine Valves hold the largest market share due to their fundamental role in engine operation. The OEM sales channel dominates, reflecting the significant volume of valves used in new vehicle production. Geographically, the Asia-Pacific region is expected to be the leading market due to high vehicle production and robust automotive manufacturing in countries like China, Japan, and India.
Key Drivers in Asia-Pacific:
- Rapid economic growth and rising disposable incomes.
- Expanding automotive manufacturing base.
- Supportive government policies promoting automotive industry development.
Dominant Segments:
- Sales Channel: OEM (xx% market share in 2025)
- Application Type: Engine Valves (xx% market share in 2025)
- Vehicle Type: Passenger Cars (xx% market share in 2025)
Automotive Valves Market Product Innovations
Recent product innovations focus on improving valve efficiency, durability, and emissions reduction capabilities. Variable valve actuation technologies are gaining traction, offering enhanced engine performance and fuel economy. Lightweight materials are being increasingly used to reduce vehicle weight and improve fuel efficiency. These innovations cater to the growing demand for cleaner and more energy-efficient vehicles, meeting stringent emission regulations.
Report Segmentation & Scope
This report segments the Automotive Valves market by Sales Channel (OEM, Aftermarket), Application Type (Engine Valves, Air Conditioning Valves, Fuel System Valves, EGR Valves, Others), Vehicle Type (Passenger Cars, Commercial Vehicles), and Function Type (Pneumatic, Hydraulic, Electric). Each segment's growth projection, market size, and competitive dynamics are analyzed in detail. Growth rates vary considerably across segments, with EGR valves and electric function types experiencing above-average growth due to emission regulations and the shift towards electrification.
Key Drivers of Automotive Valves Market Growth
Stringent emission regulations globally are a primary driver, pushing manufacturers to adopt more efficient and cleaner valve technologies. The rising demand for fuel-efficient vehicles and the ongoing shift towards electric vehicles are also significant growth factors. Technological advancements in valve design and materials, such as the adoption of lighter and stronger materials, enhance performance and durability.
Challenges in the Automotive Valves Market Sector
The automotive industry's cyclical nature can impact market demand. Fluctuations in raw material prices can increase production costs. Intense competition from established and emerging players requires continuous innovation to maintain market share. Supply chain disruptions can affect production and delivery timelines. Stringent quality and safety standards demand high investments in testing and verification.
Leading Players in the Automotive Valves Market Market
- Borgwarner Inc
- Denso Corporation
- Federal Mogul
- Aisin Seiki Co Ltd
- Eaton Corporation PLC
- Valeo S A
- Robert Bosch GmbH (Bosch Rexroth)
- Cummins Inc
- Hitachi Ltd (Hitachi Astemo)
- Johnson Electric Group
Key Developments in Automotive Valves Market Sector
- February 2022: Borgwarner introduced over 80 new EGR valves, boosting its product portfolio and supporting cleaner mobility.
- December 2021: Eaton Corporation launched variable valve actuation technology to help meet China's emission regulations.
- July 2021: Eaton Corporation announced supplying hollow valves for Stellantis' Fiat T3 and T4 engines in Brazil.
Strategic Automotive Valves Market Market Outlook
The Automotive Valves market presents significant growth opportunities, driven by the ongoing demand for enhanced fuel efficiency and emission reduction. The adoption of advanced valve technologies, coupled with the increasing production of electric and hybrid vehicles, will fuel market expansion. Strategic partnerships and collaborations between OEMs and valve suppliers will play a crucial role in driving innovation and market growth. The focus on sustainable and environmentally friendly solutions will shape the future trajectory of the market.
Automotive Valves Market Segmentation
-
1. Application Type
- 1.1. Engine Valves
- 1.2. Air Conditioning Valves
- 1.3. Fuel System Valves
- 1.4. EGR Valves
- 1.5. Others
-
2. Vehicle Type
- 2.1. Passenger Cars
- 2.2. Commercial Vehicles
-
3. Function Type
- 3.1. Pneumatic
- 3.2. Hydraulic
- 3.3. Electric
-
4. Sales Channel
- 4.1. OEM
- 4.2. Aftermarket
Automotive Valves Market Segmentation By Geography
-
1. North America
- 1.1. United States
- 1.2. Canada
- 1.3. Rest of North America
-
2. Europe
- 2.1. Germany
- 2.2. United Kingdom
- 2.3. France
- 2.4. Russia
- 2.5. Spain
- 2.6. Rest of Europe
-
3. Asia Pacific
- 3.1. India
- 3.2. China
- 3.3. Japan
- 3.4. South Korea
- 3.5. Rest of Asia Pacific
-
4. Rest of the World
- 4.1. South America
- 4.2. Middle East and Africa
Automotive Valves Market REPORT HIGHLIGHTS
| Aspects | Details |
|---|---|
| Study Period | 2019-2033 |
| Base Year | 2024 |
| Estimated Year | 2025 |
| Forecast Period | 2025-2033 |
| Historical Period | 2019-2024 |
| Growth Rate | CAGR of 4.00% from 2019-2033 |
| Segmentation |
|
Table of Contents
- 1. Introduction
- 1.1. Research Scope
- 1.2. Market Segmentation
- 1.3. Research Methodology
- 1.4. Definitions and Assumptions
- 2. Executive Summary
- 2.1. Introduction
- 3. Market Dynamics
- 3.1. Introduction
- 3.2. Market Drivers
- 3.2.1. Technological Superiority of LiDAR; Increasing Vehicle Safety Regulations and Growing Adoption of Adas Technology By OEM's
- 3.3. Market Restrains
- 3.3.1. Lack of Electric Charging Infrastructure May Hamper the Growth of the Market
- 3.4. Market Trends
- 3.4.1. Aftermarket is witnessing major growth during the forecast period
- 4. Market Factor Analysis
- 4.1. Porters Five Forces
- 4.2. Supply/Value Chain
- 4.3. PESTEL analysis
- 4.4. Market Entropy
- 4.5. Patent/Trademark Analysis
- 5. Global Automotive Valves Market Analysis, Insights and Forecast, 2019-2031
- 5.1. Market Analysis, Insights and Forecast - by Application Type
- 5.1.1. Engine Valves
- 5.1.2. Air Conditioning Valves
- 5.1.3. Fuel System Valves
- 5.1.4. EGR Valves
- 5.1.5. Others
- 5.2. Market Analysis, Insights and Forecast - by Vehicle Type
- 5.2.1. Passenger Cars
- 5.2.2. Commercial Vehicles
- 5.3. Market Analysis, Insights and Forecast - by Function Type
- 5.3.1. Pneumatic
- 5.3.2. Hydraulic
- 5.3.3. Electric
- 5.4. Market Analysis, Insights and Forecast - by Sales Channel
- 5.4.1. OEM
- 5.4.2. Aftermarket
- 5.5. Market Analysis, Insights and Forecast - by Region
- 5.5.1. North America
- 5.5.2. Europe
- 5.5.3. Asia Pacific
- 5.5.4. Rest of the World
- 5.1. Market Analysis, Insights and Forecast - by Application Type
- 6. North America Automotive Valves Market Analysis, Insights and Forecast, 2019-2031
- 6.1. Market Analysis, Insights and Forecast - by Application Type
- 6.1.1. Engine Valves
- 6.1.2. Air Conditioning Valves
- 6.1.3. Fuel System Valves
- 6.1.4. EGR Valves
- 6.1.5. Others
- 6.2. Market Analysis, Insights and Forecast - by Vehicle Type
- 6.2.1. Passenger Cars
- 6.2.2. Commercial Vehicles
- 6.3. Market Analysis, Insights and Forecast - by Function Type
- 6.3.1. Pneumatic
- 6.3.2. Hydraulic
- 6.3.3. Electric
- 6.4. Market Analysis, Insights and Forecast - by Sales Channel
- 6.4.1. OEM
- 6.4.2. Aftermarket
- 6.1. Market Analysis, Insights and Forecast - by Application Type
- 7. Europe Automotive Valves Market Analysis, Insights and Forecast, 2019-2031
- 7.1. Market Analysis, Insights and Forecast - by Application Type
- 7.1.1. Engine Valves
- 7.1.2. Air Conditioning Valves
- 7.1.3. Fuel System Valves
- 7.1.4. EGR Valves
- 7.1.5. Others
- 7.2. Market Analysis, Insights and Forecast - by Vehicle Type
- 7.2.1. Passenger Cars
- 7.2.2. Commercial Vehicles
- 7.3. Market Analysis, Insights and Forecast - by Function Type
- 7.3.1. Pneumatic
- 7.3.2. Hydraulic
- 7.3.3. Electric
- 7.4. Market Analysis, Insights and Forecast - by Sales Channel
- 7.4.1. OEM
- 7.4.2. Aftermarket
- 7.1. Market Analysis, Insights and Forecast - by Application Type
- 8. Asia Pacific Automotive Valves Market Analysis, Insights and Forecast, 2019-2031
- 8.1. Market Analysis, Insights and Forecast - by Application Type
- 8.1.1. Engine Valves
- 8.1.2. Air Conditioning Valves
- 8.1.3. Fuel System Valves
- 8.1.4. EGR Valves
- 8.1.5. Others
- 8.2. Market Analysis, Insights and Forecast - by Vehicle Type
- 8.2.1. Passenger Cars
- 8.2.2. Commercial Vehicles
- 8.3. Market Analysis, Insights and Forecast - by Function Type
- 8.3.1. Pneumatic
- 8.3.2. Hydraulic
- 8.3.3. Electric
- 8.4. Market Analysis, Insights and Forecast - by Sales Channel
- 8.4.1. OEM
- 8.4.2. Aftermarket
- 8.1. Market Analysis, Insights and Forecast - by Application Type
- 9. Rest of the World Automotive Valves Market Analysis, Insights and Forecast, 2019-2031
- 9.1. Market Analysis, Insights and Forecast - by Application Type
- 9.1.1. Engine Valves
- 9.1.2. Air Conditioning Valves
- 9.1.3. Fuel System Valves
- 9.1.4. EGR Valves
- 9.1.5. Others
- 9.2. Market Analysis, Insights and Forecast - by Vehicle Type
- 9.2.1. Passenger Cars
- 9.2.2. Commercial Vehicles
- 9.3. Market Analysis, Insights and Forecast - by Function Type
- 9.3.1. Pneumatic
- 9.3.2. Hydraulic
- 9.3.3. Electric
- 9.4. Market Analysis, Insights and Forecast - by Sales Channel
- 9.4.1. OEM
- 9.4.2. Aftermarket
- 9.1. Market Analysis, Insights and Forecast - by Application Type
- 10. North America Automotive Valves Market Analysis, Insights and Forecast, 2019-2031
- 10.1. Market Analysis, Insights and Forecast - By Country/Sub-region
- 10.1.1 United States
- 10.1.2 Canada
- 10.1.3 Rest of North America
- 11. Europe Automotive Valves Market Analysis, Insights and Forecast, 2019-2031
- 11.1. Market Analysis, Insights and Forecast - By Country/Sub-region
- 11.1.1 Germany
- 11.1.2 United Kingdom
- 11.1.3 France
- 11.1.4 Russia
- 11.1.5 Spain
- 11.1.6 Rest of Europe
- 12. Asia Pacific Automotive Valves Market Analysis, Insights and Forecast, 2019-2031
- 12.1. Market Analysis, Insights and Forecast - By Country/Sub-region
- 12.1.1 India
- 12.1.2 China
- 12.1.3 Japan
- 12.1.4 South Korea
- 12.1.5 Rest of Asia Pacific
- 13. Rest of the World Automotive Valves Market Analysis, Insights and Forecast, 2019-2031
- 13.1. Market Analysis, Insights and Forecast - By Country/Sub-region
- 13.1.1 South America
- 13.1.2 Middle East and Africa
- 14. Competitive Analysis
- 14.1. Global Market Share Analysis 2024
- 14.2. Company Profiles
- 14.2.1 Borgwarner Inc
- 14.2.1.1. Overview
- 14.2.1.2. Products
- 14.2.1.3. SWOT Analysis
- 14.2.1.4. Recent Developments
- 14.2.1.5. Financials (Based on Availability)
- 14.2.2 Denso Corporation
- 14.2.2.1. Overview
- 14.2.2.2. Products
- 14.2.2.3. SWOT Analysis
- 14.2.2.4. Recent Developments
- 14.2.2.5. Financials (Based on Availability)
- 14.2.3 Federal Mogul
- 14.2.3.1. Overview
- 14.2.3.2. Products
- 14.2.3.3. SWOT Analysis
- 14.2.3.4. Recent Developments
- 14.2.3.5. Financials (Based on Availability)
- 14.2.4 Aisin Seiki Co Ltd
- 14.2.4.1. Overview
- 14.2.4.2. Products
- 14.2.4.3. SWOT Analysis
- 14.2.4.4. Recent Developments
- 14.2.4.5. Financials (Based on Availability)
- 14.2.5 Eaton Corporation PLC
- 14.2.5.1. Overview
- 14.2.5.2. Products
- 14.2.5.3. SWOT Analysis
- 14.2.5.4. Recent Developments
- 14.2.5.5. Financials (Based on Availability)
- 14.2.6 Valeo S A
- 14.2.6.1. Overview
- 14.2.6.2. Products
- 14.2.6.3. SWOT Analysis
- 14.2.6.4. Recent Developments
- 14.2.6.5. Financials (Based on Availability)
- 14.2.7 Robert Bosch GmbH (Bosch Rexroth)
- 14.2.7.1. Overview
- 14.2.7.2. Products
- 14.2.7.3. SWOT Analysis
- 14.2.7.4. Recent Developments
- 14.2.7.5. Financials (Based on Availability)
- 14.2.8 Cummins Inc
- 14.2.8.1. Overview
- 14.2.8.2. Products
- 14.2.8.3. SWOT Analysis
- 14.2.8.4. Recent Developments
- 14.2.8.5. Financials (Based on Availability)
- 14.2.9 Hitachi Ltd (Hitachi Astemo)
- 14.2.9.1. Overview
- 14.2.9.2. Products
- 14.2.9.3. SWOT Analysis
- 14.2.9.4. Recent Developments
- 14.2.9.5. Financials (Based on Availability)
- 14.2.10 Johnson Electric Grou
- 14.2.10.1. Overview
- 14.2.10.2. Products
- 14.2.10.3. SWOT Analysis
- 14.2.10.4. Recent Developments
- 14.2.10.5. Financials (Based on Availability)
- 14.2.1 Borgwarner Inc
List of Figures
- Figure 1: Global Automotive Valves Market Revenue Breakdown (Million, %) by Region 2024 & 2032
- Figure 2: North America Automotive Valves Market Revenue (Million), by Country 2024 & 2032
- Figure 3: North America Automotive Valves Market Revenue Share (%), by Country 2024 & 2032
- Figure 4: Europe Automotive Valves Market Revenue (Million), by Country 2024 & 2032
- Figure 5: Europe Automotive Valves Market Revenue Share (%), by Country 2024 & 2032
- Figure 6: Asia Pacific Automotive Valves Market Revenue (Million), by Country 2024 & 2032
- Figure 7: Asia Pacific Automotive Valves Market Revenue Share (%), by Country 2024 & 2032
- Figure 8: Rest of the World Automotive Valves Market Revenue (Million), by Country 2024 & 2032
- Figure 9: Rest of the World Automotive Valves Market Revenue Share (%), by Country 2024 & 2032
- Figure 10: North America Automotive Valves Market Revenue (Million), by Application Type 2024 & 2032
- Figure 11: North America Automotive Valves Market Revenue Share (%), by Application Type 2024 & 2032
- Figure 12: North America Automotive Valves Market Revenue (Million), by Vehicle Type 2024 & 2032
- Figure 13: North America Automotive Valves Market Revenue Share (%), by Vehicle Type 2024 & 2032
- Figure 14: North America Automotive Valves Market Revenue (Million), by Function Type 2024 & 2032
- Figure 15: North America Automotive Valves Market Revenue Share (%), by Function Type 2024 & 2032
- Figure 16: North America Automotive Valves Market Revenue (Million), by Sales Channel 2024 & 2032
- Figure 17: North America Automotive Valves Market Revenue Share (%), by Sales Channel 2024 & 2032
- Figure 18: North America Automotive Valves Market Revenue (Million), by Country 2024 & 2032
- Figure 19: North America Automotive Valves Market Revenue Share (%), by Country 2024 & 2032
- Figure 20: Europe Automotive Valves Market Revenue (Million), by Application Type 2024 & 2032
- Figure 21: Europe Automotive Valves Market Revenue Share (%), by Application Type 2024 & 2032
- Figure 22: Europe Automotive Valves Market Revenue (Million), by Vehicle Type 2024 & 2032
- Figure 23: Europe Automotive Valves Market Revenue Share (%), by Vehicle Type 2024 & 2032
- Figure 24: Europe Automotive Valves Market Revenue (Million), by Function Type 2024 & 2032
- Figure 25: Europe Automotive Valves Market Revenue Share (%), by Function Type 2024 & 2032
- Figure 26: Europe Automotive Valves Market Revenue (Million), by Sales Channel 2024 & 2032
- Figure 27: Europe Automotive Valves Market Revenue Share (%), by Sales Channel 2024 & 2032
- Figure 28: Europe Automotive Valves Market Revenue (Million), by Country 2024 & 2032
- Figure 29: Europe Automotive Valves Market Revenue Share (%), by Country 2024 & 2032
- Figure 30: Asia Pacific Automotive Valves Market Revenue (Million), by Application Type 2024 & 2032
- Figure 31: Asia Pacific Automotive Valves Market Revenue Share (%), by Application Type 2024 & 2032
- Figure 32: Asia Pacific Automotive Valves Market Revenue (Million), by Vehicle Type 2024 & 2032
- Figure 33: Asia Pacific Automotive Valves Market Revenue Share (%), by Vehicle Type 2024 & 2032
- Figure 34: Asia Pacific Automotive Valves Market Revenue (Million), by Function Type 2024 & 2032
- Figure 35: Asia Pacific Automotive Valves Market Revenue Share (%), by Function Type 2024 & 2032
- Figure 36: Asia Pacific Automotive Valves Market Revenue (Million), by Sales Channel 2024 & 2032
- Figure 37: Asia Pacific Automotive Valves Market Revenue Share (%), by Sales Channel 2024 & 2032
- Figure 38: Asia Pacific Automotive Valves Market Revenue (Million), by Country 2024 & 2032
- Figure 39: Asia Pacific Automotive Valves Market Revenue Share (%), by Country 2024 & 2032
- Figure 40: Rest of the World Automotive Valves Market Revenue (Million), by Application Type 2024 & 2032
- Figure 41: Rest of the World Automotive Valves Market Revenue Share (%), by Application Type 2024 & 2032
- Figure 42: Rest of the World Automotive Valves Market Revenue (Million), by Vehicle Type 2024 & 2032
- Figure 43: Rest of the World Automotive Valves Market Revenue Share (%), by Vehicle Type 2024 & 2032
- Figure 44: Rest of the World Automotive Valves Market Revenue (Million), by Function Type 2024 & 2032
- Figure 45: Rest of the World Automotive Valves Market Revenue Share (%), by Function Type 2024 & 2032
- Figure 46: Rest of the World Automotive Valves Market Revenue (Million), by Sales Channel 2024 & 2032
- Figure 47: Rest of the World Automotive Valves Market Revenue Share (%), by Sales Channel 2024 & 2032
- Figure 48: Rest of the World Automotive Valves Market Revenue (Million), by Country 2024 & 2032
- Figure 49: Rest of the World Automotive Valves Market Revenue Share (%), by Country 2024 & 2032
List of Tables
- Table 1: Global Automotive Valves Market Revenue Million Forecast, by Region 2019 & 2032
- Table 2: Global Automotive Valves Market Revenue Million Forecast, by Application Type 2019 & 2032
- Table 3: Global Automotive Valves Market Revenue Million Forecast, by Vehicle Type 2019 & 2032
- Table 4: Global Automotive Valves Market Revenue Million Forecast, by Function Type 2019 & 2032
- Table 5: Global Automotive Valves Market Revenue Million Forecast, by Sales Channel 2019 & 2032
- Table 6: Global Automotive Valves Market Revenue Million Forecast, by Region 2019 & 2032
- Table 7: Global Automotive Valves Market Revenue Million Forecast, by Country 2019 & 2032
- Table 8: United States Automotive Valves Market Revenue (Million) Forecast, by Application 2019 & 2032
- Table 9: Canada Automotive Valves Market Revenue (Million) Forecast, by Application 2019 & 2032
- Table 10: Rest of North America Automotive Valves Market Revenue (Million) Forecast, by Application 2019 & 2032
- Table 11: Global Automotive Valves Market Revenue Million Forecast, by Country 2019 & 2032
- Table 12: Germany Automotive Valves Market Revenue (Million) Forecast, by Application 2019 & 2032
- Table 13: United Kingdom Automotive Valves Market Revenue (Million) Forecast, by Application 2019 & 2032
- Table 14: France Automotive Valves Market Revenue (Million) Forecast, by Application 2019 & 2032
- Table 15: Russia Automotive Valves Market Revenue (Million) Forecast, by Application 2019 & 2032
- Table 16: Spain Automotive Valves Market Revenue (Million) Forecast, by Application 2019 & 2032
- Table 17: Rest of Europe Automotive Valves Market Revenue (Million) Forecast, by Application 2019 & 2032
- Table 18: Global Automotive Valves Market Revenue Million Forecast, by Country 2019 & 2032
- Table 19: India Automotive Valves Market Revenue (Million) Forecast, by Application 2019 & 2032
- Table 20: China Automotive Valves Market Revenue (Million) Forecast, by Application 2019 & 2032
- Table 21: Japan Automotive Valves Market Revenue (Million) Forecast, by Application 2019 & 2032
- Table 22: South Korea Automotive Valves Market Revenue (Million) Forecast, by Application 2019 & 2032
- Table 23: Rest of Asia Pacific Automotive Valves Market Revenue (Million) Forecast, by Application 2019 & 2032
- Table 24: Global Automotive Valves Market Revenue Million Forecast, by Country 2019 & 2032
- Table 25: South America Automotive Valves Market Revenue (Million) Forecast, by Application 2019 & 2032
- Table 26: Middle East and Africa Automotive Valves Market Revenue (Million) Forecast, by Application 2019 & 2032
- Table 27: Global Automotive Valves Market Revenue Million Forecast, by Application Type 2019 & 2032
- Table 28: Global Automotive Valves Market Revenue Million Forecast, by Vehicle Type 2019 & 2032
- Table 29: Global Automotive Valves Market Revenue Million Forecast, by Function Type 2019 & 2032
- Table 30: Global Automotive Valves Market Revenue Million Forecast, by Sales Channel 2019 & 2032
- Table 31: Global Automotive Valves Market Revenue Million Forecast, by Country 2019 & 2032
- Table 32: United States Automotive Valves Market Revenue (Million) Forecast, by Application 2019 & 2032
- Table 33: Canada Automotive Valves Market Revenue (Million) Forecast, by Application 2019 & 2032
- Table 34: Rest of North America Automotive Valves Market Revenue (Million) Forecast, by Application 2019 & 2032
- Table 35: Global Automotive Valves Market Revenue Million Forecast, by Application Type 2019 & 2032
- Table 36: Global Automotive Valves Market Revenue Million Forecast, by Vehicle Type 2019 & 2032
- Table 37: Global Automotive Valves Market Revenue Million Forecast, by Function Type 2019 & 2032
- Table 38: Global Automotive Valves Market Revenue Million Forecast, by Sales Channel 2019 & 2032
- Table 39: Global Automotive Valves Market Revenue Million Forecast, by Country 2019 & 2032
- Table 40: Germany Automotive Valves Market Revenue (Million) Forecast, by Application 2019 & 2032
- Table 41: United Kingdom Automotive Valves Market Revenue (Million) Forecast, by Application 2019 & 2032
- Table 42: France Automotive Valves Market Revenue (Million) Forecast, by Application 2019 & 2032
- Table 43: Russia Automotive Valves Market Revenue (Million) Forecast, by Application 2019 & 2032
- Table 44: Spain Automotive Valves Market Revenue (Million) Forecast, by Application 2019 & 2032
- Table 45: Rest of Europe Automotive Valves Market Revenue (Million) Forecast, by Application 2019 & 2032
- Table 46: Global Automotive Valves Market Revenue Million Forecast, by Application Type 2019 & 2032
- Table 47: Global Automotive Valves Market Revenue Million Forecast, by Vehicle Type 2019 & 2032
- Table 48: Global Automotive Valves Market Revenue Million Forecast, by Function Type 2019 & 2032
- Table 49: Global Automotive Valves Market Revenue Million Forecast, by Sales Channel 2019 & 2032
- Table 50: Global Automotive Valves Market Revenue Million Forecast, by Country 2019 & 2032
- Table 51: India Automotive Valves Market Revenue (Million) Forecast, by Application 2019 & 2032
- Table 52: China Automotive Valves Market Revenue (Million) Forecast, by Application 2019 & 2032
- Table 53: Japan Automotive Valves Market Revenue (Million) Forecast, by Application 2019 & 2032
- Table 54: South Korea Automotive Valves Market Revenue (Million) Forecast, by Application 2019 & 2032
- Table 55: Rest of Asia Pacific Automotive Valves Market Revenue (Million) Forecast, by Application 2019 & 2032
- Table 56: Global Automotive Valves Market Revenue Million Forecast, by Application Type 2019 & 2032
- Table 57: Global Automotive Valves Market Revenue Million Forecast, by Vehicle Type 2019 & 2032
- Table 58: Global Automotive Valves Market Revenue Million Forecast, by Function Type 2019 & 2032
- Table 59: Global Automotive Valves Market Revenue Million Forecast, by Sales Channel 2019 & 2032
- Table 60: Global Automotive Valves Market Revenue Million Forecast, by Country 2019 & 2032
- Table 61: South America Automotive Valves Market Revenue (Million) Forecast, by Application 2019 & 2032
- Table 62: Middle East and Africa Automotive Valves Market Revenue (Million) Forecast, by Application 2019 & 2032
Frequently Asked Questions
1. What is the projected Compound Annual Growth Rate (CAGR) of the Automotive Valves Market?
The projected CAGR is approximately 4.00%.
2. Which companies are prominent players in the Automotive Valves Market?
Key companies in the market include Borgwarner Inc, Denso Corporation, Federal Mogul, Aisin Seiki Co Ltd, Eaton Corporation PLC, Valeo S A, Robert Bosch GmbH (Bosch Rexroth), Cummins Inc, Hitachi Ltd (Hitachi Astemo), Johnson Electric Grou.
3. What are the main segments of the Automotive Valves Market?
The market segments include Application Type, Vehicle Type, Function Type, Sales Channel.
4. Can you provide details about the market size?
The market size is estimated to be USD XX Million as of 2022.
5. What are some drivers contributing to market growth?
Technological Superiority of LiDAR; Increasing Vehicle Safety Regulations and Growing Adoption of Adas Technology By OEM's.
6. What are the notable trends driving market growth?
Aftermarket is witnessing major growth during the forecast period.
7. Are there any restraints impacting market growth?
Lack of Electric Charging Infrastructure May Hamper the Growth of the Market.
8. Can you provide examples of recent developments in the market?
In February 2022, Borgwarner introduced a new range of Exhaust gas recirculation valves by adding over 80 new part numbers to the product portfolio. These new EGR valves help to reduce emissions for most engine types, thereby supporting cleaner and more energy-efficient mobility.
9. What pricing options are available for accessing the report?
Pricing options include single-user, multi-user, and enterprise licenses priced at USD 4750, USD 5250, and USD 8750 respectively.
10. Is the market size provided in terms of value or volume?
The market size is provided in terms of value, measured in Million.
11. Are there any specific market keywords associated with the report?
Yes, the market keyword associated with the report is "Automotive Valves Market," which aids in identifying and referencing the specific market segment covered.
12. How do I determine which pricing option suits my needs best?
The pricing options vary based on user requirements and access needs. Individual users may opt for single-user licenses, while businesses requiring broader access may choose multi-user or enterprise licenses for cost-effective access to the report.
13. Are there any additional resources or data provided in the Automotive Valves Market report?
While the report offers comprehensive insights, it's advisable to review the specific contents or supplementary materials provided to ascertain if additional resources or data are available.
14. How can I stay updated on further developments or reports in the Automotive Valves Market?
To stay informed about further developments, trends, and reports in the Automotive Valves Market, consider subscribing to industry newsletters, following relevant companies and organizations, or regularly checking reputable industry news sources and publications.
Methodology
Step 1 - Identification of Relevant Samples Size from Population Database


Step 2 - Approaches for Defining Global Market Size (Value, Volume* & Price*)

Note*: In applicable scenarios
Step 3 - Data Sources
Primary Research
- Web Analytics
- Survey Reports
- Research Institute
- Latest Research Reports
- Opinion Leaders
Secondary Research
- Annual Reports
- White Paper
- Latest Press Release
- Industry Association
- Paid Database
- Investor Presentations

Step 4 - Data Triangulation
Involves using different sources of information in order to increase the validity of a study
These sources are likely to be stakeholders in a program - participants, other researchers, program staff, other community members, and so on.
Then we put all data in single framework & apply various statistical tools to find out the dynamic on the market.
During the analysis stage, feedback from the stakeholder groups would be compared to determine areas of agreement as well as areas of divergence


