
Key Insights
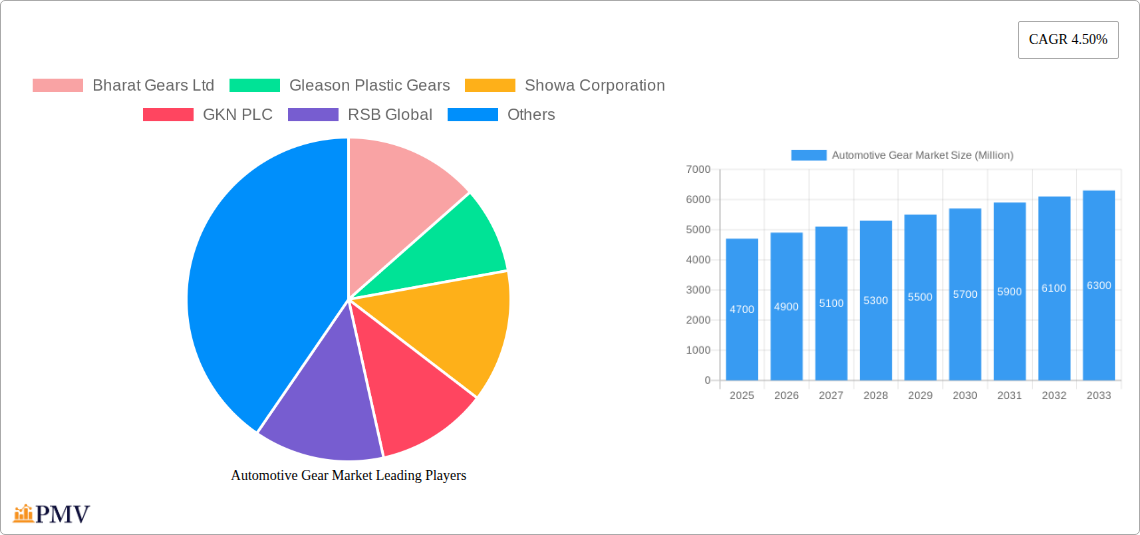
The automotive gear market, valued at $4.70 billion in 2025, is projected to experience robust growth, driven by the increasing demand for electric vehicles (EVs) and the continued expansion of the automotive industry globally. The market's Compound Annual Growth Rate (CAGR) of 4.50% from 2025 to 2033 indicates a significant upward trajectory. Several factors contribute to this growth. The rising adoption of advanced driver-assistance systems (ADAS) and the increasing complexity of automotive transmissions necessitate sophisticated and high-performance gear systems. Furthermore, the shift towards lightweight vehicle designs to improve fuel efficiency is fueling demand for gears made from advanced materials like composites and plastics. Regional variations in growth are expected, with Asia Pacific likely to lead due to rapid automotive production expansion in countries like China and India. However, stringent emission regulations in developed markets like North America and Europe are also driving innovation and adoption of more efficient gear technologies. The market segmentation by position (skew shaft, worm, bevel, parallel shaft gears), material (ferrous, non-ferrous, composites), and application (steering, differential, transmission systems) reflects the diverse functionalities and technological advancements within the industry. Key players such as Bharat Gears Ltd, Gleason Plastic Gears, and GKN PLC are vying for market share through strategic partnerships, technological innovations, and geographic expansion. The competitive landscape is further intensified by the presence of numerous regional players, leading to potential consolidation and collaboration opportunities in the coming years.
The market's restraints include fluctuating raw material prices, particularly for ferrous metals, which can impact production costs. Supply chain disruptions and geopolitical factors also pose challenges. However, ongoing research and development efforts focused on improving gear efficiency, durability, and noise reduction are expected to mitigate these challenges and sustain market growth. The market’s segmentation provides opportunities for specialized players to target niche applications and materials, capitalizing on the increasing demand for customized and high-performance gear solutions. The forecast period indicates sustained growth, driven by technological advancements and a growing global automotive sector. This suggests promising investment prospects for companies involved in the design, manufacturing, and distribution of automotive gears.
Automotive Gear Market: A Comprehensive Report (2019-2033)
This in-depth report provides a comprehensive analysis of the global Automotive Gear Market, encompassing market size, segmentation, growth drivers, challenges, competitive landscape, and future outlook. The study period covers 2019-2033, with 2025 as the base year and forecast period spanning 2025-2033. This report is crucial for automotive manufacturers, component suppliers, investors, and industry stakeholders seeking to understand and capitalize on the opportunities within this dynamic market. The market is projected to reach xx Million by 2033.
Automotive Gear Market Market Structure & Competitive Dynamics
The automotive gear market exhibits a moderately concentrated structure, with several major players holding significant market share. However, the presence of numerous smaller, specialized companies contributes to a competitive landscape characterized by both intense rivalry and opportunities for niche players. Innovation ecosystems are driven by advancements in materials science, manufacturing processes, and electric vehicle (EV) technologies. Stringent regulatory frameworks, particularly concerning emissions and safety, impact product design and manufacturing. Product substitutes, while limited, include alternative power transmission systems, presenting a challenge to the traditional gear market. End-user trends, particularly the shift toward EVs and autonomous vehicles, significantly shape market demand. Mergers and acquisitions (M&A) activity is notable, with deals focused on consolidating market share, accessing new technologies, and expanding geographic reach. The total M&A deal value during the study period is estimated at xx Million. Key metrics include:
- Market Concentration: Moderately Concentrated (xx% held by top 5 players)
- M&A Deal Value (2019-2024): xx Million
- Average Market Share of Top 5 Players: xx%
- Innovation Focus: EV Technology Integration, Lightweighting, Enhanced Durability
Automotive Gear Market Industry Trends & Insights
The automotive gear market is experiencing significant transformation fueled by several key trends. The global shift toward electric vehicles (EVs) is a major growth driver, demanding gears optimized for electric powertrains. The rising adoption of autonomous driving technologies necessitates robust and reliable gear systems capable of handling complex control algorithms. Consumer preferences for fuel efficiency and reduced emissions further drive the demand for lightweight and high-performance gear solutions. Technological disruptions, such as the development of advanced materials and manufacturing processes, are enhancing the capabilities and efficiency of automotive gears. Competitive dynamics are shaped by ongoing innovation, product differentiation, and strategic partnerships, including collaborations among established players and startups. The market is expected to register a CAGR of xx% during the forecast period (2025-2033). Market penetration of advanced gear materials, such as composites and plastics, is steadily increasing, driven by their lightweight nature and improved performance characteristics.
Dominant Markets & Segments in Automotive Gear Market
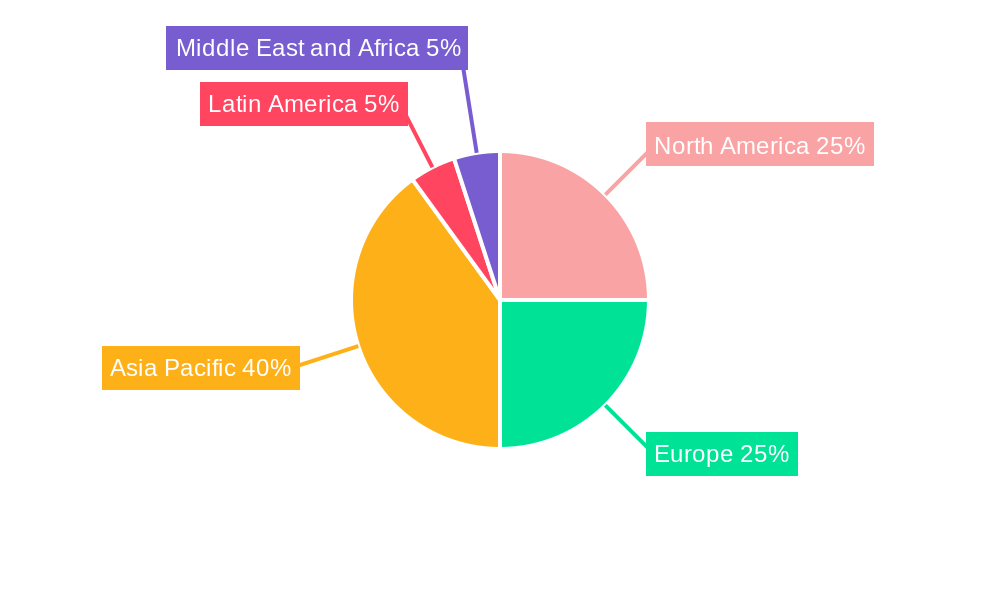
The Asia Pacific region is currently the dominant market for automotive gears, driven by robust automotive production and expanding EV adoption. Within this region, China and India are key growth markets. Significant segments include:
- By Position: Parallel shaft gears hold the largest market share due to widespread applications in transmission systems.
- By Material: Ferrous metals continue to dominate due to their strength and cost-effectiveness. However, the market share of non-ferrous metals and other materials (composites and plastics) is gradually increasing due to their lightweight and high-performance properties.
- By Application: Transmission systems constitute the largest application segment, followed by differential and steering systems.
Key Drivers for Regional Dominance:
- Asia Pacific: Strong automotive manufacturing base, increasing EV adoption, supportive government policies, and growing infrastructure development.
- North America: High demand for premium vehicles, technological advancements, and robust R&D activities.
- Europe: stringent emission regulations and focus on fuel efficiency.
Automotive Gear Market Product Innovations
Recent product innovations center on lightweight materials, improved durability, enhanced efficiency, and integration with advanced driver-assistance systems (ADAS). Companies are focusing on developing gears with reduced noise, vibration, and harshness (NVH) characteristics to enhance driving comfort. Technological trends include the adoption of additive manufacturing (3D printing) for customized gear designs and the use of advanced materials like carbon fiber reinforced polymers (CFRP) for lightweighting. These innovations cater to the growing demand for fuel-efficient and high-performance vehicles.
Report Segmentation & Scope
This report segments the automotive gear market comprehensively by position (skew shaft gears, worm gears, spiral bevel gears), material (ferrous metals, non-ferrous metals, other materials), and application (steering, differential, transmission systems). Each segment is analyzed for growth projections, market size, and competitive dynamics. Growth projections vary across segments, reflecting their specific applications and technological advancements.
Key Drivers of Automotive Gear Market Growth
Several key factors are driving the growth of the automotive gear market. The increasing demand for vehicles globally, particularly in developing economies, is a significant factor. The rising adoption of electric vehicles (EVs) necessitates the development of specialized gears suitable for electric powertrains, thereby stimulating market growth. Government regulations aimed at improving fuel efficiency and reducing emissions are also pushing innovation in gear technology.
Challenges in the Automotive Gear Market Sector
The automotive gear market faces several challenges, including fluctuations in raw material prices, stringent emission norms, and intense competition. Supply chain disruptions can affect production and availability, while maintaining quality standards and meeting stringent regulatory requirements pose significant challenges. The increasing complexity of gear designs adds to manufacturing costs.
Leading Players in the Automotive Gear Market Market
- Bharat Gears Ltd
- Gleason Plastic Gears
- Showa Corporation
- GKN PLC
- RSB Global
- Cone Drive
- American Axle & Manufacturing Holdings Inc
- Dynamatic Technologies Limited
- IMS Gear SE & Co KGaA
- AmTech International
- Robert Bosch GmbH
- ZF Friedrichshafen AG
- Taiwan United Gear Co Ltd
- Franz Morat Group
- Universal Auto Gears LLP
Key Developments in Automotive Gear Market Sector
- September 2021: ZF announced the integration of the MICO brand and launched new products, including a next-generation Redulus4F Industrial Gearbox Series and Advanced Serviceability Solutions.
- May 2021: American Axle & Manufacturing Inc. and REE Automotive partnered to develop a new electric propulsion system for e-mobility.
- April 2021: Aisin Seiki and Aisin AW Co. Ltd integrated their operations to strengthen competitiveness in the CASE domain.
- February 2021: American Axle Manufacturing (AAM) secured the axle and driveshaft program for Ram's heavy-duty pick-up trucks through 2030.
Strategic Automotive Gear Market Market Outlook
The automotive gear market is poised for sustained growth, driven by the continued expansion of the automotive industry, the rising adoption of electric and autonomous vehicles, and ongoing technological advancements. Strategic opportunities exist for companies that can innovate in lightweight materials, enhance gear efficiency, and provide integrated solutions for advanced powertrain systems. The focus on sustainable mobility and reduced emissions will further drive demand for advanced gear technologies.
Automotive Gear Market Segmentation
-
1. Position
-
1.1. Skew Shaft Gears
- 1.1.1. Hypoid Gears
- 1.1.2. Worm Gears
-
1.2. Intersecting Shaft Gears
- 1.2.1. Straight Bevel Gears
- 1.2.2. Spiral Bevel Gears
-
1.3. Parallel Shaft Gears
- 1.3.1. Spur Gears
- 1.3.2. Rack and Pinion Gears
- 1.3.3. Herringbone Gears
- 1.3.4. Helical Gears
-
1.1. Skew Shaft Gears
-
2. Material
- 2.1. Ferrous Metals
- 2.2. Non-ferrous Metals
- 2.3. Other Materials (Composites and Plastics)
-
3. Application
- 3.1. Steering Systems
- 3.2. Differential Systems
-
3.3. Transmission Systems
- 3.3.1. Manual
- 3.3.2. Automatic
Automotive Gear Market Segmentation By Geography
-
1. North America
- 1.1. United States
- 1.2. Canada
- 1.3. Rest of North America
-
2. Europe
- 2.1. Germany
- 2.2. United Kingdom
- 2.3. France
- 2.4. Italy
- 2.5. Rest of Europe
-
3. Asia Pacific
- 3.1. China
- 3.2. Japan
- 3.3. India
- 3.4. South Korea
- 3.5. Rest of Asia Pacific
-
4. Latin America
- 4.1. Brazil
- 4.2. Argentina
- 4.3. Mexico
- 4.4. Rest of South America
-
5. Middle East and Africa
- 5.1. United Arab Emirates
- 5.2. South Africa
- 5.3. Rest of Middle East and Africa
Automotive Gear Market REPORT HIGHLIGHTS
| Aspects | Details |
|---|---|
| Study Period | 2019-2033 |
| Base Year | 2024 |
| Estimated Year | 2025 |
| Forecast Period | 2025-2033 |
| Historical Period | 2019-2024 |
| Growth Rate | CAGR of 4.50% from 2019-2033 |
| Segmentation |
|
Table of Contents
- 1. Introduction
- 1.1. Research Scope
- 1.2. Market Segmentation
- 1.3. Research Methodology
- 1.4. Definitions and Assumptions
- 2. Executive Summary
- 2.1. Introduction
- 3. Market Dynamics
- 3.1. Introduction
- 3.2. Market Drivers
- 3.2.1. Rise in Vehicle Electrification
- 3.3. Market Restrains
- 3.3.1. The Cost of Raw Materials Used in the Manufacturing of Switches is High
- 3.4. Market Trends
- 3.4.1. Parallel Gear Shaft is Expected to Dominate the Market during Forecast Period
- 4. Market Factor Analysis
- 4.1. Porters Five Forces
- 4.2. Supply/Value Chain
- 4.3. PESTEL analysis
- 4.4. Market Entropy
- 4.5. Patent/Trademark Analysis
- 5. Global Automotive Gear Market Analysis, Insights and Forecast, 2019-2031
- 5.1. Market Analysis, Insights and Forecast - by Position
- 5.1.1. Skew Shaft Gears
- 5.1.1.1. Hypoid Gears
- 5.1.1.2. Worm Gears
- 5.1.2. Intersecting Shaft Gears
- 5.1.2.1. Straight Bevel Gears
- 5.1.2.2. Spiral Bevel Gears
- 5.1.3. Parallel Shaft Gears
- 5.1.3.1. Spur Gears
- 5.1.3.2. Rack and Pinion Gears
- 5.1.3.3. Herringbone Gears
- 5.1.3.4. Helical Gears
- 5.1.1. Skew Shaft Gears
- 5.2. Market Analysis, Insights and Forecast - by Material
- 5.2.1. Ferrous Metals
- 5.2.2. Non-ferrous Metals
- 5.2.3. Other Materials (Composites and Plastics)
- 5.3. Market Analysis, Insights and Forecast - by Application
- 5.3.1. Steering Systems
- 5.3.2. Differential Systems
- 5.3.3. Transmission Systems
- 5.3.3.1. Manual
- 5.3.3.2. Automatic
- 5.4. Market Analysis, Insights and Forecast - by Region
- 5.4.1. North America
- 5.4.2. Europe
- 5.4.3. Asia Pacific
- 5.4.4. Latin America
- 5.4.5. Middle East and Africa
- 5.1. Market Analysis, Insights and Forecast - by Position
- 6. North America Automotive Gear Market Analysis, Insights and Forecast, 2019-2031
- 6.1. Market Analysis, Insights and Forecast - by Position
- 6.1.1. Skew Shaft Gears
- 6.1.1.1. Hypoid Gears
- 6.1.1.2. Worm Gears
- 6.1.2. Intersecting Shaft Gears
- 6.1.2.1. Straight Bevel Gears
- 6.1.2.2. Spiral Bevel Gears
- 6.1.3. Parallel Shaft Gears
- 6.1.3.1. Spur Gears
- 6.1.3.2. Rack and Pinion Gears
- 6.1.3.3. Herringbone Gears
- 6.1.3.4. Helical Gears
- 6.1.1. Skew Shaft Gears
- 6.2. Market Analysis, Insights and Forecast - by Material
- 6.2.1. Ferrous Metals
- 6.2.2. Non-ferrous Metals
- 6.2.3. Other Materials (Composites and Plastics)
- 6.3. Market Analysis, Insights and Forecast - by Application
- 6.3.1. Steering Systems
- 6.3.2. Differential Systems
- 6.3.3. Transmission Systems
- 6.3.3.1. Manual
- 6.3.3.2. Automatic
- 6.1. Market Analysis, Insights and Forecast - by Position
- 7. Europe Automotive Gear Market Analysis, Insights and Forecast, 2019-2031
- 7.1. Market Analysis, Insights and Forecast - by Position
- 7.1.1. Skew Shaft Gears
- 7.1.1.1. Hypoid Gears
- 7.1.1.2. Worm Gears
- 7.1.2. Intersecting Shaft Gears
- 7.1.2.1. Straight Bevel Gears
- 7.1.2.2. Spiral Bevel Gears
- 7.1.3. Parallel Shaft Gears
- 7.1.3.1. Spur Gears
- 7.1.3.2. Rack and Pinion Gears
- 7.1.3.3. Herringbone Gears
- 7.1.3.4. Helical Gears
- 7.1.1. Skew Shaft Gears
- 7.2. Market Analysis, Insights and Forecast - by Material
- 7.2.1. Ferrous Metals
- 7.2.2. Non-ferrous Metals
- 7.2.3. Other Materials (Composites and Plastics)
- 7.3. Market Analysis, Insights and Forecast - by Application
- 7.3.1. Steering Systems
- 7.3.2. Differential Systems
- 7.3.3. Transmission Systems
- 7.3.3.1. Manual
- 7.3.3.2. Automatic
- 7.1. Market Analysis, Insights and Forecast - by Position
- 8. Asia Pacific Automotive Gear Market Analysis, Insights and Forecast, 2019-2031
- 8.1. Market Analysis, Insights and Forecast - by Position
- 8.1.1. Skew Shaft Gears
- 8.1.1.1. Hypoid Gears
- 8.1.1.2. Worm Gears
- 8.1.2. Intersecting Shaft Gears
- 8.1.2.1. Straight Bevel Gears
- 8.1.2.2. Spiral Bevel Gears
- 8.1.3. Parallel Shaft Gears
- 8.1.3.1. Spur Gears
- 8.1.3.2. Rack and Pinion Gears
- 8.1.3.3. Herringbone Gears
- 8.1.3.4. Helical Gears
- 8.1.1. Skew Shaft Gears
- 8.2. Market Analysis, Insights and Forecast - by Material
- 8.2.1. Ferrous Metals
- 8.2.2. Non-ferrous Metals
- 8.2.3. Other Materials (Composites and Plastics)
- 8.3. Market Analysis, Insights and Forecast - by Application
- 8.3.1. Steering Systems
- 8.3.2. Differential Systems
- 8.3.3. Transmission Systems
- 8.3.3.1. Manual
- 8.3.3.2. Automatic
- 8.1. Market Analysis, Insights and Forecast - by Position
- 9. Latin America Automotive Gear Market Analysis, Insights and Forecast, 2019-2031
- 9.1. Market Analysis, Insights and Forecast - by Position
- 9.1.1. Skew Shaft Gears
- 9.1.1.1. Hypoid Gears
- 9.1.1.2. Worm Gears
- 9.1.2. Intersecting Shaft Gears
- 9.1.2.1. Straight Bevel Gears
- 9.1.2.2. Spiral Bevel Gears
- 9.1.3. Parallel Shaft Gears
- 9.1.3.1. Spur Gears
- 9.1.3.2. Rack and Pinion Gears
- 9.1.3.3. Herringbone Gears
- 9.1.3.4. Helical Gears
- 9.1.1. Skew Shaft Gears
- 9.2. Market Analysis, Insights and Forecast - by Material
- 9.2.1. Ferrous Metals
- 9.2.2. Non-ferrous Metals
- 9.2.3. Other Materials (Composites and Plastics)
- 9.3. Market Analysis, Insights and Forecast - by Application
- 9.3.1. Steering Systems
- 9.3.2. Differential Systems
- 9.3.3. Transmission Systems
- 9.3.3.1. Manual
- 9.3.3.2. Automatic
- 9.1. Market Analysis, Insights and Forecast - by Position
- 10. Middle East and Africa Automotive Gear Market Analysis, Insights and Forecast, 2019-2031
- 10.1. Market Analysis, Insights and Forecast - by Position
- 10.1.1. Skew Shaft Gears
- 10.1.1.1. Hypoid Gears
- 10.1.1.2. Worm Gears
- 10.1.2. Intersecting Shaft Gears
- 10.1.2.1. Straight Bevel Gears
- 10.1.2.2. Spiral Bevel Gears
- 10.1.3. Parallel Shaft Gears
- 10.1.3.1. Spur Gears
- 10.1.3.2. Rack and Pinion Gears
- 10.1.3.3. Herringbone Gears
- 10.1.3.4. Helical Gears
- 10.1.1. Skew Shaft Gears
- 10.2. Market Analysis, Insights and Forecast - by Material
- 10.2.1. Ferrous Metals
- 10.2.2. Non-ferrous Metals
- 10.2.3. Other Materials (Composites and Plastics)
- 10.3. Market Analysis, Insights and Forecast - by Application
- 10.3.1. Steering Systems
- 10.3.2. Differential Systems
- 10.3.3. Transmission Systems
- 10.3.3.1. Manual
- 10.3.3.2. Automatic
- 10.1. Market Analysis, Insights and Forecast - by Position
- 11. North America Automotive Gear Market Analysis, Insights and Forecast, 2019-2031
- 11.1. Market Analysis, Insights and Forecast - By Country/Sub-region
- 11.1.1 United States
- 11.1.2 Canada
- 11.1.3 Rest of North America
- 12. Europe Automotive Gear Market Analysis, Insights and Forecast, 2019-2031
- 12.1. Market Analysis, Insights and Forecast - By Country/Sub-region
- 12.1.1 Germany
- 12.1.2 United Kingdom
- 12.1.3 France
- 12.1.4 Italy
- 12.1.5 Rest of Europe
- 13. Asia Pacific Automotive Gear Market Analysis, Insights and Forecast, 2019-2031
- 13.1. Market Analysis, Insights and Forecast - By Country/Sub-region
- 13.1.1 China
- 13.1.2 Japan
- 13.1.3 India
- 13.1.4 South Korea
- 13.1.5 Rest of Asia Pacific
- 14. Latin America Automotive Gear Market Analysis, Insights and Forecast, 2019-2031
- 14.1. Market Analysis, Insights and Forecast - By Country/Sub-region
- 14.1.1 Brazil
- 14.1.2 Argentina
- 14.1.3 Mexico
- 14.1.4 Rest of South America
- 15. Middle East and Africa Automotive Gear Market Analysis, Insights and Forecast, 2019-2031
- 15.1. Market Analysis, Insights and Forecast - By Country/Sub-region
- 15.1.1 United Arab Emirates
- 15.1.2 South Africa
- 15.1.3 Rest of Middle East and Africa
- 16. Competitive Analysis
- 16.1. Global Market Share Analysis 2024
- 16.2. Company Profiles
- 16.2.1 Bharat Gears Ltd
- 16.2.1.1. Overview
- 16.2.1.2. Products
- 16.2.1.3. SWOT Analysis
- 16.2.1.4. Recent Developments
- 16.2.1.5. Financials (Based on Availability)
- 16.2.2 Gleason Plastic Gears
- 16.2.2.1. Overview
- 16.2.2.2. Products
- 16.2.2.3. SWOT Analysis
- 16.2.2.4. Recent Developments
- 16.2.2.5. Financials (Based on Availability)
- 16.2.3 Showa Corporation
- 16.2.3.1. Overview
- 16.2.3.2. Products
- 16.2.3.3. SWOT Analysis
- 16.2.3.4. Recent Developments
- 16.2.3.5. Financials (Based on Availability)
- 16.2.4 GKN PLC
- 16.2.4.1. Overview
- 16.2.4.2. Products
- 16.2.4.3. SWOT Analysis
- 16.2.4.4. Recent Developments
- 16.2.4.5. Financials (Based on Availability)
- 16.2.5 RSB Global
- 16.2.5.1. Overview
- 16.2.5.2. Products
- 16.2.5.3. SWOT Analysis
- 16.2.5.4. Recent Developments
- 16.2.5.5. Financials (Based on Availability)
- 16.2.6 Cone Drive
- 16.2.6.1. Overview
- 16.2.6.2. Products
- 16.2.6.3. SWOT Analysis
- 16.2.6.4. Recent Developments
- 16.2.6.5. Financials (Based on Availability)
- 16.2.7 American Axle & Manufacturing Holdings Inc
- 16.2.7.1. Overview
- 16.2.7.2. Products
- 16.2.7.3. SWOT Analysis
- 16.2.7.4. Recent Developments
- 16.2.7.5. Financials (Based on Availability)
- 16.2.8 Dynamatic Technologies Limited
- 16.2.8.1. Overview
- 16.2.8.2. Products
- 16.2.8.3. SWOT Analysis
- 16.2.8.4. Recent Developments
- 16.2.8.5. Financials (Based on Availability)
- 16.2.9 IMS Gear SE & Co KGaA
- 16.2.9.1. Overview
- 16.2.9.2. Products
- 16.2.9.3. SWOT Analysis
- 16.2.9.4. Recent Developments
- 16.2.9.5. Financials (Based on Availability)
- 16.2.10 AmTech International
- 16.2.10.1. Overview
- 16.2.10.2. Products
- 16.2.10.3. SWOT Analysis
- 16.2.10.4. Recent Developments
- 16.2.10.5. Financials (Based on Availability)
- 16.2.11 Robert Bosch GmbH
- 16.2.11.1. Overview
- 16.2.11.2. Products
- 16.2.11.3. SWOT Analysis
- 16.2.11.4. Recent Developments
- 16.2.11.5. Financials (Based on Availability)
- 16.2.12 ZF Friedrichshafen AG*List Not Exhaustive
- 16.2.12.1. Overview
- 16.2.12.2. Products
- 16.2.12.3. SWOT Analysis
- 16.2.12.4. Recent Developments
- 16.2.12.5. Financials (Based on Availability)
- 16.2.13 Taiwan United Gear Co Ltd
- 16.2.13.1. Overview
- 16.2.13.2. Products
- 16.2.13.3. SWOT Analysis
- 16.2.13.4. Recent Developments
- 16.2.13.5. Financials (Based on Availability)
- 16.2.14 Franz Morat Group
- 16.2.14.1. Overview
- 16.2.14.2. Products
- 16.2.14.3. SWOT Analysis
- 16.2.14.4. Recent Developments
- 16.2.14.5. Financials (Based on Availability)
- 16.2.15 Universal Auto Gears LLP
- 16.2.15.1. Overview
- 16.2.15.2. Products
- 16.2.15.3. SWOT Analysis
- 16.2.15.4. Recent Developments
- 16.2.15.5. Financials (Based on Availability)
- 16.2.1 Bharat Gears Ltd
List of Figures
- Figure 1: Global Automotive Gear Market Revenue Breakdown (Million, %) by Region 2024 & 2032
- Figure 2: North America Automotive Gear Market Revenue (Million), by Country 2024 & 2032
- Figure 3: North America Automotive Gear Market Revenue Share (%), by Country 2024 & 2032
- Figure 4: Europe Automotive Gear Market Revenue (Million), by Country 2024 & 2032
- Figure 5: Europe Automotive Gear Market Revenue Share (%), by Country 2024 & 2032
- Figure 6: Asia Pacific Automotive Gear Market Revenue (Million), by Country 2024 & 2032
- Figure 7: Asia Pacific Automotive Gear Market Revenue Share (%), by Country 2024 & 2032
- Figure 8: Latin America Automotive Gear Market Revenue (Million), by Country 2024 & 2032
- Figure 9: Latin America Automotive Gear Market Revenue Share (%), by Country 2024 & 2032
- Figure 10: Middle East and Africa Automotive Gear Market Revenue (Million), by Country 2024 & 2032
- Figure 11: Middle East and Africa Automotive Gear Market Revenue Share (%), by Country 2024 & 2032
- Figure 12: North America Automotive Gear Market Revenue (Million), by Position 2024 & 2032
- Figure 13: North America Automotive Gear Market Revenue Share (%), by Position 2024 & 2032
- Figure 14: North America Automotive Gear Market Revenue (Million), by Material 2024 & 2032
- Figure 15: North America Automotive Gear Market Revenue Share (%), by Material 2024 & 2032
- Figure 16: North America Automotive Gear Market Revenue (Million), by Application 2024 & 2032
- Figure 17: North America Automotive Gear Market Revenue Share (%), by Application 2024 & 2032
- Figure 18: North America Automotive Gear Market Revenue (Million), by Country 2024 & 2032
- Figure 19: North America Automotive Gear Market Revenue Share (%), by Country 2024 & 2032
- Figure 20: Europe Automotive Gear Market Revenue (Million), by Position 2024 & 2032
- Figure 21: Europe Automotive Gear Market Revenue Share (%), by Position 2024 & 2032
- Figure 22: Europe Automotive Gear Market Revenue (Million), by Material 2024 & 2032
- Figure 23: Europe Automotive Gear Market Revenue Share (%), by Material 2024 & 2032
- Figure 24: Europe Automotive Gear Market Revenue (Million), by Application 2024 & 2032
- Figure 25: Europe Automotive Gear Market Revenue Share (%), by Application 2024 & 2032
- Figure 26: Europe Automotive Gear Market Revenue (Million), by Country 2024 & 2032
- Figure 27: Europe Automotive Gear Market Revenue Share (%), by Country 2024 & 2032
- Figure 28: Asia Pacific Automotive Gear Market Revenue (Million), by Position 2024 & 2032
- Figure 29: Asia Pacific Automotive Gear Market Revenue Share (%), by Position 2024 & 2032
- Figure 30: Asia Pacific Automotive Gear Market Revenue (Million), by Material 2024 & 2032
- Figure 31: Asia Pacific Automotive Gear Market Revenue Share (%), by Material 2024 & 2032
- Figure 32: Asia Pacific Automotive Gear Market Revenue (Million), by Application 2024 & 2032
- Figure 33: Asia Pacific Automotive Gear Market Revenue Share (%), by Application 2024 & 2032
- Figure 34: Asia Pacific Automotive Gear Market Revenue (Million), by Country 2024 & 2032
- Figure 35: Asia Pacific Automotive Gear Market Revenue Share (%), by Country 2024 & 2032
- Figure 36: Latin America Automotive Gear Market Revenue (Million), by Position 2024 & 2032
- Figure 37: Latin America Automotive Gear Market Revenue Share (%), by Position 2024 & 2032
- Figure 38: Latin America Automotive Gear Market Revenue (Million), by Material 2024 & 2032
- Figure 39: Latin America Automotive Gear Market Revenue Share (%), by Material 2024 & 2032
- Figure 40: Latin America Automotive Gear Market Revenue (Million), by Application 2024 & 2032
- Figure 41: Latin America Automotive Gear Market Revenue Share (%), by Application 2024 & 2032
- Figure 42: Latin America Automotive Gear Market Revenue (Million), by Country 2024 & 2032
- Figure 43: Latin America Automotive Gear Market Revenue Share (%), by Country 2024 & 2032
- Figure 44: Middle East and Africa Automotive Gear Market Revenue (Million), by Position 2024 & 2032
- Figure 45: Middle East and Africa Automotive Gear Market Revenue Share (%), by Position 2024 & 2032
- Figure 46: Middle East and Africa Automotive Gear Market Revenue (Million), by Material 2024 & 2032
- Figure 47: Middle East and Africa Automotive Gear Market Revenue Share (%), by Material 2024 & 2032
- Figure 48: Middle East and Africa Automotive Gear Market Revenue (Million), by Application 2024 & 2032
- Figure 49: Middle East and Africa Automotive Gear Market Revenue Share (%), by Application 2024 & 2032
- Figure 50: Middle East and Africa Automotive Gear Market Revenue (Million), by Country 2024 & 2032
- Figure 51: Middle East and Africa Automotive Gear Market Revenue Share (%), by Country 2024 & 2032
List of Tables
- Table 1: Global Automotive Gear Market Revenue Million Forecast, by Region 2019 & 2032
- Table 2: Global Automotive Gear Market Revenue Million Forecast, by Position 2019 & 2032
- Table 3: Global Automotive Gear Market Revenue Million Forecast, by Material 2019 & 2032
- Table 4: Global Automotive Gear Market Revenue Million Forecast, by Application 2019 & 2032
- Table 5: Global Automotive Gear Market Revenue Million Forecast, by Region 2019 & 2032
- Table 6: Global Automotive Gear Market Revenue Million Forecast, by Country 2019 & 2032
- Table 7: United States Automotive Gear Market Revenue (Million) Forecast, by Application 2019 & 2032
- Table 8: Canada Automotive Gear Market Revenue (Million) Forecast, by Application 2019 & 2032
- Table 9: Rest of North America Automotive Gear Market Revenue (Million) Forecast, by Application 2019 & 2032
- Table 10: Global Automotive Gear Market Revenue Million Forecast, by Country 2019 & 2032
- Table 11: Germany Automotive Gear Market Revenue (Million) Forecast, by Application 2019 & 2032
- Table 12: United Kingdom Automotive Gear Market Revenue (Million) Forecast, by Application 2019 & 2032
- Table 13: France Automotive Gear Market Revenue (Million) Forecast, by Application 2019 & 2032
- Table 14: Italy Automotive Gear Market Revenue (Million) Forecast, by Application 2019 & 2032
- Table 15: Rest of Europe Automotive Gear Market Revenue (Million) Forecast, by Application 2019 & 2032
- Table 16: Global Automotive Gear Market Revenue Million Forecast, by Country 2019 & 2032
- Table 17: China Automotive Gear Market Revenue (Million) Forecast, by Application 2019 & 2032
- Table 18: Japan Automotive Gear Market Revenue (Million) Forecast, by Application 2019 & 2032
- Table 19: India Automotive Gear Market Revenue (Million) Forecast, by Application 2019 & 2032
- Table 20: South Korea Automotive Gear Market Revenue (Million) Forecast, by Application 2019 & 2032
- Table 21: Rest of Asia Pacific Automotive Gear Market Revenue (Million) Forecast, by Application 2019 & 2032
- Table 22: Global Automotive Gear Market Revenue Million Forecast, by Country 2019 & 2032
- Table 23: Brazil Automotive Gear Market Revenue (Million) Forecast, by Application 2019 & 2032
- Table 24: Argentina Automotive Gear Market Revenue (Million) Forecast, by Application 2019 & 2032
- Table 25: Mexico Automotive Gear Market Revenue (Million) Forecast, by Application 2019 & 2032
- Table 26: Rest of South America Automotive Gear Market Revenue (Million) Forecast, by Application 2019 & 2032
- Table 27: Global Automotive Gear Market Revenue Million Forecast, by Country 2019 & 2032
- Table 28: United Arab Emirates Automotive Gear Market Revenue (Million) Forecast, by Application 2019 & 2032
- Table 29: South Africa Automotive Gear Market Revenue (Million) Forecast, by Application 2019 & 2032
- Table 30: Rest of Middle East and Africa Automotive Gear Market Revenue (Million) Forecast, by Application 2019 & 2032
- Table 31: Global Automotive Gear Market Revenue Million Forecast, by Position 2019 & 2032
- Table 32: Global Automotive Gear Market Revenue Million Forecast, by Material 2019 & 2032
- Table 33: Global Automotive Gear Market Revenue Million Forecast, by Application 2019 & 2032
- Table 34: Global Automotive Gear Market Revenue Million Forecast, by Country 2019 & 2032
- Table 35: United States Automotive Gear Market Revenue (Million) Forecast, by Application 2019 & 2032
- Table 36: Canada Automotive Gear Market Revenue (Million) Forecast, by Application 2019 & 2032
- Table 37: Rest of North America Automotive Gear Market Revenue (Million) Forecast, by Application 2019 & 2032
- Table 38: Global Automotive Gear Market Revenue Million Forecast, by Position 2019 & 2032
- Table 39: Global Automotive Gear Market Revenue Million Forecast, by Material 2019 & 2032
- Table 40: Global Automotive Gear Market Revenue Million Forecast, by Application 2019 & 2032
- Table 41: Global Automotive Gear Market Revenue Million Forecast, by Country 2019 & 2032
- Table 42: Germany Automotive Gear Market Revenue (Million) Forecast, by Application 2019 & 2032
- Table 43: United Kingdom Automotive Gear Market Revenue (Million) Forecast, by Application 2019 & 2032
- Table 44: France Automotive Gear Market Revenue (Million) Forecast, by Application 2019 & 2032
- Table 45: Italy Automotive Gear Market Revenue (Million) Forecast, by Application 2019 & 2032
- Table 46: Rest of Europe Automotive Gear Market Revenue (Million) Forecast, by Application 2019 & 2032
- Table 47: Global Automotive Gear Market Revenue Million Forecast, by Position 2019 & 2032
- Table 48: Global Automotive Gear Market Revenue Million Forecast, by Material 2019 & 2032
- Table 49: Global Automotive Gear Market Revenue Million Forecast, by Application 2019 & 2032
- Table 50: Global Automotive Gear Market Revenue Million Forecast, by Country 2019 & 2032
- Table 51: China Automotive Gear Market Revenue (Million) Forecast, by Application 2019 & 2032
- Table 52: Japan Automotive Gear Market Revenue (Million) Forecast, by Application 2019 & 2032
- Table 53: India Automotive Gear Market Revenue (Million) Forecast, by Application 2019 & 2032
- Table 54: South Korea Automotive Gear Market Revenue (Million) Forecast, by Application 2019 & 2032
- Table 55: Rest of Asia Pacific Automotive Gear Market Revenue (Million) Forecast, by Application 2019 & 2032
- Table 56: Global Automotive Gear Market Revenue Million Forecast, by Position 2019 & 2032
- Table 57: Global Automotive Gear Market Revenue Million Forecast, by Material 2019 & 2032
- Table 58: Global Automotive Gear Market Revenue Million Forecast, by Application 2019 & 2032
- Table 59: Global Automotive Gear Market Revenue Million Forecast, by Country 2019 & 2032
- Table 60: Brazil Automotive Gear Market Revenue (Million) Forecast, by Application 2019 & 2032
- Table 61: Argentina Automotive Gear Market Revenue (Million) Forecast, by Application 2019 & 2032
- Table 62: Mexico Automotive Gear Market Revenue (Million) Forecast, by Application 2019 & 2032
- Table 63: Rest of South America Automotive Gear Market Revenue (Million) Forecast, by Application 2019 & 2032
- Table 64: Global Automotive Gear Market Revenue Million Forecast, by Position 2019 & 2032
- Table 65: Global Automotive Gear Market Revenue Million Forecast, by Material 2019 & 2032
- Table 66: Global Automotive Gear Market Revenue Million Forecast, by Application 2019 & 2032
- Table 67: Global Automotive Gear Market Revenue Million Forecast, by Country 2019 & 2032
- Table 68: United Arab Emirates Automotive Gear Market Revenue (Million) Forecast, by Application 2019 & 2032
- Table 69: South Africa Automotive Gear Market Revenue (Million) Forecast, by Application 2019 & 2032
- Table 70: Rest of Middle East and Africa Automotive Gear Market Revenue (Million) Forecast, by Application 2019 & 2032
Frequently Asked Questions
1. What is the projected Compound Annual Growth Rate (CAGR) of the Automotive Gear Market?
The projected CAGR is approximately 4.50%.
2. Which companies are prominent players in the Automotive Gear Market?
Key companies in the market include Bharat Gears Ltd, Gleason Plastic Gears, Showa Corporation, GKN PLC, RSB Global, Cone Drive, American Axle & Manufacturing Holdings Inc, Dynamatic Technologies Limited, IMS Gear SE & Co KGaA, AmTech International, Robert Bosch GmbH, ZF Friedrichshafen AG*List Not Exhaustive, Taiwan United Gear Co Ltd, Franz Morat Group, Universal Auto Gears LLP.
3. What are the main segments of the Automotive Gear Market?
The market segments include Position, Material, Application.
4. Can you provide details about the market size?
The market size is estimated to be USD 4.70 Million as of 2022.
5. What are some drivers contributing to market growth?
Rise in Vehicle Electrification.
6. What are the notable trends driving market growth?
Parallel Gear Shaft is Expected to Dominate the Market during Forecast Period.
7. Are there any restraints impacting market growth?
The Cost of Raw Materials Used in the Manufacturing of Switches is High.
8. Can you provide examples of recent developments in the market?
In September 2021, ZF announced the integration of the MICO brand and new products at MINExpo 2021. The company has also launched several new products, including a next-generation Redulus4F Industrial Gearbox Series and Advanced Serviceability Solutions based on the ProVID Condition Monitoring System, which features an extended global support network that provides rapid detection and maintenance quickly and efficiently.
9. What pricing options are available for accessing the report?
Pricing options include single-user, multi-user, and enterprise licenses priced at USD 4750, USD 5250, and USD 8750 respectively.
10. Is the market size provided in terms of value or volume?
The market size is provided in terms of value, measured in Million.
11. Are there any specific market keywords associated with the report?
Yes, the market keyword associated with the report is "Automotive Gear Market," which aids in identifying and referencing the specific market segment covered.
12. How do I determine which pricing option suits my needs best?
The pricing options vary based on user requirements and access needs. Individual users may opt for single-user licenses, while businesses requiring broader access may choose multi-user or enterprise licenses for cost-effective access to the report.
13. Are there any additional resources or data provided in the Automotive Gear Market report?
While the report offers comprehensive insights, it's advisable to review the specific contents or supplementary materials provided to ascertain if additional resources or data are available.
14. How can I stay updated on further developments or reports in the Automotive Gear Market?
To stay informed about further developments, trends, and reports in the Automotive Gear Market, consider subscribing to industry newsletters, following relevant companies and organizations, or regularly checking reputable industry news sources and publications.
Methodology
Step 1 - Identification of Relevant Samples Size from Population Database


Step 2 - Approaches for Defining Global Market Size (Value, Volume* & Price*)

Note*: In applicable scenarios
Step 3 - Data Sources
Primary Research
- Web Analytics
- Survey Reports
- Research Institute
- Latest Research Reports
- Opinion Leaders
Secondary Research
- Annual Reports
- White Paper
- Latest Press Release
- Industry Association
- Paid Database
- Investor Presentations

Step 4 - Data Triangulation
Involves using different sources of information in order to increase the validity of a study
These sources are likely to be stakeholders in a program - participants, other researchers, program staff, other community members, and so on.
Then we put all data in single framework & apply various statistical tools to find out the dynamic on the market.
During the analysis stage, feedback from the stakeholder groups would be compared to determine areas of agreement as well as areas of divergence


