
Key Insights
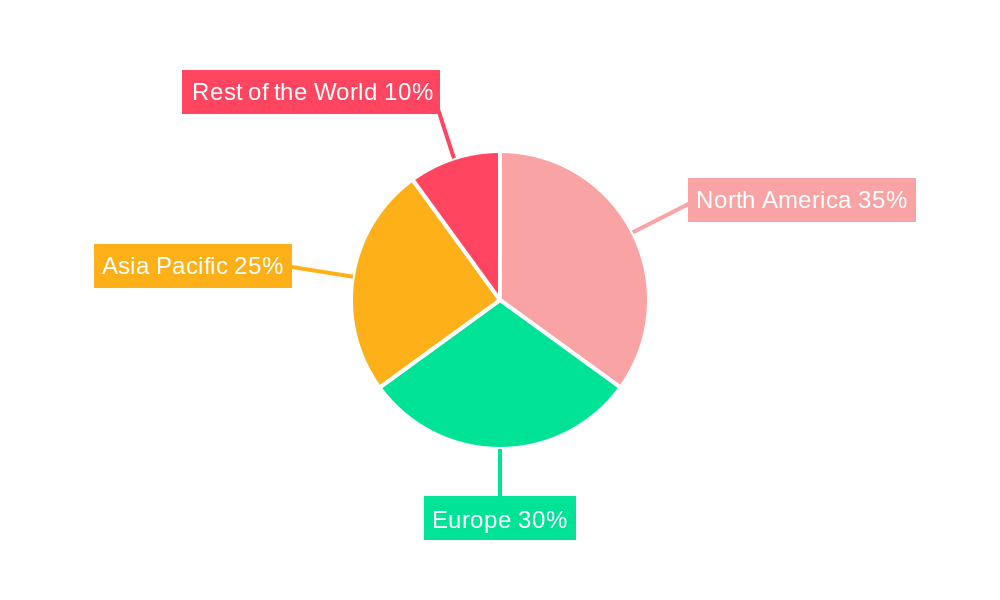
The automotive display market is experiencing robust growth, driven by increasing demand for advanced driver-assistance systems (ADAS), infotainment features, and enhanced in-car user experiences. The market's Compound Annual Growth Rate (CAGR) exceeding 6% signifies a significant expansion projected through 2033. Key drivers include the rising adoption of larger, higher-resolution displays, the integration of sophisticated display technologies like OLED and mini-LED for superior visuals and improved energy efficiency, and the proliferation of connected car features. The shift towards electric vehicles (EVs) further fuels this growth, as EVs often incorporate larger and more advanced display systems to showcase vehicle information and entertainment options. Segment-wise, center stack displays are currently dominating the market due to their central role in infotainment and vehicle control, followed by instrument cluster displays and head-up displays (HUDs), which are gaining traction with their ability to project crucial driving information directly onto the windshield. The market is geographically diverse, with North America and Europe representing significant revenue contributors, driven by high vehicle ownership and technological advancements. Asia Pacific is poised for rapid growth in the coming years, fueled by increasing car production and rising disposable incomes.
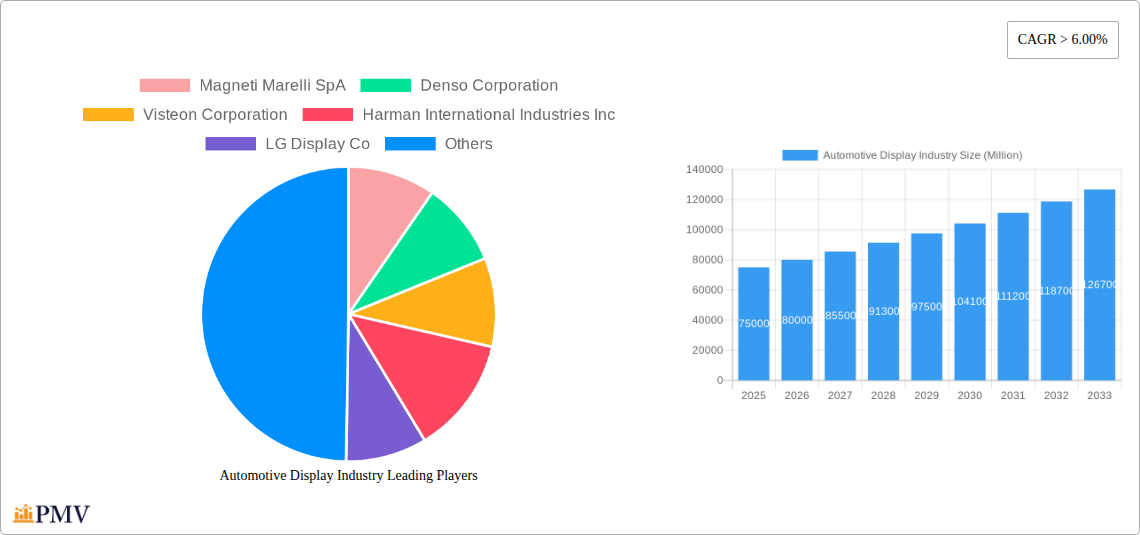
Competition in the automotive display market is intense, with established players like Magneti Marelli, Denso, Visteon, and Harman International competing alongside prominent display technology manufacturers such as LG Display and Panasonic. These companies are actively investing in research and development to enhance display technologies and functionalities, including augmented reality (AR) and virtual reality (VR) integration, to provide more engaging and intuitive user experiences. Despite these positive trends, market growth might face some restraints, such as the rising cost of advanced display technologies and the potential supply chain disruptions impacting production. Nevertheless, the long-term outlook for the automotive display market remains extremely positive, fueled by technological innovation and the consistent evolution of the automotive landscape. The increasing sophistication of displays is not merely about aesthetics; it's a crucial element in enhancing safety, comfort, and the overall driving experience.
This comprehensive report provides a detailed analysis of the Automotive Display Industry, encompassing market size, growth projections, competitive dynamics, and key technological advancements from 2019 to 2033. The report covers a range of display types, including Center Stack Displays, Instrument Cluster Displays, Head-Up Displays (HUDs), and Rear Seat Entertainment Displays, utilizing technologies such as LCD and OLED. With a focus on key players like Magneti Marelli SpA, Denso Corporation, Visteon Corporation, Harman International Industries Inc, LG Display Co, Nippon Seiki Co Ltd, Continental AG, Robert Bosch GmbH, Yazaki Corporation, and Panasonic Corporation, this report is an essential resource for industry professionals, investors, and strategists. The base year for this report is 2025, with estimations provided for 2025 and forecasts spanning from 2025 to 2033.
Automotive Display Industry Market Structure & Competitive Dynamics
The Automotive Display industry exhibits a moderately concentrated market structure, with a handful of major players controlling a significant portion of the global market share. The top 10 companies likely account for over 60% of the overall revenue in 2025. However, the presence of several smaller, specialized companies fosters innovation and competition. The industry is characterized by a complex interplay of factors influencing its dynamics:
Market Concentration: The market is concentrated, with the top players holding significant market share. Precise figures are difficult to obtain without proprietary data; however, a reasonable estimation of the top 10 companies holding 60-70% market share in 2025 appears valid. This concentration is primarily driven by economies of scale and technological expertise.
Innovation Ecosystems: A vibrant ecosystem of technology providers, research institutions, and automotive OEMs drives continuous innovation in display technologies, resulting in advancements in resolution, brightness, and integration with other vehicle systems. The value of M&A deals in the past 5 years is estimated to be around $XX Million, showing a substantial investment in technological advancement.
Regulatory Frameworks: Government regulations concerning safety standards, emissions, and fuel efficiency indirectly influence the automotive display market. Stringent safety regulations propel demand for advanced driver-assistance systems (ADAS) that rely heavily on high-quality displays.
Product Substitutes: While direct substitutes are limited, alternative solutions like augmented reality (AR) overlays and projected displays present potential long-term competitive threats.
End-User Trends: The increasing demand for enhanced infotainment systems, driver assistance features, and connected car technologies fuels the growth of the automotive display market. Consumers prioritize features like large screen sizes, high resolution, intuitive user interfaces, and improved visuals.
M&A Activities: Mergers and acquisitions contribute significantly to market consolidation and technological advancements. Deals involving smaller specialized companies are common, with deal values varying widely depending on the size and technological expertise of the target company.
Automotive Display Industry Industry Trends & Insights
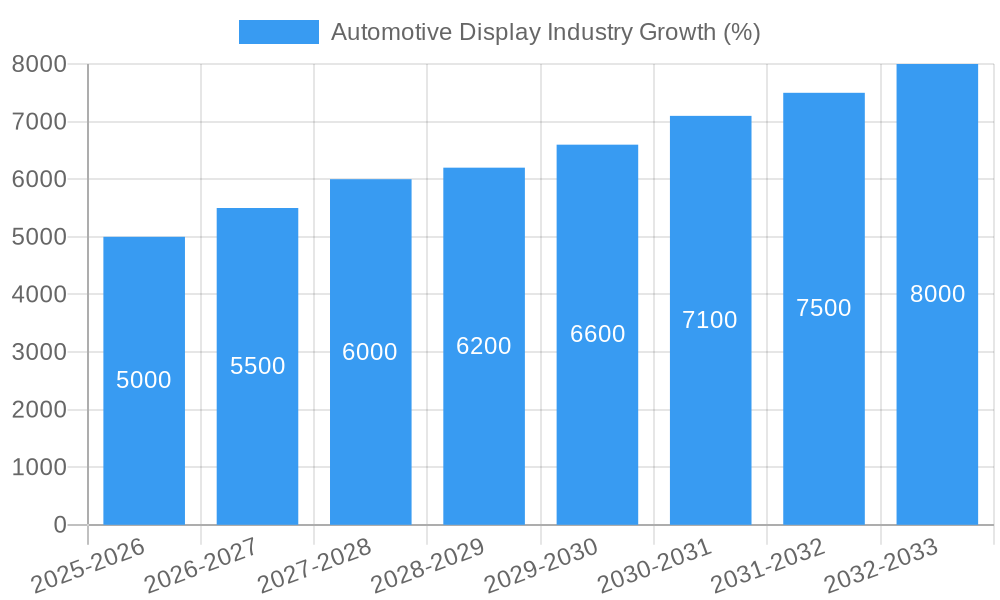
The automotive display market is experiencing robust growth driven by several key factors. The increasing integration of advanced driver-assistance systems (ADAS) and infotainment systems in vehicles is a significant driver of market expansion. Consumer preference for larger, higher-resolution displays, coupled with technological advancements in display technologies (such as OLED and mini-LED), is further propelling market growth. The CAGR for the forecast period (2025-2033) is estimated to be around 8-10%, indicating a healthy growth trajectory. Market penetration of advanced display technologies like OLED is expected to increase significantly during the forecast period, exceeding 20% by 2033.
Technological disruptions, particularly in areas like augmented reality (AR) and mixed reality (MR) head-up displays, are reshaping the competitive landscape. The increasing use of artificial intelligence (AI) for enhanced user experience and personalized settings is also influencing market trends. The shift toward electric vehicles (EVs) and autonomous driving is driving demand for larger and more complex display systems. Competitive dynamics remain intense, with major players focusing on innovation, partnerships, and strategic acquisitions to gain a competitive edge. The industry is witnessing a trend toward consolidation, with larger companies acquiring smaller players to expand their product portfolios and technological capabilities.
Dominant Markets & Segments in Automotive Display Industry
Leading Regions/Countries: The North American and European markets currently dominate the automotive display industry, driven by high vehicle production rates, strong consumer demand for advanced features, and high disposable incomes. However, the Asia-Pacific region is experiencing rapid growth and is expected to become a significant market in the coming years, driven by increasing vehicle production and economic growth in countries such as China and India.
Dominant Product Types:
Center Stack Displays: This segment holds a significant market share, driven by its central role in vehicle infotainment and driver interaction. High demand for larger screen sizes and enhanced features contributes to its dominance.
Instrument Cluster Displays: This segment is vital for displaying crucial driving information. Advancements in display technologies are leading to more sophisticated instrument clusters.
Head-Up Displays (HUDs): The HUD segment is witnessing significant growth, particularly in premium vehicles, due to its ability to project critical information onto the windshield, enhancing driver safety and convenience. The recent expansion of Nippon Seiki's HUD plant in Poland exemplifies this market's momentum.
Rear Seat Entertainment Displays: This segment is experiencing growth driven by increased demand for rear-seat passenger entertainment, especially in SUVs and luxury vehicles.
Dominant Display Technologies:
LCD: LCD remains the dominant display technology due to its cost-effectiveness and maturity. However, its market share is gradually declining as OLED gains traction.
OLED: OLED is gaining popularity due to its superior image quality, deeper blacks, and wider viewing angles. Its higher cost currently limits its wider adoption.
Key Drivers of Regional/Segment Dominance:
Economic Policies: Government incentives for vehicle electrification and autonomous driving technologies are stimulating the growth of the automotive display market.
Infrastructure: The development of advanced manufacturing and logistics infrastructure is supporting the growth of the industry.
Consumer Preferences: Growing consumer demand for premium features and advanced technology drives the market for higher-quality displays.
Automotive Display Industry Product Innovations
Recent innovations in automotive displays are focused on enhancing user experience, safety, and integration with other vehicle systems. Advances in display technologies, such as mini-LED and microLED, are leading to higher resolutions, increased brightness, and improved power efficiency. The integration of augmented reality (AR) and haptic feedback is creating more immersive and engaging user experiences. The introduction of flexible displays and curved screens is enabling more design freedom and customization options. New touchless control technologies, such as TouchNetix's aXiom, are changing human-machine interfaces. This continuous innovation ensures a strong competitive landscape focused on delivering more intuitive and safer driving environments.
Report Segmentation & Scope
This report segments the automotive display market by product type (Center Stack Display, Instrument Cluster Display, Head-Up Display, Rear Seat Entertainment Display) and display technology (LCD, OLED). Each segment is analyzed based on its market size, growth rate, and competitive landscape. Growth projections for each segment are provided, considering factors such as technological advancements, consumer preferences, and regulatory changes. The competitive dynamics within each segment are analyzed, considering the market share of key players, their strategies, and their product offerings. The report provides a detailed overview of each segment's current state and its future potential.
Key Drivers of Automotive Display Industry Growth
The Automotive Display industry is experiencing rapid growth due to several key factors:
- Technological Advancements: Continuous improvements in display technologies, such as OLED, mini-LED, and MicroLED, are driving demand for higher-resolution, brighter, and more energy-efficient displays.
- Increased Vehicle Production: The global growth in vehicle production fuels the demand for automotive displays.
- Rising Consumer Demand: Consumers increasingly demand advanced in-car infotainment and driver-assistance systems.
- Government Regulations: Regulations promoting safety features and autonomous driving technologies indirectly stimulate the demand for advanced displays.
Challenges in the Automotive Display Industry Sector
Despite its robust growth, the automotive display industry faces several challenges:
Supply Chain Disruptions: Global supply chain bottlenecks can affect the availability of critical components, causing delays and cost increases. The impact is estimated to be at $XX Million for the year 2024.
Competition: Intense competition among established players and new entrants can put downward pressure on prices and profit margins.
Technological Complexity: The development and manufacturing of advanced display technologies are complex and require significant investment.
Leading Players in the Automotive Display Industry Market
- Denso Corporation
- Visteon Corporation
- Harman International Industries Inc
- LG Display Co
- Nippon Seiki Co Ltd
- Continental AG
- Robert Bosch GmbH
- Yazaki Corporation
- Panasonic Corporation
- Magneti Marelli SpA
Key Developments in Automotive Display Industry Sector
- June 2021: Visteon Company announced a new business win with a North American OEM for its microZone™ display technology.
- May 2022: Faurecia announced its newest perceptual image processing and immersive user experience solutions.
- May 2022: Nippon Seiki Co., Ltd. started production of head-up displays (HUDs) at its new plant in Poland.
- April 2022: TouchNetix announced fully integrated aXiom touchscreen chips offering new 3D sensing capabilities.
Strategic Automotive Display Industry Market Outlook
The automotive display market is poised for significant growth in the coming years, driven by technological advancements, increasing vehicle production, and rising consumer demand. Strategic opportunities exist for companies that can innovate in display technologies, develop integrated solutions, and effectively manage supply chain challenges. The focus on improving user experience, safety features, and connectivity will continue to shape future market trends. Companies that can adapt to evolving consumer preferences and integrate emerging technologies will be best positioned to succeed in this dynamic market.
Automotive Display Industry Segmentation
-
1. Product Type
- 1.1. Center Stack Display
- 1.2. Instrument Cluster Display
- 1.3. Head-Up Display
- 1.4. Rear Seat Entertainment Display
-
2. Display Technology
- 2.1. LCD
- 2.2. OLED
Automotive Display Industry Segmentation By Geography
-
1. North America
- 1.1. United States
- 1.2. Canada
- 1.3. Rest of North America
-
2. Europe
- 2.1. Germany
- 2.2. United Kingdom
- 2.3. France
- 2.4. Rest of Europe
-
3. Asia Pacific
- 3.1. China
- 3.2. Japan
- 3.3. India
- 3.4. South Korea
- 3.5. Rest of Asia Pacific
-
4. Rest of the World
- 4.1. South America
- 4.2. Middle East and Africa
Automotive Display Industry REPORT HIGHLIGHTS
| Aspects | Details |
|---|---|
| Study Period | 2019-2033 |
| Base Year | 2024 |
| Estimated Year | 2025 |
| Forecast Period | 2025-2033 |
| Historical Period | 2019-2024 |
| Growth Rate | CAGR of > 6.00% from 2019-2033 |
| Segmentation |
|
Table of Contents
- 1. Introduction
- 1.1. Research Scope
- 1.2. Market Segmentation
- 1.3. Research Methodology
- 1.4. Definitions and Assumptions
- 2. Executive Summary
- 2.1. Introduction
- 3. Market Dynamics
- 3.1. Introduction
- 3.2. Market Drivers
- 3.2.1. Increasing Demand For Electric School Buses
- 3.3. Market Restrains
- 3.3.1. Uncertainty of The Global Pandemic
- 3.4. Market Trends
- 3.4.1. Increasing Demand of OLED Displays in the Luxury Vehicle is Expected to Witness Faster Growth Rate
- 4. Market Factor Analysis
- 4.1. Porters Five Forces
- 4.2. Supply/Value Chain
- 4.3. PESTEL analysis
- 4.4. Market Entropy
- 4.5. Patent/Trademark Analysis
- 5. Global Automotive Display Industry Analysis, Insights and Forecast, 2019-2031
- 5.1. Market Analysis, Insights and Forecast - by Product Type
- 5.1.1. Center Stack Display
- 5.1.2. Instrument Cluster Display
- 5.1.3. Head-Up Display
- 5.1.4. Rear Seat Entertainment Display
- 5.2. Market Analysis, Insights and Forecast - by Display Technology
- 5.2.1. LCD
- 5.2.2. OLED
- 5.3. Market Analysis, Insights and Forecast - by Region
- 5.3.1. North America
- 5.3.2. Europe
- 5.3.3. Asia Pacific
- 5.3.4. Rest of the World
- 5.1. Market Analysis, Insights and Forecast - by Product Type
- 6. North America Automotive Display Industry Analysis, Insights and Forecast, 2019-2031
- 6.1. Market Analysis, Insights and Forecast - by Product Type
- 6.1.1. Center Stack Display
- 6.1.2. Instrument Cluster Display
- 6.1.3. Head-Up Display
- 6.1.4. Rear Seat Entertainment Display
- 6.2. Market Analysis, Insights and Forecast - by Display Technology
- 6.2.1. LCD
- 6.2.2. OLED
- 6.1. Market Analysis, Insights and Forecast - by Product Type
- 7. Europe Automotive Display Industry Analysis, Insights and Forecast, 2019-2031
- 7.1. Market Analysis, Insights and Forecast - by Product Type
- 7.1.1. Center Stack Display
- 7.1.2. Instrument Cluster Display
- 7.1.3. Head-Up Display
- 7.1.4. Rear Seat Entertainment Display
- 7.2. Market Analysis, Insights and Forecast - by Display Technology
- 7.2.1. LCD
- 7.2.2. OLED
- 7.1. Market Analysis, Insights and Forecast - by Product Type
- 8. Asia Pacific Automotive Display Industry Analysis, Insights and Forecast, 2019-2031
- 8.1. Market Analysis, Insights and Forecast - by Product Type
- 8.1.1. Center Stack Display
- 8.1.2. Instrument Cluster Display
- 8.1.3. Head-Up Display
- 8.1.4. Rear Seat Entertainment Display
- 8.2. Market Analysis, Insights and Forecast - by Display Technology
- 8.2.1. LCD
- 8.2.2. OLED
- 8.1. Market Analysis, Insights and Forecast - by Product Type
- 9. Rest of the World Automotive Display Industry Analysis, Insights and Forecast, 2019-2031
- 9.1. Market Analysis, Insights and Forecast - by Product Type
- 9.1.1. Center Stack Display
- 9.1.2. Instrument Cluster Display
- 9.1.3. Head-Up Display
- 9.1.4. Rear Seat Entertainment Display
- 9.2. Market Analysis, Insights and Forecast - by Display Technology
- 9.2.1. LCD
- 9.2.2. OLED
- 9.1. Market Analysis, Insights and Forecast - by Product Type
- 10. North America Automotive Display Industry Analysis, Insights and Forecast, 2019-2031
- 10.1. Market Analysis, Insights and Forecast - By Country/Sub-region
- 10.1.1 United States
- 10.1.2 Canada
- 10.1.3 Rest of North America
- 11. Europe Automotive Display Industry Analysis, Insights and Forecast, 2019-2031
- 11.1. Market Analysis, Insights and Forecast - By Country/Sub-region
- 11.1.1 Germany
- 11.1.2 United Kingdom
- 11.1.3 France
- 11.1.4 Rest of Europe
- 12. Asia Pacific Automotive Display Industry Analysis, Insights and Forecast, 2019-2031
- 12.1. Market Analysis, Insights and Forecast - By Country/Sub-region
- 12.1.1 China
- 12.1.2 Japan
- 12.1.3 India
- 12.1.4 South Korea
- 12.1.5 Rest of Asia Pacific
- 13. Rest of the World Automotive Display Industry Analysis, Insights and Forecast, 2019-2031
- 13.1. Market Analysis, Insights and Forecast - By Country/Sub-region
- 13.1.1 South America
- 13.1.2 Middle East and Africa
- 14. Competitive Analysis
- 14.1. Global Market Share Analysis 2024
- 14.2. Company Profiles
- 14.2.1 Magneti Marelli SpA
- 14.2.1.1. Overview
- 14.2.1.2. Products
- 14.2.1.3. SWOT Analysis
- 14.2.1.4. Recent Developments
- 14.2.1.5. Financials (Based on Availability)
- 14.2.2 Denso Corporation
- 14.2.2.1. Overview
- 14.2.2.2. Products
- 14.2.2.3. SWOT Analysis
- 14.2.2.4. Recent Developments
- 14.2.2.5. Financials (Based on Availability)
- 14.2.3 Visteon Corporation
- 14.2.3.1. Overview
- 14.2.3.2. Products
- 14.2.3.3. SWOT Analysis
- 14.2.3.4. Recent Developments
- 14.2.3.5. Financials (Based on Availability)
- 14.2.4 Harman International Industries Inc
- 14.2.4.1. Overview
- 14.2.4.2. Products
- 14.2.4.3. SWOT Analysis
- 14.2.4.4. Recent Developments
- 14.2.4.5. Financials (Based on Availability)
- 14.2.5 LG Display Co
- 14.2.5.1. Overview
- 14.2.5.2. Products
- 14.2.5.3. SWOT Analysis
- 14.2.5.4. Recent Developments
- 14.2.5.5. Financials (Based on Availability)
- 14.2.6 Nippon Seiki Co Lt
- 14.2.6.1. Overview
- 14.2.6.2. Products
- 14.2.6.3. SWOT Analysis
- 14.2.6.4. Recent Developments
- 14.2.6.5. Financials (Based on Availability)
- 14.2.7 Continental AG
- 14.2.7.1. Overview
- 14.2.7.2. Products
- 14.2.7.3. SWOT Analysis
- 14.2.7.4. Recent Developments
- 14.2.7.5. Financials (Based on Availability)
- 14.2.8 Robert Bosch GmbH
- 14.2.8.1. Overview
- 14.2.8.2. Products
- 14.2.8.3. SWOT Analysis
- 14.2.8.4. Recent Developments
- 14.2.8.5. Financials (Based on Availability)
- 14.2.9 Yazaki Corporation
- 14.2.9.1. Overview
- 14.2.9.2. Products
- 14.2.9.3. SWOT Analysis
- 14.2.9.4. Recent Developments
- 14.2.9.5. Financials (Based on Availability)
- 14.2.10 Panasonic Corporation
- 14.2.10.1. Overview
- 14.2.10.2. Products
- 14.2.10.3. SWOT Analysis
- 14.2.10.4. Recent Developments
- 14.2.10.5. Financials (Based on Availability)
- 14.2.1 Magneti Marelli SpA
List of Figures
- Figure 1: Global Automotive Display Industry Revenue Breakdown (Million, %) by Region 2024 & 2032
- Figure 2: North America Automotive Display Industry Revenue (Million), by Country 2024 & 2032
- Figure 3: North America Automotive Display Industry Revenue Share (%), by Country 2024 & 2032
- Figure 4: Europe Automotive Display Industry Revenue (Million), by Country 2024 & 2032
- Figure 5: Europe Automotive Display Industry Revenue Share (%), by Country 2024 & 2032
- Figure 6: Asia Pacific Automotive Display Industry Revenue (Million), by Country 2024 & 2032
- Figure 7: Asia Pacific Automotive Display Industry Revenue Share (%), by Country 2024 & 2032
- Figure 8: Rest of the World Automotive Display Industry Revenue (Million), by Country 2024 & 2032
- Figure 9: Rest of the World Automotive Display Industry Revenue Share (%), by Country 2024 & 2032
- Figure 10: North America Automotive Display Industry Revenue (Million), by Product Type 2024 & 2032
- Figure 11: North America Automotive Display Industry Revenue Share (%), by Product Type 2024 & 2032
- Figure 12: North America Automotive Display Industry Revenue (Million), by Display Technology 2024 & 2032
- Figure 13: North America Automotive Display Industry Revenue Share (%), by Display Technology 2024 & 2032
- Figure 14: North America Automotive Display Industry Revenue (Million), by Country 2024 & 2032
- Figure 15: North America Automotive Display Industry Revenue Share (%), by Country 2024 & 2032
- Figure 16: Europe Automotive Display Industry Revenue (Million), by Product Type 2024 & 2032
- Figure 17: Europe Automotive Display Industry Revenue Share (%), by Product Type 2024 & 2032
- Figure 18: Europe Automotive Display Industry Revenue (Million), by Display Technology 2024 & 2032
- Figure 19: Europe Automotive Display Industry Revenue Share (%), by Display Technology 2024 & 2032
- Figure 20: Europe Automotive Display Industry Revenue (Million), by Country 2024 & 2032
- Figure 21: Europe Automotive Display Industry Revenue Share (%), by Country 2024 & 2032
- Figure 22: Asia Pacific Automotive Display Industry Revenue (Million), by Product Type 2024 & 2032
- Figure 23: Asia Pacific Automotive Display Industry Revenue Share (%), by Product Type 2024 & 2032
- Figure 24: Asia Pacific Automotive Display Industry Revenue (Million), by Display Technology 2024 & 2032
- Figure 25: Asia Pacific Automotive Display Industry Revenue Share (%), by Display Technology 2024 & 2032
- Figure 26: Asia Pacific Automotive Display Industry Revenue (Million), by Country 2024 & 2032
- Figure 27: Asia Pacific Automotive Display Industry Revenue Share (%), by Country 2024 & 2032
- Figure 28: Rest of the World Automotive Display Industry Revenue (Million), by Product Type 2024 & 2032
- Figure 29: Rest of the World Automotive Display Industry Revenue Share (%), by Product Type 2024 & 2032
- Figure 30: Rest of the World Automotive Display Industry Revenue (Million), by Display Technology 2024 & 2032
- Figure 31: Rest of the World Automotive Display Industry Revenue Share (%), by Display Technology 2024 & 2032
- Figure 32: Rest of the World Automotive Display Industry Revenue (Million), by Country 2024 & 2032
- Figure 33: Rest of the World Automotive Display Industry Revenue Share (%), by Country 2024 & 2032
List of Tables
- Table 1: Global Automotive Display Industry Revenue Million Forecast, by Region 2019 & 2032
- Table 2: Global Automotive Display Industry Revenue Million Forecast, by Product Type 2019 & 2032
- Table 3: Global Automotive Display Industry Revenue Million Forecast, by Display Technology 2019 & 2032
- Table 4: Global Automotive Display Industry Revenue Million Forecast, by Region 2019 & 2032
- Table 5: Global Automotive Display Industry Revenue Million Forecast, by Country 2019 & 2032
- Table 6: United States Automotive Display Industry Revenue (Million) Forecast, by Application 2019 & 2032
- Table 7: Canada Automotive Display Industry Revenue (Million) Forecast, by Application 2019 & 2032
- Table 8: Rest of North America Automotive Display Industry Revenue (Million) Forecast, by Application 2019 & 2032
- Table 9: Global Automotive Display Industry Revenue Million Forecast, by Country 2019 & 2032
- Table 10: Germany Automotive Display Industry Revenue (Million) Forecast, by Application 2019 & 2032
- Table 11: United Kingdom Automotive Display Industry Revenue (Million) Forecast, by Application 2019 & 2032
- Table 12: France Automotive Display Industry Revenue (Million) Forecast, by Application 2019 & 2032
- Table 13: Rest of Europe Automotive Display Industry Revenue (Million) Forecast, by Application 2019 & 2032
- Table 14: Global Automotive Display Industry Revenue Million Forecast, by Country 2019 & 2032
- Table 15: China Automotive Display Industry Revenue (Million) Forecast, by Application 2019 & 2032
- Table 16: Japan Automotive Display Industry Revenue (Million) Forecast, by Application 2019 & 2032
- Table 17: India Automotive Display Industry Revenue (Million) Forecast, by Application 2019 & 2032
- Table 18: South Korea Automotive Display Industry Revenue (Million) Forecast, by Application 2019 & 2032
- Table 19: Rest of Asia Pacific Automotive Display Industry Revenue (Million) Forecast, by Application 2019 & 2032
- Table 20: Global Automotive Display Industry Revenue Million Forecast, by Country 2019 & 2032
- Table 21: South America Automotive Display Industry Revenue (Million) Forecast, by Application 2019 & 2032
- Table 22: Middle East and Africa Automotive Display Industry Revenue (Million) Forecast, by Application 2019 & 2032
- Table 23: Global Automotive Display Industry Revenue Million Forecast, by Product Type 2019 & 2032
- Table 24: Global Automotive Display Industry Revenue Million Forecast, by Display Technology 2019 & 2032
- Table 25: Global Automotive Display Industry Revenue Million Forecast, by Country 2019 & 2032
- Table 26: United States Automotive Display Industry Revenue (Million) Forecast, by Application 2019 & 2032
- Table 27: Canada Automotive Display Industry Revenue (Million) Forecast, by Application 2019 & 2032
- Table 28: Rest of North America Automotive Display Industry Revenue (Million) Forecast, by Application 2019 & 2032
- Table 29: Global Automotive Display Industry Revenue Million Forecast, by Product Type 2019 & 2032
- Table 30: Global Automotive Display Industry Revenue Million Forecast, by Display Technology 2019 & 2032
- Table 31: Global Automotive Display Industry Revenue Million Forecast, by Country 2019 & 2032
- Table 32: Germany Automotive Display Industry Revenue (Million) Forecast, by Application 2019 & 2032
- Table 33: United Kingdom Automotive Display Industry Revenue (Million) Forecast, by Application 2019 & 2032
- Table 34: France Automotive Display Industry Revenue (Million) Forecast, by Application 2019 & 2032
- Table 35: Rest of Europe Automotive Display Industry Revenue (Million) Forecast, by Application 2019 & 2032
- Table 36: Global Automotive Display Industry Revenue Million Forecast, by Product Type 2019 & 2032
- Table 37: Global Automotive Display Industry Revenue Million Forecast, by Display Technology 2019 & 2032
- Table 38: Global Automotive Display Industry Revenue Million Forecast, by Country 2019 & 2032
- Table 39: China Automotive Display Industry Revenue (Million) Forecast, by Application 2019 & 2032
- Table 40: Japan Automotive Display Industry Revenue (Million) Forecast, by Application 2019 & 2032
- Table 41: India Automotive Display Industry Revenue (Million) Forecast, by Application 2019 & 2032
- Table 42: South Korea Automotive Display Industry Revenue (Million) Forecast, by Application 2019 & 2032
- Table 43: Rest of Asia Pacific Automotive Display Industry Revenue (Million) Forecast, by Application 2019 & 2032
- Table 44: Global Automotive Display Industry Revenue Million Forecast, by Product Type 2019 & 2032
- Table 45: Global Automotive Display Industry Revenue Million Forecast, by Display Technology 2019 & 2032
- Table 46: Global Automotive Display Industry Revenue Million Forecast, by Country 2019 & 2032
- Table 47: South America Automotive Display Industry Revenue (Million) Forecast, by Application 2019 & 2032
- Table 48: Middle East and Africa Automotive Display Industry Revenue (Million) Forecast, by Application 2019 & 2032
Frequently Asked Questions
1. What is the projected Compound Annual Growth Rate (CAGR) of the Automotive Display Industry?
The projected CAGR is approximately > 6.00%.
2. Which companies are prominent players in the Automotive Display Industry?
Key companies in the market include Magneti Marelli SpA, Denso Corporation, Visteon Corporation, Harman International Industries Inc, LG Display Co, Nippon Seiki Co Lt, Continental AG, Robert Bosch GmbH, Yazaki Corporation, Panasonic Corporation.
3. What are the main segments of the Automotive Display Industry?
The market segments include Product Type, Display Technology.
4. Can you provide details about the market size?
The market size is estimated to be USD XX Million as of 2022.
5. What are some drivers contributing to market growth?
Increasing Demand For Electric School Buses.
6. What are the notable trends driving market growth?
Increasing Demand of OLED Displays in the Luxury Vehicle is Expected to Witness Faster Growth Rate.
7. Are there any restraints impacting market growth?
Uncertainty of The Global Pandemic.
8. Can you provide examples of recent developments in the market?
April 2022: TouchNetix announced fully integrated aXiom touchscreen chips that offer new 3D sensing capabilities by detecting air gestures allowing touchless functions in automotive, industrial, and consumer environments, among others. aXiom provides more than 100 times higher Signal-to-Noise Ratio (SNR) than the traditional touchscreen controllers on the market.
9. What pricing options are available for accessing the report?
Pricing options include single-user, multi-user, and enterprise licenses priced at USD 4750, USD 5250, and USD 8750 respectively.
10. Is the market size provided in terms of value or volume?
The market size is provided in terms of value, measured in Million.
11. Are there any specific market keywords associated with the report?
Yes, the market keyword associated with the report is "Automotive Display Industry," which aids in identifying and referencing the specific market segment covered.
12. How do I determine which pricing option suits my needs best?
The pricing options vary based on user requirements and access needs. Individual users may opt for single-user licenses, while businesses requiring broader access may choose multi-user or enterprise licenses for cost-effective access to the report.
13. Are there any additional resources or data provided in the Automotive Display Industry report?
While the report offers comprehensive insights, it's advisable to review the specific contents or supplementary materials provided to ascertain if additional resources or data are available.
14. How can I stay updated on further developments or reports in the Automotive Display Industry?
To stay informed about further developments, trends, and reports in the Automotive Display Industry, consider subscribing to industry newsletters, following relevant companies and organizations, or regularly checking reputable industry news sources and publications.
Methodology
Step 1 - Identification of Relevant Samples Size from Population Database


Step 2 - Approaches for Defining Global Market Size (Value, Volume* & Price*)

Note*: In applicable scenarios
Step 3 - Data Sources
Primary Research
- Web Analytics
- Survey Reports
- Research Institute
- Latest Research Reports
- Opinion Leaders
Secondary Research
- Annual Reports
- White Paper
- Latest Press Release
- Industry Association
- Paid Database
- Investor Presentations

Step 4 - Data Triangulation
Involves using different sources of information in order to increase the validity of a study
These sources are likely to be stakeholders in a program - participants, other researchers, program staff, other community members, and so on.
Then we put all data in single framework & apply various statistical tools to find out the dynamic on the market.
During the analysis stage, feedback from the stakeholder groups would be compared to determine areas of agreement as well as areas of divergence


