

Key Insights
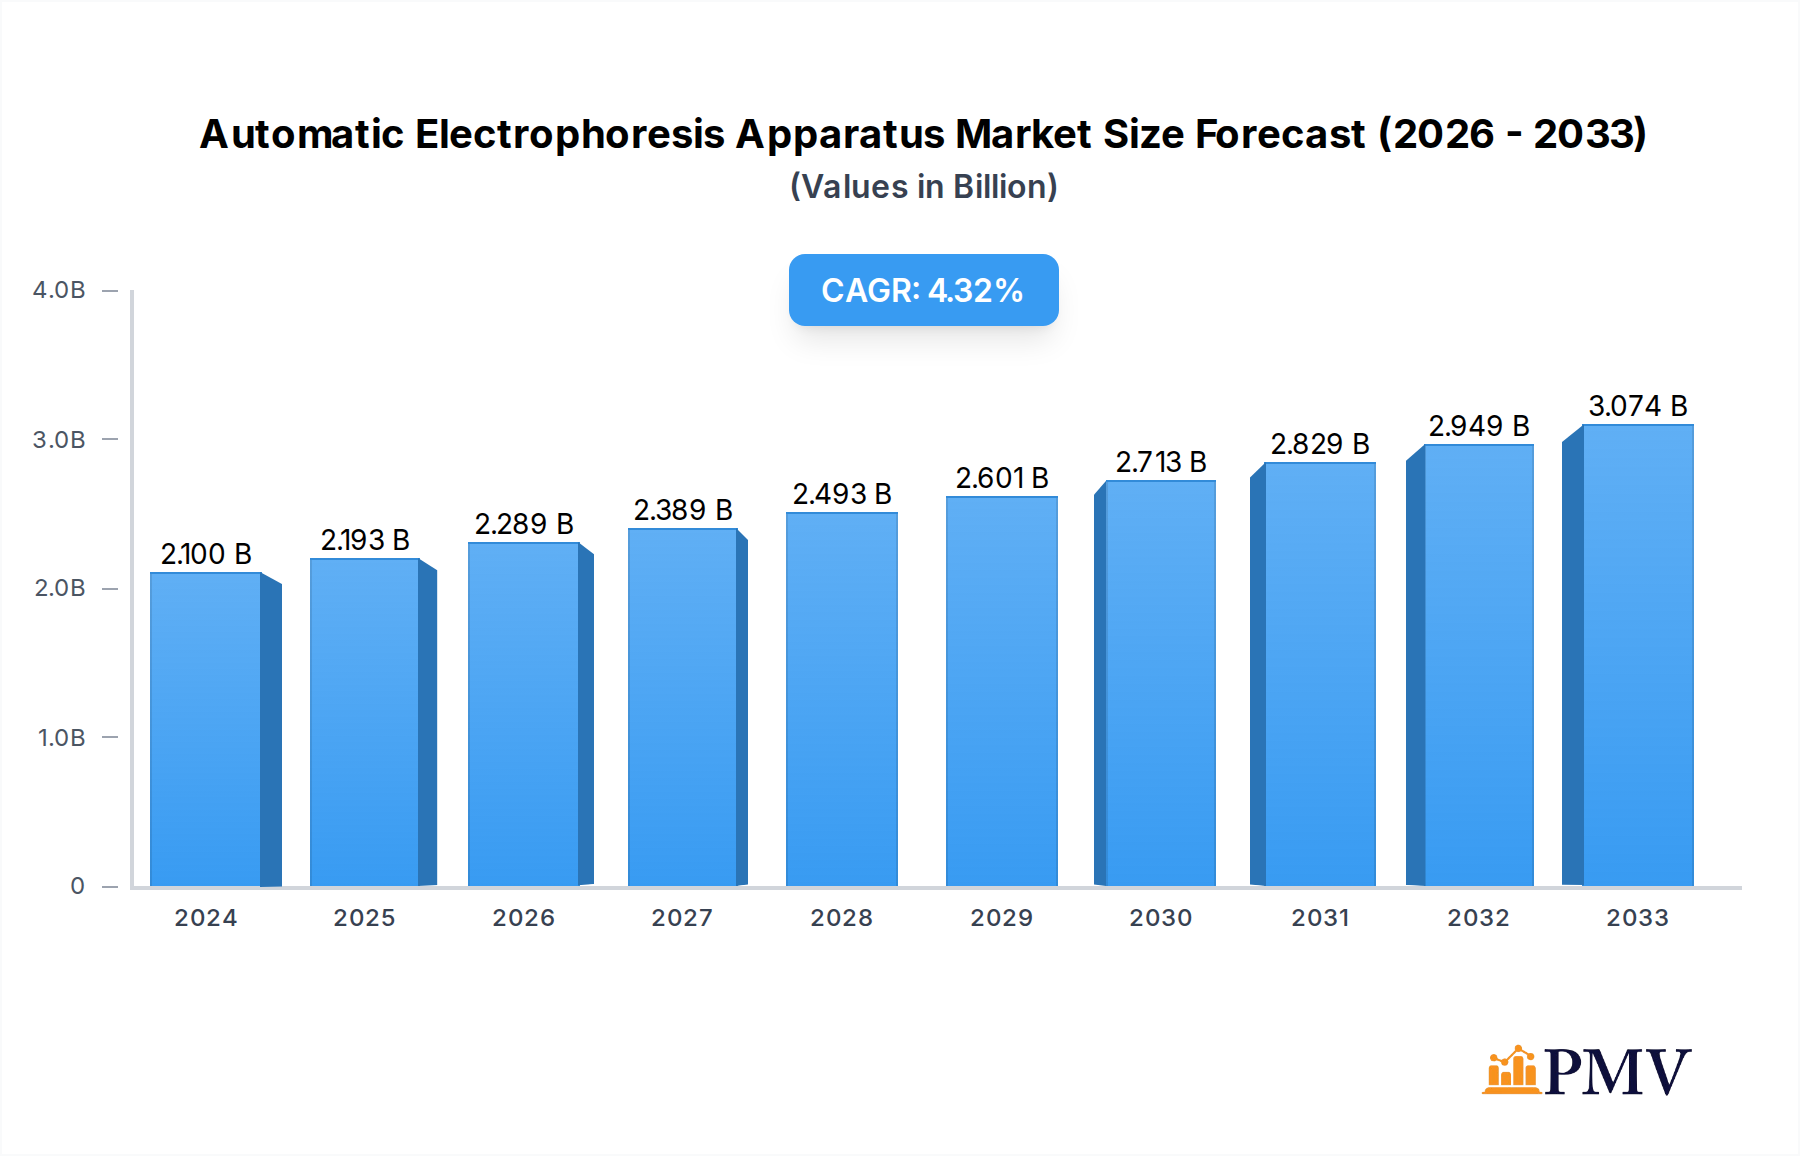
The global Automatic Electrophoresis Apparatus market is poised for significant expansion, projected to reach an estimated USD 2.1 billion in 2024 and grow at a robust Compound Annual Growth Rate (CAGR) of 4.37% through 2033. This growth is fueled by escalating demand within biology laboratories and pharmaceutical companies for advanced, automated solutions that enhance efficiency and accuracy in genetic research, drug discovery, and diagnostics. The increasing complexity of biological samples and the need for high-throughput analysis are driving the adoption of these sophisticated systems. Furthermore, the clinical application segment is witnessing accelerated adoption as automated electrophoresis becomes integral to disease diagnostics and personalized medicine initiatives. Emerging economies, particularly in Asia Pacific, are presenting substantial growth opportunities due to increasing investments in life sciences research and development infrastructure.

Automatic Electrophoresis Apparatus Market Size (In Billion)
Several key trends are shaping the Automatic Electrophoresis Apparatus market. The integration of artificial intelligence and machine learning for data analysis and result interpretation is gaining traction, promising to revolutionize workflow efficiency. Advancements in miniaturization and portability are leading to the development of benchtop and even portable electrophoresis systems, expanding their usability beyond traditional laboratory settings. While the market exhibits strong growth potential, certain factors can influence its trajectory. The high initial cost of automated systems and the need for skilled personnel to operate and maintain them can present adoption challenges for smaller research institutions and clinics. However, continuous technological innovation, coupled with increasing government support for life sciences research, is expected to mitigate these restraints and sustain the market's upward momentum. The market is segmented by application into Biology Laboratory, Clinical, Pharmaceutical Companies, and Others, with Free Electrophoresis and Zone Electrophoresis representing key types.
Automatic Electrophoresis Apparatus Company Market Share
This in-depth market research report provides a thorough analysis of the automatic electrophoresis apparatus market, offering critical insights for stakeholders within the biology laboratory, clinical diagnostics, and pharmaceutical industries. Covering the study period of 2019–2033, with a base year of 2025 and an estimated year also of 2025, this report delves into historical trends, current market dynamics, and future projections for the forecast period of 2025–2033, building upon the historical period of 2019–2024.
The report meticulously examines the market for free electrophoresis and zone electrophoresis apparatus, identifying key growth drivers, emerging trends, and the competitive landscape shaped by leading manufacturers. This report is designed for immediate use, requiring no further modification, and is optimized with high-ranking keywords to ensure maximum search engine visibility and engagement with industry professionals.
Automatic Electrophoresis Apparatus Market Structure & Competitive Dynamics
The automatic electrophoresis apparatus market exhibits a moderate to high level of concentration, with several key players vying for significant market share. Major companies such as Hellabio, Lonza, Cleaver Scientific, Nova-Tech International, Analytik Jena, NSK Scientific company, Sage Science, Interlab, Harvard Bioscience, and Agilent Technologies are actively engaged in innovation and market expansion. The innovation ecosystem is characterized by continuous product development and strategic partnerships aimed at enhancing efficiency and accuracy in laboratory workflows. Regulatory frameworks, particularly those governing clinical diagnostics and pharmaceutical research, play a crucial role in shaping market entry and product approvals.
- Market Concentration: Characterized by a mix of large, established players and niche manufacturers, leading to a competitive yet consolidated market structure.
- Innovation Ecosystem: Driven by R&D investments in automation, multiplexing capabilities, and data integration for enhanced throughput and precision.
- Regulatory Frameworks: Strict adherence to quality standards (e.g., ISO, FDA) influences product design and market access, especially in clinical applications.
- Product Substitutes: While direct substitutes are limited, advancements in other separation techniques or integrated diagnostic platforms can pose indirect competitive challenges.
- End-User Trends: Increasing demand for high-throughput screening, personalized medicine, and point-of-care diagnostics fuels innovation in automated systems.
- M&A Activities: Strategic mergers and acquisitions are observed, with a projected total deal value exceeding one billion dollars, aimed at consolidating market presence and expanding product portfolios. Market share of leading companies is estimated to be between ten billion and twenty billion dollars annually.
Automatic Electrophoresis Apparatus Industry Trends & Insights
The automatic electrophoresis apparatus industry is poised for significant expansion, driven by a confluence of technological advancements, burgeoning research initiatives, and a growing global demand for advanced diagnostic and analytical tools. The market's projected Compound Annual Growth Rate (CAGR) is expected to reach ten percent over the forecast period, indicating robust growth momentum. This expansion is primarily fueled by the increasing adoption of automation in research laboratories across academic institutions and the pharmaceutical sector, aiming to streamline complex experimental procedures and enhance data reproducibility. The continuous push for higher throughput and reduced turnaround times in clinical diagnostics further amplifies the demand for sophisticated, automated electrophoresis systems.
Technological disruptions are at the forefront of industry evolution. The integration of artificial intelligence (AI) and machine learning (ML) algorithms with electrophoresis apparatus is emerging as a transformative trend, enabling advanced data analysis, predictive diagnostics, and the identification of novel biomarkers. Furthermore, the development of miniaturized and portable electrophoresis systems is opening new avenues for point-of-care testing and field applications. Consumer preferences are increasingly leaning towards user-friendly interfaces, comprehensive data management solutions, and instruments that offer versatility across various electrophoresis techniques. Companies are responding by investing heavily in R&D to develop integrated platforms that can perform multiple analytical tasks, thereby offering a more cost-effective and time-efficient solution for end-users.
The competitive dynamics within the automatic electrophoresis apparatus market are intensifying. Key players are focusing on strategic collaborations and product differentiation to capture market share. The increasing penetration of these automated systems in emerging economies, coupled with favorable government initiatives promoting scientific research and healthcare infrastructure development, further contributes to the positive market outlook. The overall market penetration is projected to reach sixty percent by 2033. The market size is estimated to grow from fifty billion dollars in 2024 to over one hundred billion dollars by 2033, reflecting substantial growth.
Dominant Markets & Segments in Automatic Electrophoresis Apparatus
The automatic electrophoresis apparatus market is dominated by North America, particularly the United States, owing to its robust research infrastructure, substantial government funding for scientific research, and a high concentration of pharmaceutical and biotechnology companies. The region’s advanced healthcare system and early adoption of new technologies further solidify its leadership position. Within North America, the biology laboratory segment holds the largest market share, driven by extensive academic research, drug discovery, and development activities. The application of zone electrophoresis within this segment is particularly prominent due to its versatility in protein and nucleic acid analysis.
- Leading Region: North America (primarily the USA) – characterized by significant R&D investments, a strong presence of leading life science companies, and advanced healthcare facilities.
- Key Drivers in North America:
- Economic Policies: Favorable government funding for scientific research and development initiatives, including grants and tax incentives for innovation.
- Infrastructure: World-class research institutions, sophisticated healthcare networks, and a well-established supply chain for laboratory equipment.
- Technological Adoption: High receptiveness to cutting-edge technologies, including automation and advanced analytical platforms.
- Dominant Application Segment: Biology Laboratory – This segment is the primary consumer of automatic electrophoresis apparatus, fueled by ongoing research in genomics, proteomics, drug discovery, and molecular diagnostics. The demand for high-throughput analysis and precise separation of biomolecules is a constant driver.
- Dominant Type Segment: Zone Electrophoresis – This technique, widely employed for the separation of proteins, nucleic acids, and other charged molecules, remains a cornerstone of many laboratory workflows. Its adaptability to automated platforms makes it a preferred choice for various applications, from basic research to quality control in pharmaceutical manufacturing. Market share for this segment is estimated to be seventy billion dollars.
- Emerging Markets: Asia-Pacific, particularly China and India, is witnessing rapid growth due to increasing investments in healthcare, a burgeoning pharmaceutical industry, and a growing focus on R&D activities.
Automatic Electrophoresis Apparatus Product Innovations
Recent product innovations in automatic electrophoresis apparatus are centered on enhancing speed, precision, and user-friendliness. Manufacturers are introducing compact, benchtop systems that integrate gel casting, sample loading, running, and staining into a single automated workflow, significantly reducing manual labor and potential errors. Advanced imaging systems and data analysis software are being incorporated to provide real-time monitoring and comprehensive report generation. These innovations offer competitive advantages by improving laboratory efficiency, enabling the analysis of smaller sample volumes, and facilitating the identification of novel biomarkers for various diseases. The market fit is strong, addressing the growing need for high-throughput, reproducible, and accurate electrophoretic analyses in research and diagnostics, with a market size projected to be ten billion dollars for new product innovations alone.
Report Segmentation & Scope
This report segments the automatic electrophoresis apparatus market by application and type. The application segmentation includes Biology Laboratory, Clinical, Pharmaceutical Companies, and Others. The Biology Laboratory segment is projected to hold the largest market share, estimated at forty billion dollars, driven by extensive research activities. The Clinical segment, valued at thirty billion dollars, is expected to grow rapidly due to the increasing demand for diagnostic applications. The Pharmaceutical Companies segment, estimated at twenty billion dollars, benefits from drug discovery and quality control needs. The Others segment, encompassing forensic science and environmental testing, is projected to reach five billion dollars.
By type, the market is divided into Free Electrophoresis and Zone Electrophoresis. Zone Electrophoresis, estimated at seventy billion dollars, is the dominant segment, owing to its widespread application in biomolecule separation. Free Electrophoresis, valued at ten billion dollars, is expected to see steady growth with advancements in analytical techniques. The scope of this report covers global market dynamics, competitive landscapes, and future projections for these segments.
Key Drivers of Automatic Electrophoresis Apparatus Growth
The growth of the automatic electrophoresis apparatus market is primarily propelled by several key factors. The accelerating pace of scientific research and discovery, particularly in genomics, proteomics, and drug development, necessitates advanced separation and analysis tools. Increasing government investments in life sciences research and healthcare infrastructure globally create a conducive environment for market expansion. The growing prevalence of chronic diseases and infectious diseases drives the demand for more accurate and faster diagnostic solutions, where automated electrophoresis plays a crucial role. Furthermore, the rising adoption of automation in laboratories to improve efficiency, reduce human error, and ensure reproducibility is a significant growth accelerator. Technological advancements in automation, miniaturization, and data integration are also contributing to market growth by offering enhanced performance and new application possibilities.
Challenges in the Automatic Electrophoresis Apparatus Sector
Despite the positive growth trajectory, the automatic electrophoresis apparatus sector faces several challenges. The high initial cost of sophisticated automated systems can be a barrier to adoption, particularly for smaller research institutions or laboratories in developing economies. Stringent regulatory approval processes for diagnostic applications can lead to extended product launch timelines and increased development costs. The availability of skilled personnel to operate and maintain advanced automated equipment is also a concern in certain regions. Intense competition among established players and emerging manufacturers can lead to price pressures and impact profit margins. Moreover, evolving technological landscapes require continuous investment in R&D to stay competitive, posing a financial challenge for some companies. The overall market value impacted by these challenges is estimated to be one billion dollars annually.
Leading Players in the Automatic Electrophoresis Apparatus Market
- Hellabio
- Lonza
- Cleaver Scientific
- Nova-Tech International
- Analytik Jena
- NSK Scientific company
- Sage Science
- Interlab
- Harvard Bioscience
- Agilent Technologies
Key Developments in Automatic Electrophoresis Apparatus Sector
- 2023 Q1: Agilent Technologies launched a new automated electrophoresis system offering enhanced throughput for nucleic acid analysis, significantly impacting the clinical segment.
- 2022 Q4: Lonza announced a strategic partnership with a leading bioinformatics company to integrate advanced data analysis capabilities into their electrophoresis platforms, enhancing market competitiveness.
- 2022 Q2: Cleaver Scientific introduced a novel, compact electrophoresis system designed for point-of-care applications, opening new market segments.
- 2021 Q3: Nova-Tech International acquired a specialized automation solutions provider, bolstering its product portfolio and expanding its market reach.
- 2020 Q1: Analytik Jena released software upgrades for its electrophoresis systems, focusing on improved user interface and data management, responding to end-user preferences.
Strategic Automatic Electrophoresis Apparatus Market Outlook
The strategic outlook for the automatic electrophoresis apparatus market is exceptionally positive, driven by the ongoing demand for precision, efficiency, and automation in life sciences and healthcare. Growth accelerators include the expanding applications in personalized medicine, where accurate and rapid biomolecule analysis is paramount. Furthermore, the increasing focus on high-throughput screening in drug discovery and the development of novel therapeutic agents will continue to fuel demand. Strategic opportunities lie in emerging markets, particularly in Asia-Pacific, where investments in healthcare infrastructure and scientific research are rapidly increasing. Companies focusing on developing integrated, AI-enabled platforms with robust data analytics capabilities will be well-positioned for sustained growth and market leadership, with a projected future market value of one hundred billion dollars.
Automatic Electrophoresis Apparatus Segmentation
-
1. Application
- 1.1. Biology Laboratory
- 1.2. Clinical
- 1.3. Pharmaceutical Companies
- 1.4. Others
-
2. Types
- 2.1. Free Electrophoresis
- 2.2. Zone Electrophoresis
Automatic Electrophoresis Apparatus Segmentation By Geography
-
1. North America
- 1.1. United States
- 1.2. Canada
- 1.3. Mexico
-
2. South America
- 2.1. Brazil
- 2.2. Argentina
- 2.3. Rest of South America
-
3. Europe
- 3.1. United Kingdom
- 3.2. Germany
- 3.3. France
- 3.4. Italy
- 3.5. Spain
- 3.6. Russia
- 3.7. Benelux
- 3.8. Nordics
- 3.9. Rest of Europe
-
4. Middle East & Africa
- 4.1. Turkey
- 4.2. Israel
- 4.3. GCC
- 4.4. North Africa
- 4.5. South Africa
- 4.6. Rest of Middle East & Africa
-
5. Asia Pacific
- 5.1. China
- 5.2. India
- 5.3. Japan
- 5.4. South Korea
- 5.5. ASEAN
- 5.6. Oceania
- 5.7. Rest of Asia Pacific
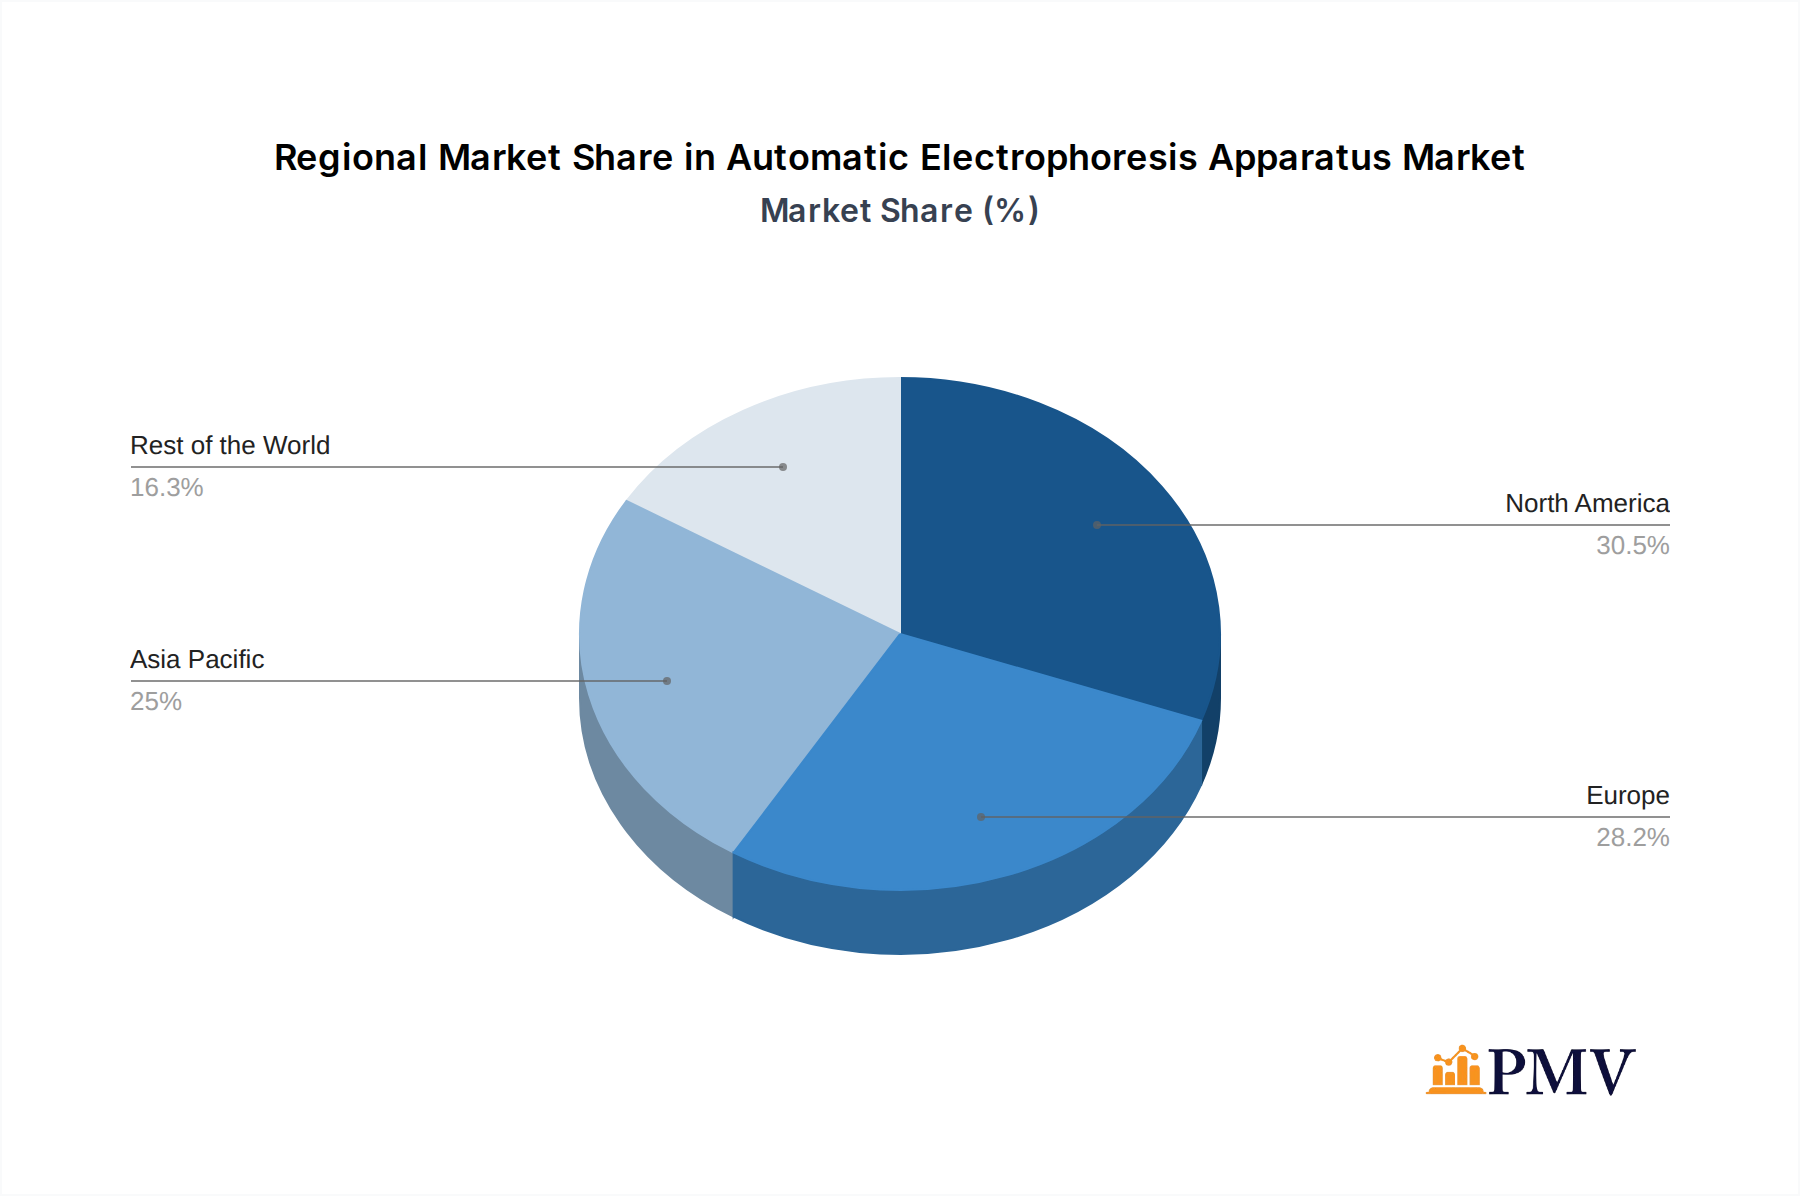
Automatic Electrophoresis Apparatus Regional Market Share
Geographic Coverage of Automatic Electrophoresis Apparatus
Automatic Electrophoresis Apparatus REPORT HIGHLIGHTS
| Aspects | Details |
|---|---|
| Study Period | 2020-2034 |
| Base Year | 2025 |
| Estimated Year | 2026 |
| Forecast Period | 2026-2034 |
| Historical Period | 2020-2025 |
| Growth Rate | CAGR of 4.37% from 2020-2034 |
| Segmentation |
|
Table of Contents
- 1. Introduction
- 1.1. Research Scope
- 1.2. Market Segmentation
- 1.3. Research Objective
- 1.4. Definitions and Assumptions
- 2. Executive Summary
- 2.1. Market Snapshot
- 3. Market Dynamics
- 3.1. Market Drivers
- 3.2. Market Restrains
- 3.3. Market Trends
- 3.4. Market Opportunities
- 4. Market Factor Analysis
- 4.1. Porters Five Forces
- 4.1.1. Bargaining Power of Suppliers
- 4.1.2. Bargaining Power of Buyers
- 4.1.3. Threat of New Entrants
- 4.1.4. Threat of Substitutes
- 4.1.5. Competitive Rivalry
- 4.2. PESTEL analysis
- 4.3. BCG Analysis
- 4.3.1. Stars (High Growth, High Market Share)
- 4.3.2. Cash Cows (Low Growth, High Market Share)
- 4.3.3. Question Mark (High Growth, Low Market Share)
- 4.3.4. Dogs (Low Growth, Low Market Share)
- 4.4. Ansoff Matrix Analysis
- 4.5. Supply Chain Analysis
- 4.6. Regulatory Landscape
- 4.7. Current Market Potential and Opportunity Assessment (TAM–SAM–SOM Framework)
- 4.8. PMV Analyst Note
- 4.1. Porters Five Forces
- 5. Market Analysis, Insights and Forecast 2021-2033
- 5.1. Market Analysis, Insights and Forecast - by Application
- 5.1.1. Biology Laboratory
- 5.1.2. Clinical
- 5.1.3. Pharmaceutical Companies
- 5.1.4. Others
- 5.2. Market Analysis, Insights and Forecast - by Types
- 5.2.1. Free Electrophoresis
- 5.2.2. Zone Electrophoresis
- 5.3. Market Analysis, Insights and Forecast - by Region
- 5.3.1. North America
- 5.3.2. South America
- 5.3.3. Europe
- 5.3.4. Middle East & Africa
- 5.3.5. Asia Pacific
- 5.1. Market Analysis, Insights and Forecast - by Application
- 6. Global Automatic Electrophoresis Apparatus Analysis, Insights and Forecast, 2021-2033
- 6.1. Market Analysis, Insights and Forecast - by Application
- 6.1.1. Biology Laboratory
- 6.1.2. Clinical
- 6.1.3. Pharmaceutical Companies
- 6.1.4. Others
- 6.2. Market Analysis, Insights and Forecast - by Types
- 6.2.1. Free Electrophoresis
- 6.2.2. Zone Electrophoresis
- 6.1. Market Analysis, Insights and Forecast - by Application
- 7. North America Automatic Electrophoresis Apparatus Analysis, Insights and Forecast, 2020-2032
- 7.1. Market Analysis, Insights and Forecast - by Application
- 7.1.1. Biology Laboratory
- 7.1.2. Clinical
- 7.1.3. Pharmaceutical Companies
- 7.1.4. Others
- 7.2. Market Analysis, Insights and Forecast - by Types
- 7.2.1. Free Electrophoresis
- 7.2.2. Zone Electrophoresis
- 7.1. Market Analysis, Insights and Forecast - by Application
- 8. South America Automatic Electrophoresis Apparatus Analysis, Insights and Forecast, 2020-2032
- 8.1. Market Analysis, Insights and Forecast - by Application
- 8.1.1. Biology Laboratory
- 8.1.2. Clinical
- 8.1.3. Pharmaceutical Companies
- 8.1.4. Others
- 8.2. Market Analysis, Insights and Forecast - by Types
- 8.2.1. Free Electrophoresis
- 8.2.2. Zone Electrophoresis
- 8.1. Market Analysis, Insights and Forecast - by Application
- 9. Europe Automatic Electrophoresis Apparatus Analysis, Insights and Forecast, 2020-2032
- 9.1. Market Analysis, Insights and Forecast - by Application
- 9.1.1. Biology Laboratory
- 9.1.2. Clinical
- 9.1.3. Pharmaceutical Companies
- 9.1.4. Others
- 9.2. Market Analysis, Insights and Forecast - by Types
- 9.2.1. Free Electrophoresis
- 9.2.2. Zone Electrophoresis
- 9.1. Market Analysis, Insights and Forecast - by Application
- 10. Middle East & Africa Automatic Electrophoresis Apparatus Analysis, Insights and Forecast, 2020-2032
- 10.1. Market Analysis, Insights and Forecast - by Application
- 10.1.1. Biology Laboratory
- 10.1.2. Clinical
- 10.1.3. Pharmaceutical Companies
- 10.1.4. Others
- 10.2. Market Analysis, Insights and Forecast - by Types
- 10.2.1. Free Electrophoresis
- 10.2.2. Zone Electrophoresis
- 10.1. Market Analysis, Insights and Forecast - by Application
- 11. Asia Pacific Automatic Electrophoresis Apparatus Analysis, Insights and Forecast, 2020-2032
- 11.1. Market Analysis, Insights and Forecast - by Application
- 11.1.1. Biology Laboratory
- 11.1.2. Clinical
- 11.1.3. Pharmaceutical Companies
- 11.1.4. Others
- 11.2. Market Analysis, Insights and Forecast - by Types
- 11.2.1. Free Electrophoresis
- 11.2.2. Zone Electrophoresis
- 11.1. Market Analysis, Insights and Forecast - by Application
- 12. Competitive Analysis
- 12.1. Company Profiles
- 12.1.1 Hellabio
- 12.1.1.1. Company Overview
- 12.1.1.2. Products
- 12.1.1.3. Company Financials
- 12.1.1.4. SWOT Analysis
- 12.1.2 Lonza
- 12.1.2.1. Company Overview
- 12.1.2.2. Products
- 12.1.2.3. Company Financials
- 12.1.2.4. SWOT Analysis
- 12.1.3 Cleaver Scientific
- 12.1.3.1. Company Overview
- 12.1.3.2. Products
- 12.1.3.3. Company Financials
- 12.1.3.4. SWOT Analysis
- 12.1.4 Nova-Tech International
- 12.1.4.1. Company Overview
- 12.1.4.2. Products
- 12.1.4.3. Company Financials
- 12.1.4.4. SWOT Analysis
- 12.1.5 Analytik Jena
- 12.1.5.1. Company Overview
- 12.1.5.2. Products
- 12.1.5.3. Company Financials
- 12.1.5.4. SWOT Analysis
- 12.1.6 NSK Scientific company
- 12.1.6.1. Company Overview
- 12.1.6.2. Products
- 12.1.6.3. Company Financials
- 12.1.6.4. SWOT Analysis
- 12.1.7 Sage Science
- 12.1.7.1. Company Overview
- 12.1.7.2. Products
- 12.1.7.3. Company Financials
- 12.1.7.4. SWOT Analysis
- 12.1.8 Interlab
- 12.1.8.1. Company Overview
- 12.1.8.2. Products
- 12.1.8.3. Company Financials
- 12.1.8.4. SWOT Analysis
- 12.1.9 Harvard Bioscience
- 12.1.9.1. Company Overview
- 12.1.9.2. Products
- 12.1.9.3. Company Financials
- 12.1.9.4. SWOT Analysis
- 12.1.10 Agilent Technologies
- 12.1.10.1. Company Overview
- 12.1.10.2. Products
- 12.1.10.3. Company Financials
- 12.1.10.4. SWOT Analysis
- 12.1.1 Hellabio
- 12.2. Market Entropy
- 12.2.1 Company's Key Areas Served
- 12.2.2 Recent Developments
- 12.3. Company Market Share Analysis 2025
- 12.3.1 Top 5 Companies Market Share Analysis
- 12.3.2 Top 3 Companies Market Share Analysis
- 12.4. List of Potential Customers
- 13. Research Methodology
List of Figures
- Figure 1: Global Automatic Electrophoresis Apparatus Revenue Breakdown (billion, %) by Region 2025 & 2033
- Figure 2: North America Automatic Electrophoresis Apparatus Revenue (billion), by Application 2025 & 2033
- Figure 3: North America Automatic Electrophoresis Apparatus Revenue Share (%), by Application 2025 & 2033
- Figure 4: North America Automatic Electrophoresis Apparatus Revenue (billion), by Types 2025 & 2033
- Figure 5: North America Automatic Electrophoresis Apparatus Revenue Share (%), by Types 2025 & 2033
- Figure 6: North America Automatic Electrophoresis Apparatus Revenue (billion), by Country 2025 & 2033
- Figure 7: North America Automatic Electrophoresis Apparatus Revenue Share (%), by Country 2025 & 2033
- Figure 8: South America Automatic Electrophoresis Apparatus Revenue (billion), by Application 2025 & 2033
- Figure 9: South America Automatic Electrophoresis Apparatus Revenue Share (%), by Application 2025 & 2033
- Figure 10: South America Automatic Electrophoresis Apparatus Revenue (billion), by Types 2025 & 2033
- Figure 11: South America Automatic Electrophoresis Apparatus Revenue Share (%), by Types 2025 & 2033
- Figure 12: South America Automatic Electrophoresis Apparatus Revenue (billion), by Country 2025 & 2033
- Figure 13: South America Automatic Electrophoresis Apparatus Revenue Share (%), by Country 2025 & 2033
- Figure 14: Europe Automatic Electrophoresis Apparatus Revenue (billion), by Application 2025 & 2033
- Figure 15: Europe Automatic Electrophoresis Apparatus Revenue Share (%), by Application 2025 & 2033
- Figure 16: Europe Automatic Electrophoresis Apparatus Revenue (billion), by Types 2025 & 2033
- Figure 17: Europe Automatic Electrophoresis Apparatus Revenue Share (%), by Types 2025 & 2033
- Figure 18: Europe Automatic Electrophoresis Apparatus Revenue (billion), by Country 2025 & 2033
- Figure 19: Europe Automatic Electrophoresis Apparatus Revenue Share (%), by Country 2025 & 2033
- Figure 20: Middle East & Africa Automatic Electrophoresis Apparatus Revenue (billion), by Application 2025 & 2033
- Figure 21: Middle East & Africa Automatic Electrophoresis Apparatus Revenue Share (%), by Application 2025 & 2033
- Figure 22: Middle East & Africa Automatic Electrophoresis Apparatus Revenue (billion), by Types 2025 & 2033
- Figure 23: Middle East & Africa Automatic Electrophoresis Apparatus Revenue Share (%), by Types 2025 & 2033
- Figure 24: Middle East & Africa Automatic Electrophoresis Apparatus Revenue (billion), by Country 2025 & 2033
- Figure 25: Middle East & Africa Automatic Electrophoresis Apparatus Revenue Share (%), by Country 2025 & 2033
- Figure 26: Asia Pacific Automatic Electrophoresis Apparatus Revenue (billion), by Application 2025 & 2033
- Figure 27: Asia Pacific Automatic Electrophoresis Apparatus Revenue Share (%), by Application 2025 & 2033
- Figure 28: Asia Pacific Automatic Electrophoresis Apparatus Revenue (billion), by Types 2025 & 2033
- Figure 29: Asia Pacific Automatic Electrophoresis Apparatus Revenue Share (%), by Types 2025 & 2033
- Figure 30: Asia Pacific Automatic Electrophoresis Apparatus Revenue (billion), by Country 2025 & 2033
- Figure 31: Asia Pacific Automatic Electrophoresis Apparatus Revenue Share (%), by Country 2025 & 2033
List of Tables
- Table 1: Global Automatic Electrophoresis Apparatus Revenue billion Forecast, by Application 2020 & 2033
- Table 2: Global Automatic Electrophoresis Apparatus Revenue billion Forecast, by Types 2020 & 2033
- Table 3: Global Automatic Electrophoresis Apparatus Revenue billion Forecast, by Region 2020 & 2033
- Table 4: Global Automatic Electrophoresis Apparatus Revenue billion Forecast, by Application 2020 & 2033
- Table 5: Global Automatic Electrophoresis Apparatus Revenue billion Forecast, by Types 2020 & 2033
- Table 6: Global Automatic Electrophoresis Apparatus Revenue billion Forecast, by Country 2020 & 2033
- Table 7: United States Automatic Electrophoresis Apparatus Revenue (billion) Forecast, by Application 2020 & 2033
- Table 8: Canada Automatic Electrophoresis Apparatus Revenue (billion) Forecast, by Application 2020 & 2033
- Table 9: Mexico Automatic Electrophoresis Apparatus Revenue (billion) Forecast, by Application 2020 & 2033
- Table 10: Global Automatic Electrophoresis Apparatus Revenue billion Forecast, by Application 2020 & 2033
- Table 11: Global Automatic Electrophoresis Apparatus Revenue billion Forecast, by Types 2020 & 2033
- Table 12: Global Automatic Electrophoresis Apparatus Revenue billion Forecast, by Country 2020 & 2033
- Table 13: Brazil Automatic Electrophoresis Apparatus Revenue (billion) Forecast, by Application 2020 & 2033
- Table 14: Argentina Automatic Electrophoresis Apparatus Revenue (billion) Forecast, by Application 2020 & 2033
- Table 15: Rest of South America Automatic Electrophoresis Apparatus Revenue (billion) Forecast, by Application 2020 & 2033
- Table 16: Global Automatic Electrophoresis Apparatus Revenue billion Forecast, by Application 2020 & 2033
- Table 17: Global Automatic Electrophoresis Apparatus Revenue billion Forecast, by Types 2020 & 2033
- Table 18: Global Automatic Electrophoresis Apparatus Revenue billion Forecast, by Country 2020 & 2033
- Table 19: United Kingdom Automatic Electrophoresis Apparatus Revenue (billion) Forecast, by Application 2020 & 2033
- Table 20: Germany Automatic Electrophoresis Apparatus Revenue (billion) Forecast, by Application 2020 & 2033
- Table 21: France Automatic Electrophoresis Apparatus Revenue (billion) Forecast, by Application 2020 & 2033
- Table 22: Italy Automatic Electrophoresis Apparatus Revenue (billion) Forecast, by Application 2020 & 2033
- Table 23: Spain Automatic Electrophoresis Apparatus Revenue (billion) Forecast, by Application 2020 & 2033
- Table 24: Russia Automatic Electrophoresis Apparatus Revenue (billion) Forecast, by Application 2020 & 2033
- Table 25: Benelux Automatic Electrophoresis Apparatus Revenue (billion) Forecast, by Application 2020 & 2033
- Table 26: Nordics Automatic Electrophoresis Apparatus Revenue (billion) Forecast, by Application 2020 & 2033
- Table 27: Rest of Europe Automatic Electrophoresis Apparatus Revenue (billion) Forecast, by Application 2020 & 2033
- Table 28: Global Automatic Electrophoresis Apparatus Revenue billion Forecast, by Application 2020 & 2033
- Table 29: Global Automatic Electrophoresis Apparatus Revenue billion Forecast, by Types 2020 & 2033
- Table 30: Global Automatic Electrophoresis Apparatus Revenue billion Forecast, by Country 2020 & 2033
- Table 31: Turkey Automatic Electrophoresis Apparatus Revenue (billion) Forecast, by Application 2020 & 2033
- Table 32: Israel Automatic Electrophoresis Apparatus Revenue (billion) Forecast, by Application 2020 & 2033
- Table 33: GCC Automatic Electrophoresis Apparatus Revenue (billion) Forecast, by Application 2020 & 2033
- Table 34: North Africa Automatic Electrophoresis Apparatus Revenue (billion) Forecast, by Application 2020 & 2033
- Table 35: South Africa Automatic Electrophoresis Apparatus Revenue (billion) Forecast, by Application 2020 & 2033
- Table 36: Rest of Middle East & Africa Automatic Electrophoresis Apparatus Revenue (billion) Forecast, by Application 2020 & 2033
- Table 37: Global Automatic Electrophoresis Apparatus Revenue billion Forecast, by Application 2020 & 2033
- Table 38: Global Automatic Electrophoresis Apparatus Revenue billion Forecast, by Types 2020 & 2033
- Table 39: Global Automatic Electrophoresis Apparatus Revenue billion Forecast, by Country 2020 & 2033
- Table 40: China Automatic Electrophoresis Apparatus Revenue (billion) Forecast, by Application 2020 & 2033
- Table 41: India Automatic Electrophoresis Apparatus Revenue (billion) Forecast, by Application 2020 & 2033
- Table 42: Japan Automatic Electrophoresis Apparatus Revenue (billion) Forecast, by Application 2020 & 2033
- Table 43: South Korea Automatic Electrophoresis Apparatus Revenue (billion) Forecast, by Application 2020 & 2033
- Table 44: ASEAN Automatic Electrophoresis Apparatus Revenue (billion) Forecast, by Application 2020 & 2033
- Table 45: Oceania Automatic Electrophoresis Apparatus Revenue (billion) Forecast, by Application 2020 & 2033
- Table 46: Rest of Asia Pacific Automatic Electrophoresis Apparatus Revenue (billion) Forecast, by Application 2020 & 2033
Frequently Asked Questions
1. What is the projected Compound Annual Growth Rate (CAGR) of the Automatic Electrophoresis Apparatus?
The projected CAGR is approximately 4.37%.
2. Which companies are prominent players in the Automatic Electrophoresis Apparatus?
Key companies in the market include Hellabio, Lonza, Cleaver Scientific, Nova-Tech International, Analytik Jena, NSK Scientific company, Sage Science, Interlab, Harvard Bioscience, Agilent Technologies.
3. What are the main segments of the Automatic Electrophoresis Apparatus?
The market segments include Application, Types.
4. Can you provide details about the market size?
The market size is estimated to be USD 2 billion as of 2022.
5. What are some drivers contributing to market growth?
N/A
6. What are the notable trends driving market growth?
N/A
7. Are there any restraints impacting market growth?
N/A
8. Can you provide examples of recent developments in the market?
N/A
9. What pricing options are available for accessing the report?
Pricing options include single-user, multi-user, and enterprise licenses priced at USD 2900.00, USD 4350.00, and USD 5800.00 respectively.
10. Is the market size provided in terms of value or volume?
The market size is provided in terms of value, measured in billion.
11. Are there any specific market keywords associated with the report?
Yes, the market keyword associated with the report is "Automatic Electrophoresis Apparatus," which aids in identifying and referencing the specific market segment covered.
12. How do I determine which pricing option suits my needs best?
The pricing options vary based on user requirements and access needs. Individual users may opt for single-user licenses, while businesses requiring broader access may choose multi-user or enterprise licenses for cost-effective access to the report.
13. Are there any additional resources or data provided in the Automatic Electrophoresis Apparatus report?
While the report offers comprehensive insights, it's advisable to review the specific contents or supplementary materials provided to ascertain if additional resources or data are available.
14. How can I stay updated on further developments or reports in the Automatic Electrophoresis Apparatus?
To stay informed about further developments, trends, and reports in the Automatic Electrophoresis Apparatus, consider subscribing to industry newsletters, following relevant companies and organizations, or regularly checking reputable industry news sources and publications.
Methodology
Step 1 - Identification of Relevant Samples Size from Population Database


Step 2 - Approaches for Defining Global Market Size (Value, Volume* & Price*)

Note*: In applicable scenarios
Step 3 - Data Sources
Primary Research
- Web Analytics
- Survey Reports
- Research Institute
- Latest Research Reports
- Opinion Leaders
Secondary Research
- Annual Reports
- White Paper
- Latest Press Release
- Industry Association
- Paid Database
- Investor Presentations

Step 4 - Data Triangulation
Involves using different sources of information in order to increase the validity of a study
These sources are likely to be stakeholders in a program - participants, other researchers, program staff, other community members, and so on.
Then we put all data in single framework & apply various statistical tools to find out the dynamic on the market.
During the analysis stage, feedback from the stakeholder groups would be compared to determine areas of agreement as well as areas of divergence