


Key Insights
The Asia Pacific chemical sensor market is projected for significant expansion, with an estimated market size of 27.63 billion and a Compound Annual Growth Rate (CAGR) of 7.3% from 2025 to 2033. This growth is propelled by rapid industrialization, particularly in China and India, increased demand for environmental monitoring, and advancements in medical diagnostics. The adoption of automation and Industry 4.0 initiatives further fuels this expansion. Key drivers include stringent environmental regulations, the proliferation of smart cities, and the critical need for precise chemical detection across industrial processes, food safety, and homeland security. While electrochemical sensors currently lead due to their cost-effectiveness, optical and pellistor/catalytic bead sensors are gaining traction for their superior sensitivity and selectivity. Substantial R&D investments are fostering the development of miniaturized, energy-efficient, and affordable sensors, enhancing market potential.

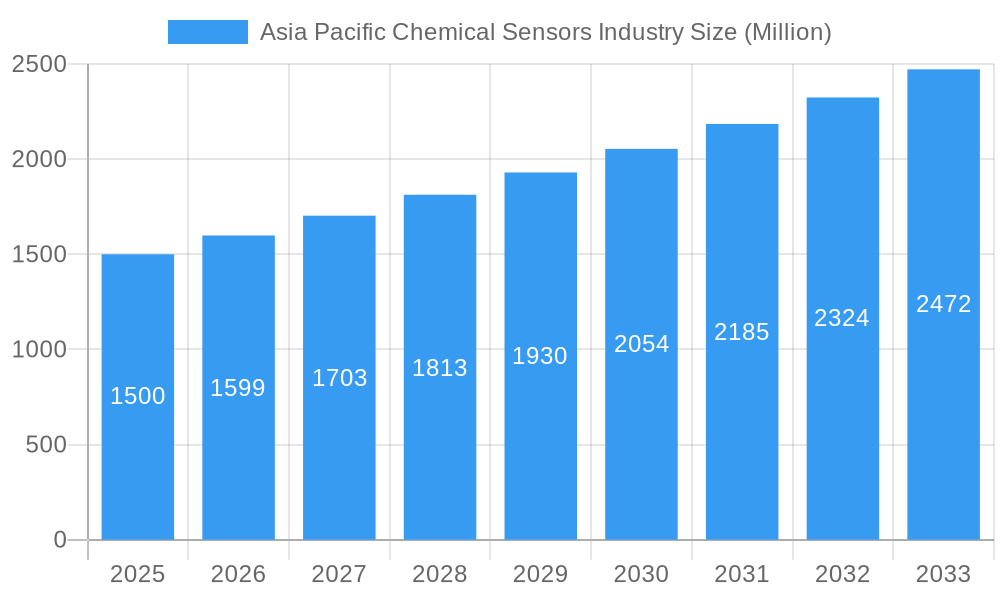
Asia Pacific Chemical Sensors Industry Market Size (In Billion)

Despite a positive outlook, the market faces challenges including supply chain disruptions for raw materials and semiconductor components, and high initial investment costs for advanced sensor technologies. Nonetheless, sustained technological innovation, heightened environmental awareness, and robust economic growth in the Asia Pacific region underpin a strong long-term trajectory. The integration of chemical sensors with IoT platforms is a growing trend, improving data analytics and system efficiency. Countries like China, India, and South Korea are expected to be key growth centers, supported by expanding economies and supportive government policies.
Asia Pacific Chemical Sensors Industry Company Market Share
This report offers an in-depth analysis of the Asia Pacific chemical sensor industry, providing strategic insights for businesses, investors, and researchers. The analysis covers the period 2019-2033, with 2025 as the base year. The market is segmented by product type, application, and country, detailing growth drivers, challenges, and opportunities. Leading players such as Honeywell International Inc., Smiths Detection Inc., and Siemens AG are profiled, with an examination of their market strategies and competitive positioning.
Asia Pacific Chemical Sensors Industry Market Structure & Competitive Dynamics
The Asia Pacific chemical sensors market exhibits a moderately consolidated structure, with a few major players holding significant market share. Honeywell International Inc. and Siemens AG, for example, are estimated to hold a combined xx% market share in 2025, driven by their extensive product portfolios and established distribution networks. The market is characterized by a dynamic innovation ecosystem, with companies investing heavily in R&D to develop advanced sensor technologies. Stringent regulatory frameworks related to environmental monitoring and industrial safety significantly influence market growth and product development. Substitute technologies, such as optical sensors and electrochemical sensors, are vying for market share. End-user trends are shifting towards miniaturization, increased sensitivity, and wireless connectivity, prompting manufacturers to adapt their offerings. Significant M&A activity has been observed in the past five years, with deal values totaling an estimated $xx Million. This activity reflects the industry's consolidation and expansion into adjacent markets.
- Market Concentration: Moderately consolidated, with top players holding xx% market share in 2025.
- Innovation Ecosystem: Strong R&D investments driving technological advancements.
- Regulatory Frameworks: Stringent regulations in environmental and industrial sectors.
- Product Substitutes: Competition from optical and other sensor technologies.
- End-User Trends: Demand for miniaturization, enhanced sensitivity, and wireless connectivity.
- M&A Activity: Significant consolidation, with deal values estimated at $xx Million (2019-2024).
Asia Pacific Chemical Sensors Industry Industry Trends & Insights
The Asia Pacific chemical sensors market is experiencing robust growth, driven by increasing industrial automation, stringent environmental regulations, and rising demand for advanced healthcare solutions. The market is projected to achieve a CAGR of xx% during the forecast period (2025-2033). Technological advancements, such as the development of nanomaterial-based sensors and the integration of artificial intelligence (AI) for data analysis, are significantly disrupting the industry. Consumer preference is shifting towards high-performance, cost-effective, and environmentally friendly sensors. The competitive landscape is intensely dynamic, with companies constantly innovating to enhance product features and expand their market reach. Market penetration of advanced sensor technologies, such as those based on MEMS (Microelectromechanical Systems), is gradually increasing, driven by their superior performance and miniaturization capabilities. The increasing adoption of IoT (Internet of Things) applications further fuels demand for chemical sensors across various industries.
Dominant Markets & Segments in Asia Pacific Chemical Sensors Industry
The Asia Pacific chemical sensors market is dominated by the Industrial application segment, accounting for approximately xx% of the total market revenue in 2025. China remains the largest national market, driven by rapid industrialization and economic growth.
By Product Type: Electrochemical sensors hold the largest market share, owing to their maturity and cost-effectiveness.
By Application:
- Industrial: Dominant segment driven by process monitoring, automation, and safety requirements. Key drivers include increasing automation across manufacturing sectors, stringent emission control regulations, and growth in industrial IoT applications.
- Environmental Monitoring: Significant growth potential driven by increasing environmental awareness and government regulations. Key drivers include air and water quality monitoring needs, and the implementation of stricter environmental policies.
- Medical: Growing segment driven by advancements in diagnostics and healthcare monitoring. Key drivers include the increasing prevalence of chronic diseases, and the development of point-of-care diagnostic tools.
- Defense and Homeland Security: Steady growth driven by homeland security needs and defense modernization. Key drivers include border control, threat detection, and military applications.
By Country:
- China: Largest market due to rapid industrialization and economic growth. Key drivers include government initiatives to promote industrial automation, a rapidly expanding manufacturing sector, and a focus on environmental monitoring.
- India: Experiencing strong growth driven by expanding industrial and manufacturing sectors. Key drivers include rising disposable incomes, and increased investments in industrial infrastructure.
- Japan: Mature market with a focus on high-tech sensors and advanced applications. Key drivers include a strong focus on technological innovation, and an established industrial base.
- South Korea: Strong growth driven by investments in advanced technologies and the electronics industry. Key drivers include strong government support for R&D and industrial innovation, and a well-established electronics manufacturing sector.
Asia Pacific Chemical Sensors Industry Product Innovations
Recent innovations focus on miniaturized, highly sensitive sensors with advanced signal processing capabilities, integrating AI for data analytics and predictive maintenance. The development of new materials, such as nanomaterials and polymers, has led to sensors with improved performance characteristics, such as increased sensitivity, selectivity, and stability. This enhances the sensor's market fit, addressing critical issues in various applications, including environmental monitoring and healthcare.
Report Segmentation & Scope
This report provides a comprehensive analysis of the Asia Pacific chemical sensors market across several key segments:
By Product Type: Electrochemical, Optical, Pellistor/Catalytic Bead, and Other Product Types. Each segment’s growth trajectory, market size (in Million USD), and competitive dynamics are detailed. Optical sensors, for instance, show a high growth projection driven by increasing demand for high-precision measurements.
By Application: Industrial, Medical, Environmental Monitoring, Defense and Homeland Security, and Other Applications. Each segment is analyzed for its size, growth rate, and market drivers.
By Country: China, India, Japan, South Korea, and Other Countries. This analysis provides regional market insights, highlighting significant growth areas and country-specific dynamics.
Key Drivers of Asia Pacific Chemical Sensors Industry Growth
Key growth drivers include the rising adoption of automation in industries, stringent environmental regulations mandating continuous monitoring, advancements in sensor technologies like miniaturization and improved sensitivity, and increasing healthcare expenditures driving demand for advanced medical sensors. Government initiatives promoting industrial automation and environmental protection in countries like China and India are also significant factors.
Challenges in the Asia Pacific Chemical Sensors Industry Sector
Challenges include the high cost of advanced sensor technologies, supply chain disruptions impacting component availability, intense competition among established and emerging players, and regulatory hurdles in obtaining approvals for new sensor technologies in specific countries. These factors collectively impact the industry's growth rate and profitability.
Leading Players in the Asia Pacific Chemical Sensors Industry Market
- Honeywell International Inc.
- Smiths Detection Inc.
- Siemens AG
- Compur Monitors GmbH & Co KG
- Sick AG
- Ocean Insight (Halma PLC)
- General Electric Company
- Pepperl+Fuchs Group
- AirTest Technologies Inc
- SenseAir AB
Key Developments in Asia Pacific Chemical Sensors Industry Sector
- January 2023: Honeywell International Inc. launched a new line of miniature gas sensors for industrial applications.
- June 2022: Siemens AG acquired a smaller sensor technology company, expanding its product portfolio.
- October 2021: A significant regulatory change in China impacted the market for certain types of environmental sensors. (Further details would be included in the full report)
Strategic Asia Pacific Chemical Sensors Industry Market Outlook
The Asia Pacific chemical sensors market presents significant growth opportunities driven by the continued expansion of industrial automation, rising environmental concerns, and advancements in sensor technologies. Strategic opportunities lie in developing innovative sensor solutions catering to specific applications, strengthening supply chains, and exploring partnerships to expand market reach. Focus on cost-effective and sustainable technologies will also be crucial for future success.
Asia Pacific Chemical Sensors Industry Segmentation
-
1. Product Type
- 1.1. Electrochemical
- 1.2. Optical
- 1.3. Pellistor/Catalytic Bead
- 1.4. Other Product Types
-
2. Application
- 2.1. Industrial
- 2.2. Medical
- 2.3. Environmental Monitoring
- 2.4. Defense and Homeland Security
- 2.5. Other Applications
Asia Pacific Chemical Sensors Industry Segmentation By Geography
-
1. Asia Pacific
- 1.1. China
- 1.2. Japan
- 1.3. South Korea
- 1.4. India
- 1.5. Australia
- 1.6. New Zealand
- 1.7. Indonesia
- 1.8. Malaysia
- 1.9. Singapore
- 1.10. Thailand
- 1.11. Vietnam
- 1.12. Philippines

Asia Pacific Chemical Sensors Industry Regional Market Share
Geographic Coverage of Asia Pacific Chemical Sensors Industry
Asia Pacific Chemical Sensors Industry REPORT HIGHLIGHTS
| Aspects | Details |
|---|---|
| Study Period | 2020-2034 |
| Base Year | 2025 |
| Estimated Year | 2026 |
| Forecast Period | 2026-2034 |
| Historical Period | 2020-2025 |
| Growth Rate | CAGR of 7.3% from 2020-2034 |
| Segmentation |
|
Table of Contents
- 1. Introduction
- 1.1. Research Scope
- 1.2. Market Segmentation
- 1.3. Research Methodology
- 1.4. Definitions and Assumptions
- 2. Executive Summary
- 2.1. Introduction
- 3. Market Dynamics
- 3.1. Introduction
- 3.2. Market Drivers
- 3.2.1. ; Growing Developments in Miniaturised and Portable Electrochemical Sensors; Increased Investments in New Plants in Oil and Gas
- 3.3. Market Restrains
- 3.3.1. Lower Awareness of Facility Management Services
- 3.4. Market Trends
- 3.4.1. Defense Security to Register the Fastest Growth
- 4. Market Factor Analysis
- 4.1. Porters Five Forces
- 4.2. Supply/Value Chain
- 4.3. PESTEL analysis
- 4.4. Market Entropy
- 4.5. Patent/Trademark Analysis
- 5. Asia Pacific Chemical Sensors Industry Analysis, Insights and Forecast, 2020-2032
- 5.1. Market Analysis, Insights and Forecast - by Product Type
- 5.1.1. Electrochemical
- 5.1.2. Optical
- 5.1.3. Pellistor/Catalytic Bead
- 5.1.4. Other Product Types
- 5.2. Market Analysis, Insights and Forecast - by Application
- 5.2.1. Industrial
- 5.2.2. Medical
- 5.2.3. Environmental Monitoring
- 5.2.4. Defense and Homeland Security
- 5.2.5. Other Applications
- 5.3. Market Analysis, Insights and Forecast - by Region
- 5.3.1. Asia Pacific
- 5.1. Market Analysis, Insights and Forecast - by Product Type
- 6. Competitive Analysis
- 6.1. Market Share Analysis 2025
- 6.2. Company Profiles
- 6.2.1 Honeywell International Inc
- 6.2.1.1. Overview
- 6.2.1.2. Products
- 6.2.1.3. SWOT Analysis
- 6.2.1.4. Recent Developments
- 6.2.1.5. Financials (Based on Availability)
- 6.2.2 Smiths Detection Inc
- 6.2.2.1. Overview
- 6.2.2.2. Products
- 6.2.2.3. SWOT Analysis
- 6.2.2.4. Recent Developments
- 6.2.2.5. Financials (Based on Availability)
- 6.2.3 Siemens AG
- 6.2.3.1. Overview
- 6.2.3.2. Products
- 6.2.3.3. SWOT Analysis
- 6.2.3.4. Recent Developments
- 6.2.3.5. Financials (Based on Availability)
- 6.2.4 Compur Monitors GmbH & Co KG
- 6.2.4.1. Overview
- 6.2.4.2. Products
- 6.2.4.3. SWOT Analysis
- 6.2.4.4. Recent Developments
- 6.2.4.5. Financials (Based on Availability)
- 6.2.5 Sick AG
- 6.2.5.1. Overview
- 6.2.5.2. Products
- 6.2.5.3. SWOT Analysis
- 6.2.5.4. Recent Developments
- 6.2.5.5. Financials (Based on Availability)
- 6.2.6 Ocean Insight (Halma PLC)
- 6.2.6.1. Overview
- 6.2.6.2. Products
- 6.2.6.3. SWOT Analysis
- 6.2.6.4. Recent Developments
- 6.2.6.5. Financials (Based on Availability)
- 6.2.7 General Electric Company
- 6.2.7.1. Overview
- 6.2.7.2. Products
- 6.2.7.3. SWOT Analysis
- 6.2.7.4. Recent Developments
- 6.2.7.5. Financials (Based on Availability)
- 6.2.8 Pepperl+Fuchs Group
- 6.2.8.1. Overview
- 6.2.8.2. Products
- 6.2.8.3. SWOT Analysis
- 6.2.8.4. Recent Developments
- 6.2.8.5. Financials (Based on Availability)
- 6.2.9 AirTest Technologies Inc
- 6.2.9.1. Overview
- 6.2.9.2. Products
- 6.2.9.3. SWOT Analysis
- 6.2.9.4. Recent Developments
- 6.2.9.5. Financials (Based on Availability)
- 6.2.10 SenseAir AB
- 6.2.10.1. Overview
- 6.2.10.2. Products
- 6.2.10.3. SWOT Analysis
- 6.2.10.4. Recent Developments
- 6.2.10.5. Financials (Based on Availability)
- 6.2.1 Honeywell International Inc
List of Figures
- Figure 1: Asia Pacific Chemical Sensors Industry Revenue Breakdown (billion, %) by Product 2025 & 2033
- Figure 2: Asia Pacific Chemical Sensors Industry Share (%) by Company 2025
List of Tables
- Table 1: Asia Pacific Chemical Sensors Industry Revenue billion Forecast, by Product Type 2020 & 2033
- Table 2: Asia Pacific Chemical Sensors Industry Volume K Unit Forecast, by Product Type 2020 & 2033
- Table 3: Asia Pacific Chemical Sensors Industry Revenue billion Forecast, by Application 2020 & 2033
- Table 4: Asia Pacific Chemical Sensors Industry Volume K Unit Forecast, by Application 2020 & 2033
- Table 5: Asia Pacific Chemical Sensors Industry Revenue billion Forecast, by Region 2020 & 2033
- Table 6: Asia Pacific Chemical Sensors Industry Volume K Unit Forecast, by Region 2020 & 2033
- Table 7: Asia Pacific Chemical Sensors Industry Revenue billion Forecast, by Product Type 2020 & 2033
- Table 8: Asia Pacific Chemical Sensors Industry Volume K Unit Forecast, by Product Type 2020 & 2033
- Table 9: Asia Pacific Chemical Sensors Industry Revenue billion Forecast, by Application 2020 & 2033
- Table 10: Asia Pacific Chemical Sensors Industry Volume K Unit Forecast, by Application 2020 & 2033
- Table 11: Asia Pacific Chemical Sensors Industry Revenue billion Forecast, by Country 2020 & 2033
- Table 12: Asia Pacific Chemical Sensors Industry Volume K Unit Forecast, by Country 2020 & 2033
- Table 13: China Asia Pacific Chemical Sensors Industry Revenue (billion) Forecast, by Application 2020 & 2033
- Table 14: China Asia Pacific Chemical Sensors Industry Volume (K Unit) Forecast, by Application 2020 & 2033
- Table 15: Japan Asia Pacific Chemical Sensors Industry Revenue (billion) Forecast, by Application 2020 & 2033
- Table 16: Japan Asia Pacific Chemical Sensors Industry Volume (K Unit) Forecast, by Application 2020 & 2033
- Table 17: South Korea Asia Pacific Chemical Sensors Industry Revenue (billion) Forecast, by Application 2020 & 2033
- Table 18: South Korea Asia Pacific Chemical Sensors Industry Volume (K Unit) Forecast, by Application 2020 & 2033
- Table 19: India Asia Pacific Chemical Sensors Industry Revenue (billion) Forecast, by Application 2020 & 2033
- Table 20: India Asia Pacific Chemical Sensors Industry Volume (K Unit) Forecast, by Application 2020 & 2033
- Table 21: Australia Asia Pacific Chemical Sensors Industry Revenue (billion) Forecast, by Application 2020 & 2033
- Table 22: Australia Asia Pacific Chemical Sensors Industry Volume (K Unit) Forecast, by Application 2020 & 2033
- Table 23: New Zealand Asia Pacific Chemical Sensors Industry Revenue (billion) Forecast, by Application 2020 & 2033
- Table 24: New Zealand Asia Pacific Chemical Sensors Industry Volume (K Unit) Forecast, by Application 2020 & 2033
- Table 25: Indonesia Asia Pacific Chemical Sensors Industry Revenue (billion) Forecast, by Application 2020 & 2033
- Table 26: Indonesia Asia Pacific Chemical Sensors Industry Volume (K Unit) Forecast, by Application 2020 & 2033
- Table 27: Malaysia Asia Pacific Chemical Sensors Industry Revenue (billion) Forecast, by Application 2020 & 2033
- Table 28: Malaysia Asia Pacific Chemical Sensors Industry Volume (K Unit) Forecast, by Application 2020 & 2033
- Table 29: Singapore Asia Pacific Chemical Sensors Industry Revenue (billion) Forecast, by Application 2020 & 2033
- Table 30: Singapore Asia Pacific Chemical Sensors Industry Volume (K Unit) Forecast, by Application 2020 & 2033
- Table 31: Thailand Asia Pacific Chemical Sensors Industry Revenue (billion) Forecast, by Application 2020 & 2033
- Table 32: Thailand Asia Pacific Chemical Sensors Industry Volume (K Unit) Forecast, by Application 2020 & 2033
- Table 33: Vietnam Asia Pacific Chemical Sensors Industry Revenue (billion) Forecast, by Application 2020 & 2033
- Table 34: Vietnam Asia Pacific Chemical Sensors Industry Volume (K Unit) Forecast, by Application 2020 & 2033
- Table 35: Philippines Asia Pacific Chemical Sensors Industry Revenue (billion) Forecast, by Application 2020 & 2033
- Table 36: Philippines Asia Pacific Chemical Sensors Industry Volume (K Unit) Forecast, by Application 2020 & 2033
Frequently Asked Questions
1. What is the projected Compound Annual Growth Rate (CAGR) of the Asia Pacific Chemical Sensors Industry?
The projected CAGR is approximately 7.3%.
2. Which companies are prominent players in the Asia Pacific Chemical Sensors Industry?
Key companies in the market include Honeywell International Inc, Smiths Detection Inc, Siemens AG, Compur Monitors GmbH & Co KG, Sick AG, Ocean Insight (Halma PLC), General Electric Company, Pepperl+Fuchs Group, AirTest Technologies Inc, SenseAir AB.
3. What are the main segments of the Asia Pacific Chemical Sensors Industry?
The market segments include Product Type, Application.
4. Can you provide details about the market size?
The market size is estimated to be USD 27.63 billion as of 2022.
5. What are some drivers contributing to market growth?
; Growing Developments in Miniaturised and Portable Electrochemical Sensors; Increased Investments in New Plants in Oil and Gas.
6. What are the notable trends driving market growth?
Defense Security to Register the Fastest Growth.
7. Are there any restraints impacting market growth?
Lower Awareness of Facility Management Services.
8. Can you provide examples of recent developments in the market?
N/A
9. What pricing options are available for accessing the report?
Pricing options include single-user, multi-user, and enterprise licenses priced at USD 3800, USD 4500, and USD 5800 respectively.
10. Is the market size provided in terms of value or volume?
The market size is provided in terms of value, measured in billion and volume, measured in K Unit.
11. Are there any specific market keywords associated with the report?
Yes, the market keyword associated with the report is "Asia Pacific Chemical Sensors Industry," which aids in identifying and referencing the specific market segment covered.
12. How do I determine which pricing option suits my needs best?
The pricing options vary based on user requirements and access needs. Individual users may opt for single-user licenses, while businesses requiring broader access may choose multi-user or enterprise licenses for cost-effective access to the report.
13. Are there any additional resources or data provided in the Asia Pacific Chemical Sensors Industry report?
While the report offers comprehensive insights, it's advisable to review the specific contents or supplementary materials provided to ascertain if additional resources or data are available.
14. How can I stay updated on further developments or reports in the Asia Pacific Chemical Sensors Industry?
To stay informed about further developments, trends, and reports in the Asia Pacific Chemical Sensors Industry, consider subscribing to industry newsletters, following relevant companies and organizations, or regularly checking reputable industry news sources and publications.
Methodology
Step 1 - Identification of Relevant Samples Size from Population Database


Step 2 - Approaches for Defining Global Market Size (Value, Volume* & Price*)

Note*: In applicable scenarios
Step 3 - Data Sources
Primary Research
- Web Analytics
- Survey Reports
- Research Institute
- Latest Research Reports
- Opinion Leaders
Secondary Research
- Annual Reports
- White Paper
- Latest Press Release
- Industry Association
- Paid Database
- Investor Presentations

Step 4 - Data Triangulation
Involves using different sources of information in order to increase the validity of a study
These sources are likely to be stakeholders in a program - participants, other researchers, program staff, other community members, and so on.
Then we put all data in single framework & apply various statistical tools to find out the dynamic on the market.
During the analysis stage, feedback from the stakeholder groups would be compared to determine areas of agreement as well as areas of divergence