
Key Insights
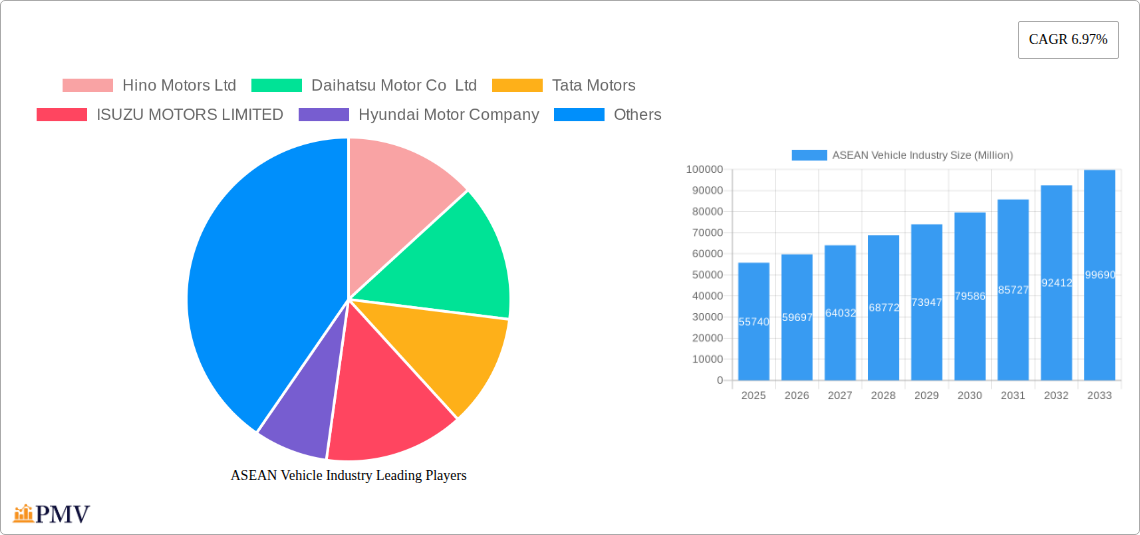
The ASEAN vehicle industry, valued at $55.74 billion in 2025, is projected to experience robust growth, exhibiting a Compound Annual Growth Rate (CAGR) of 6.97% from 2025 to 2033. This expansion is fueled by several key factors. Firstly, rising disposable incomes and increasing urbanization across the region are driving demand for personal and commercial vehicles. Secondly, supportive government policies aimed at infrastructure development and improved logistics networks are further bolstering the sector's growth. The burgeoning e-commerce sector also contributes significantly, increasing the need for efficient last-mile delivery solutions, thereby fueling demand for light commercial vehicles. Finally, technological advancements, such as the adoption of electric and hybrid vehicles, are reshaping the market landscape, albeit at a slower pace compared to other global regions. Competitive pressures from established international players and emerging domestic manufacturers are shaping pricing strategies and product innovation.
However, the industry faces certain challenges. Fluctuations in global commodity prices, particularly steel and other raw materials, impact manufacturing costs. Furthermore, supply chain disruptions and the ongoing semiconductor shortage continue to pose significant risks. While growth is expected across all segments, the light commercial vehicle segment is poised for faster growth due to its association with e-commerce and small business expansion. Indonesia, Thailand, and Vietnam are predicted to remain the dominant markets within ASEAN, driven by their large populations and expanding economies. The continuous focus on sustainable transportation solutions will be a defining trend throughout the forecast period, with increasing investments in electric vehicle infrastructure and related technologies likely to influence market share dynamics amongst manufacturers.
ASEAN Vehicle Industry Market Report: 2019-2033
This comprehensive report provides a detailed analysis of the ASEAN vehicle industry, covering market size, growth drivers, competitive landscape, and future outlook from 2019 to 2033. The study period encompasses the historical period (2019-2024), the base year (2025), and the forecast period (2025-2033), with a focus on the estimated year 2025. This in-depth analysis is essential for businesses, investors, and policymakers seeking to understand and capitalize on opportunities within this dynamic market. The report utilizes a robust methodology to assess the current market landscape and predict future trends across various segments and countries within the ASEAN region.
ASEAN Vehicle Industry Market Structure & Competitive Dynamics
The ASEAN vehicle industry exhibits a moderately concentrated market structure, with several multinational corporations and regional players holding significant market share. Market concentration varies across segments and countries. For example, the light commercial vehicle (LCV) segment in Indonesia shows higher concentration compared to the medium- and heavy-duty commercial vehicle (M&HCV) segment in Vietnam. Innovation ecosystems are emerging, with a focus on electric vehicles (EVs) and connected car technologies. Regulatory frameworks, while varying across ASEAN nations, are progressively pushing for stricter emission standards and safety regulations. Product substitutes, such as two-wheelers and public transportation, significantly influence market demand, especially in the LCV segment. End-user trends are shifting towards fuel efficiency, safety features, and technological advancements. M&A activity has been moderate, with deal values totaling approximately xx Million in the past five years. Key M&A activities have involved strategic partnerships to enhance technological capabilities and expand market reach.
- Market Share: Major players hold approximately xx% of the total market share. Specific brand market shares are analyzed in detail within the report.
- M&A Deal Values: The total value of M&A deals over the past 5 years is estimated at xx Million.
ASEAN Vehicle Industry Industry Trends & Insights
The ASEAN vehicle industry is experiencing significant transformation, driven by a combination of factors. Market growth is fueled by rising disposable incomes, expanding urbanization, and improving infrastructure in several ASEAN nations. Technological disruptions, particularly the rapid adoption of EVs and autonomous driving technologies, are reshaping the competitive landscape. Consumer preferences are shifting towards more fuel-efficient, technologically advanced, and safer vehicles. The industry faces challenges from volatile commodity prices, supply chain disruptions, and fluctuating currency exchange rates. The Compound Annual Growth Rate (CAGR) for the overall ASEAN vehicle market is projected to be xx% during the forecast period (2025-2033), with variations across segments and countries. Market penetration of EVs is expected to increase significantly, reaching xx% by 2033.

Dominant Markets & Segments in ASEAN Vehicle Industry
Indonesia and Thailand represent the dominant markets in the ASEAN vehicle industry.
- Indonesia: Strong domestic demand, government support for automotive manufacturing, and a large population drive Indonesia's dominance.
- Thailand: A well-established automotive manufacturing base, supportive government policies, and regional export opportunities contribute to Thailand's leading position.
Within vehicle types, Light Commercial Vehicles (LCVs) currently constitute the largest segment due to their affordability and utility in various sectors. However, the Medium- and Heavy-duty Commercial Vehicle (M&HCV) segment is predicted to exhibit faster growth during the forecast period, propelled by infrastructure development and e-commerce expansion.
- Key Drivers for Indonesia: Government incentives for automotive manufacturing, growing middle class, and infrastructure development projects.
- Key Drivers for Thailand: Established automotive manufacturing ecosystem, regional export hub, and supportive government policies.
- Key Drivers for LCV segment: Affordability, versatility, and demand from various industries like logistics and retail.
- Key Drivers for M&HCV segment: Infrastructure projects, increasing freight transportation needs, and the expansion of e-commerce.
ASEAN Vehicle Industry Product Innovations
Significant product innovations are shaping the ASEAN vehicle industry, with a strong focus on electric vehicles (EVs), advanced driver-assistance systems (ADAS), and connected car technologies. Manufacturers are enhancing fuel efficiency, safety features, and infotainment systems to cater to evolving consumer preferences. The introduction of EVs is driven by environmental concerns and government regulations aimed at reducing carbon emissions. Companies are adapting their product portfolios to accommodate this shift by offering hybrid and fully electric vehicles.
Report Segmentation & Scope
This report segments the ASEAN vehicle market by country (Indonesia, Thailand, Vietnam, Singapore, Malaysia, Philippines, Rest of ASEAN) and by vehicle type (Light Commercial Vehicles, Medium- and Heavy-duty Commercial Vehicles). Each segment's growth projection, market size, and competitive dynamics are analyzed in detail. The report provides granular insights into the market characteristics of each country and vehicle type, offering a comprehensive view of the industry.
Key Drivers of ASEAN Vehicle Industry Growth
Several factors are driving the growth of the ASEAN vehicle industry. Economic growth in the region is a primary driver, leading to increased disposable incomes and consumer spending on vehicles. Government initiatives promoting automotive manufacturing and infrastructure development also play a crucial role. Technological advancements, such as the adoption of EVs and connected car technologies, are creating new market opportunities and driving innovation.
Challenges in the ASEAN Vehicle Industry Sector
The ASEAN vehicle industry faces several challenges, including infrastructural limitations in some countries, the volatile price of raw materials, and the global chip shortage. Stringent emission regulations and the increasing adoption of EVs require significant investments in research and development and manufacturing capacity adjustments. Competition from both domestic and international players can also put pressure on profit margins.
Leading Players in the ASEAN Vehicle Industry Market
- Hino Motors Ltd
- Daihatsu Motor Co Ltd
- Tata Motors
- ISUZU MOTORS LIMITED
- Hyundai Motor Company
- FCA US LLC
- Scania
- UD Trucks Corp
- IVECO
- Honda Motor Co Ltd
- MITSUBISHI MOTORS CORPORATION
- Ford Motor Company
Key Developments in ASEAN Vehicle Industry Sector
- Oct 2022: Energy Absolute PCL announced plans to launch a 1-ton electric pickup truck under the MINE brand in Q4/2022, prioritizing commercial vehicles before focusing on its electric passenger car, MINE SPA1.
- Sep 2022: PT Indika Energy Tbk. established a joint venture, PT Foxconn Indika Motor (FIM), with Foxconn to manufacture commercial electric vehicles and batteries, reinforcing its commitment to net-zero emissions.
- Jun 2022: MAN Truck & Bus (M) Sdn Bhd delivered its first batch of new MAN Truck Generation vehicles to six transport companies, highlighting the adoption of Euro V engines.
Strategic ASEAN Vehicle Industry Market Outlook
The ASEAN vehicle industry holds substantial growth potential, driven by rising incomes, infrastructure development, and technological advancements. Strategic opportunities exist in the EV segment, with significant market expansion expected. Companies should prioritize investments in R&D, sustainable manufacturing practices, and building strong partnerships to capitalize on this potential. The focus on localization and regional collaboration will be crucial for sustained growth in the coming years.
ASEAN Vehicle Industry Segmentation
-
1. Vehicle Type
- 1.1. Light Commercial Vehicles
- 1.2. Medium- and Heavy-duty Commercial Vehicles
ASEAN Vehicle Industry Segmentation By Geography
-
1. North America
- 1.1. United States
- 1.2. Canada
- 1.3. Mexico
-
2. South America
- 2.1. Brazil
- 2.2. Argentina
- 2.3. Rest of South America
-
3. Europe
- 3.1. United Kingdom
- 3.2. Germany
- 3.3. France
- 3.4. Italy
- 3.5. Spain
- 3.6. Russia
- 3.7. Benelux
- 3.8. Nordics
- 3.9. Rest of Europe
-
4. Middle East & Africa
- 4.1. Turkey
- 4.2. Israel
- 4.3. GCC
- 4.4. North Africa
- 4.5. South Africa
- 4.6. Rest of Middle East & Africa
-
5. Asia Pacific
- 5.1. China
- 5.2. India
- 5.3. Japan
- 5.4. South Korea
- 5.5. ASEAN
- 5.6. Oceania
- 5.7. Rest of Asia Pacific

ASEAN Vehicle Industry REPORT HIGHLIGHTS
| Aspects | Details |
|---|---|
| Study Period | 2019-2033 |
| Base Year | 2024 |
| Estimated Year | 2025 |
| Forecast Period | 2025-2033 |
| Historical Period | 2019-2024 |
| Growth Rate | CAGR of 6.97% from 2019-2033 |
| Segmentation |
|
Table of Contents
- 1. Introduction
- 1.1. Research Scope
- 1.2. Market Segmentation
- 1.3. Research Methodology
- 1.4. Definitions and Assumptions
- 2. Executive Summary
- 2.1. Introduction
- 3. Market Dynamics
- 3.1. Introduction
- 3.2. Market Drivers
- 3.2.1. Technological Advancements In Vehicles Driving Demand; Others
- 3.3. Market Restrains
- 3.3.1. High Scan Tool Costs to Limit Growth; Others
- 3.4. Market Trends
- 3.4.1. The Light Commercial Vehicle Segment Dominates the Market
- 4. Market Factor Analysis
- 4.1. Porters Five Forces
- 4.2. Supply/Value Chain
- 4.3. PESTEL analysis
- 4.4. Market Entropy
- 4.5. Patent/Trademark Analysis
- 5. Global ASEAN Vehicle Industry Analysis, Insights and Forecast, 2019-2031
- 5.1. Market Analysis, Insights and Forecast - by Vehicle Type
- 5.1.1. Light Commercial Vehicles
- 5.1.2. Medium- and Heavy-duty Commercial Vehicles
- 5.2. Market Analysis, Insights and Forecast - by Region
- 5.2.1. North America
- 5.2.2. South America
- 5.2.3. Europe
- 5.2.4. Middle East & Africa
- 5.2.5. Asia Pacific
- 5.1. Market Analysis, Insights and Forecast - by Vehicle Type
- 6. North America ASEAN Vehicle Industry Analysis, Insights and Forecast, 2019-2031
- 6.1. Market Analysis, Insights and Forecast - by Vehicle Type
- 6.1.1. Light Commercial Vehicles
- 6.1.2. Medium- and Heavy-duty Commercial Vehicles
- 6.1. Market Analysis, Insights and Forecast - by Vehicle Type
- 7. South America ASEAN Vehicle Industry Analysis, Insights and Forecast, 2019-2031
- 7.1. Market Analysis, Insights and Forecast - by Vehicle Type
- 7.1.1. Light Commercial Vehicles
- 7.1.2. Medium- and Heavy-duty Commercial Vehicles
- 7.1. Market Analysis, Insights and Forecast - by Vehicle Type
- 8. Europe ASEAN Vehicle Industry Analysis, Insights and Forecast, 2019-2031
- 8.1. Market Analysis, Insights and Forecast - by Vehicle Type
- 8.1.1. Light Commercial Vehicles
- 8.1.2. Medium- and Heavy-duty Commercial Vehicles
- 8.1. Market Analysis, Insights and Forecast - by Vehicle Type
- 9. Middle East & Africa ASEAN Vehicle Industry Analysis, Insights and Forecast, 2019-2031
- 9.1. Market Analysis, Insights and Forecast - by Vehicle Type
- 9.1.1. Light Commercial Vehicles
- 9.1.2. Medium- and Heavy-duty Commercial Vehicles
- 9.1. Market Analysis, Insights and Forecast - by Vehicle Type
- 10. Asia Pacific ASEAN Vehicle Industry Analysis, Insights and Forecast, 2019-2031
- 10.1. Market Analysis, Insights and Forecast - by Vehicle Type
- 10.1.1. Light Commercial Vehicles
- 10.1.2. Medium- and Heavy-duty Commercial Vehicles
- 10.1. Market Analysis, Insights and Forecast - by Vehicle Type
- 11. Germany ASEAN Vehicle Industry Analysis, Insights and Forecast, 2019-2031
- 11.1. Market Analysis, Insights and Forecast - By Country/Sub-region
- 11.1.1.
- 12. United Kingdom ASEAN Vehicle Industry Analysis, Insights and Forecast, 2019-2031
- 12.1. Market Analysis, Insights and Forecast - By Country/Sub-region
- 12.1.1.
- 13. France ASEAN Vehicle Industry Analysis, Insights and Forecast, 2019-2031
- 13.1. Market Analysis, Insights and Forecast - By Country/Sub-region
- 13.1.1.
- 14. Spain ASEAN Vehicle Industry Analysis, Insights and Forecast, 2019-2031
- 14.1. Market Analysis, Insights and Forecast - By Country/Sub-region
- 14.1.1.
- 15. Rest of Europe ASEAN Vehicle Industry Analysis, Insights and Forecast, 2019-2031
- 15.1. Market Analysis, Insights and Forecast - By Country/Sub-region
- 15.1.1.
- 16. Competitive Analysis
- 16.1. Global Market Share Analysis 2024
- 16.2. Company Profiles
- 16.2.1 Hino Motors Ltd
- 16.2.1.1. Overview
- 16.2.1.2. Products
- 16.2.1.3. SWOT Analysis
- 16.2.1.4. Recent Developments
- 16.2.1.5. Financials (Based on Availability)
- 16.2.2 Daihatsu Motor Co Ltd
- 16.2.2.1. Overview
- 16.2.2.2. Products
- 16.2.2.3. SWOT Analysis
- 16.2.2.4. Recent Developments
- 16.2.2.5. Financials (Based on Availability)
- 16.2.3 Tata Motors
- 16.2.3.1. Overview
- 16.2.3.2. Products
- 16.2.3.3. SWOT Analysis
- 16.2.3.4. Recent Developments
- 16.2.3.5. Financials (Based on Availability)
- 16.2.4 ISUZU MOTORS LIMITED
- 16.2.4.1. Overview
- 16.2.4.2. Products
- 16.2.4.3. SWOT Analysis
- 16.2.4.4. Recent Developments
- 16.2.4.5. Financials (Based on Availability)
- 16.2.5 Hyundai Motor Company
- 16.2.5.1. Overview
- 16.2.5.2. Products
- 16.2.5.3. SWOT Analysis
- 16.2.5.4. Recent Developments
- 16.2.5.5. Financials (Based on Availability)
- 16.2.6 FCA US LLC
- 16.2.6.1. Overview
- 16.2.6.2. Products
- 16.2.6.3. SWOT Analysis
- 16.2.6.4. Recent Developments
- 16.2.6.5. Financials (Based on Availability)
- 16.2.7 Scania
- 16.2.7.1. Overview
- 16.2.7.2. Products
- 16.2.7.3. SWOT Analysis
- 16.2.7.4. Recent Developments
- 16.2.7.5. Financials (Based on Availability)
- 16.2.8 UD Trucks Corp
- 16.2.8.1. Overview
- 16.2.8.2. Products
- 16.2.8.3. SWOT Analysis
- 16.2.8.4. Recent Developments
- 16.2.8.5. Financials (Based on Availability)
- 16.2.9 IVECO
- 16.2.9.1. Overview
- 16.2.9.2. Products
- 16.2.9.3. SWOT Analysis
- 16.2.9.4. Recent Developments
- 16.2.9.5. Financials (Based on Availability)
- 16.2.10 Honda Motor Co Ltd
- 16.2.10.1. Overview
- 16.2.10.2. Products
- 16.2.10.3. SWOT Analysis
- 16.2.10.4. Recent Developments
- 16.2.10.5. Financials (Based on Availability)
- 16.2.11 MITSUBISHI MOTORS CORPORATION
- 16.2.11.1. Overview
- 16.2.11.2. Products
- 16.2.11.3. SWOT Analysis
- 16.2.11.4. Recent Developments
- 16.2.11.5. Financials (Based on Availability)
- 16.2.12 Ford Motor Company
- 16.2.12.1. Overview
- 16.2.12.2. Products
- 16.2.12.3. SWOT Analysis
- 16.2.12.4. Recent Developments
- 16.2.12.5. Financials (Based on Availability)
- 16.2.1 Hino Motors Ltd
List of Figures
- Figure 1: Global ASEAN Vehicle Industry Revenue Breakdown (Million, %) by Region 2024 & 2032
- Figure 2: Germany ASEAN Vehicle Industry Revenue (Million), by Country 2024 & 2032
- Figure 3: Germany ASEAN Vehicle Industry Revenue Share (%), by Country 2024 & 2032
- Figure 4: United Kingdom ASEAN Vehicle Industry Revenue (Million), by Country 2024 & 2032
- Figure 5: United Kingdom ASEAN Vehicle Industry Revenue Share (%), by Country 2024 & 2032
- Figure 6: France ASEAN Vehicle Industry Revenue (Million), by Country 2024 & 2032
- Figure 7: France ASEAN Vehicle Industry Revenue Share (%), by Country 2024 & 2032
- Figure 8: Spain ASEAN Vehicle Industry Revenue (Million), by Country 2024 & 2032
- Figure 9: Spain ASEAN Vehicle Industry Revenue Share (%), by Country 2024 & 2032
- Figure 10: Rest of Europe ASEAN Vehicle Industry Revenue (Million), by Country 2024 & 2032
- Figure 11: Rest of Europe ASEAN Vehicle Industry Revenue Share (%), by Country 2024 & 2032
- Figure 12: North America ASEAN Vehicle Industry Revenue (Million), by Vehicle Type 2024 & 2032
- Figure 13: North America ASEAN Vehicle Industry Revenue Share (%), by Vehicle Type 2024 & 2032
- Figure 14: North America ASEAN Vehicle Industry Revenue (Million), by Country 2024 & 2032
- Figure 15: North America ASEAN Vehicle Industry Revenue Share (%), by Country 2024 & 2032
- Figure 16: South America ASEAN Vehicle Industry Revenue (Million), by Vehicle Type 2024 & 2032
- Figure 17: South America ASEAN Vehicle Industry Revenue Share (%), by Vehicle Type 2024 & 2032
- Figure 18: South America ASEAN Vehicle Industry Revenue (Million), by Country 2024 & 2032
- Figure 19: South America ASEAN Vehicle Industry Revenue Share (%), by Country 2024 & 2032
- Figure 20: Europe ASEAN Vehicle Industry Revenue (Million), by Vehicle Type 2024 & 2032
- Figure 21: Europe ASEAN Vehicle Industry Revenue Share (%), by Vehicle Type 2024 & 2032
- Figure 22: Europe ASEAN Vehicle Industry Revenue (Million), by Country 2024 & 2032
- Figure 23: Europe ASEAN Vehicle Industry Revenue Share (%), by Country 2024 & 2032
- Figure 24: Middle East & Africa ASEAN Vehicle Industry Revenue (Million), by Vehicle Type 2024 & 2032
- Figure 25: Middle East & Africa ASEAN Vehicle Industry Revenue Share (%), by Vehicle Type 2024 & 2032
- Figure 26: Middle East & Africa ASEAN Vehicle Industry Revenue (Million), by Country 2024 & 2032
- Figure 27: Middle East & Africa ASEAN Vehicle Industry Revenue Share (%), by Country 2024 & 2032
- Figure 28: Asia Pacific ASEAN Vehicle Industry Revenue (Million), by Vehicle Type 2024 & 2032
- Figure 29: Asia Pacific ASEAN Vehicle Industry Revenue Share (%), by Vehicle Type 2024 & 2032
- Figure 30: Asia Pacific ASEAN Vehicle Industry Revenue (Million), by Country 2024 & 2032
- Figure 31: Asia Pacific ASEAN Vehicle Industry Revenue Share (%), by Country 2024 & 2032
List of Tables
- Table 1: Global ASEAN Vehicle Industry Revenue Million Forecast, by Region 2019 & 2032
- Table 2: Global ASEAN Vehicle Industry Revenue Million Forecast, by Vehicle Type 2019 & 2032
- Table 3: Global ASEAN Vehicle Industry Revenue Million Forecast, by Region 2019 & 2032
- Table 4: Global ASEAN Vehicle Industry Revenue Million Forecast, by Country 2019 & 2032
- Table 5: ASEAN Vehicle Industry Revenue (Million) Forecast, by Application 2019 & 2032
- Table 6: Global ASEAN Vehicle Industry Revenue Million Forecast, by Country 2019 & 2032
- Table 7: ASEAN Vehicle Industry Revenue (Million) Forecast, by Application 2019 & 2032
- Table 8: Global ASEAN Vehicle Industry Revenue Million Forecast, by Country 2019 & 2032
- Table 9: ASEAN Vehicle Industry Revenue (Million) Forecast, by Application 2019 & 2032
- Table 10: Global ASEAN Vehicle Industry Revenue Million Forecast, by Country 2019 & 2032
- Table 11: ASEAN Vehicle Industry Revenue (Million) Forecast, by Application 2019 & 2032
- Table 12: Global ASEAN Vehicle Industry Revenue Million Forecast, by Country 2019 & 2032
- Table 13: ASEAN Vehicle Industry Revenue (Million) Forecast, by Application 2019 & 2032
- Table 14: Global ASEAN Vehicle Industry Revenue Million Forecast, by Vehicle Type 2019 & 2032
- Table 15: Global ASEAN Vehicle Industry Revenue Million Forecast, by Country 2019 & 2032
- Table 16: United States ASEAN Vehicle Industry Revenue (Million) Forecast, by Application 2019 & 2032
- Table 17: Canada ASEAN Vehicle Industry Revenue (Million) Forecast, by Application 2019 & 2032
- Table 18: Mexico ASEAN Vehicle Industry Revenue (Million) Forecast, by Application 2019 & 2032
- Table 19: Global ASEAN Vehicle Industry Revenue Million Forecast, by Vehicle Type 2019 & 2032
- Table 20: Global ASEAN Vehicle Industry Revenue Million Forecast, by Country 2019 & 2032
- Table 21: Brazil ASEAN Vehicle Industry Revenue (Million) Forecast, by Application 2019 & 2032
- Table 22: Argentina ASEAN Vehicle Industry Revenue (Million) Forecast, by Application 2019 & 2032
- Table 23: Rest of South America ASEAN Vehicle Industry Revenue (Million) Forecast, by Application 2019 & 2032
- Table 24: Global ASEAN Vehicle Industry Revenue Million Forecast, by Vehicle Type 2019 & 2032
- Table 25: Global ASEAN Vehicle Industry Revenue Million Forecast, by Country 2019 & 2032
- Table 26: United Kingdom ASEAN Vehicle Industry Revenue (Million) Forecast, by Application 2019 & 2032
- Table 27: Germany ASEAN Vehicle Industry Revenue (Million) Forecast, by Application 2019 & 2032
- Table 28: France ASEAN Vehicle Industry Revenue (Million) Forecast, by Application 2019 & 2032
- Table 29: Italy ASEAN Vehicle Industry Revenue (Million) Forecast, by Application 2019 & 2032
- Table 30: Spain ASEAN Vehicle Industry Revenue (Million) Forecast, by Application 2019 & 2032
- Table 31: Russia ASEAN Vehicle Industry Revenue (Million) Forecast, by Application 2019 & 2032
- Table 32: Benelux ASEAN Vehicle Industry Revenue (Million) Forecast, by Application 2019 & 2032
- Table 33: Nordics ASEAN Vehicle Industry Revenue (Million) Forecast, by Application 2019 & 2032
- Table 34: Rest of Europe ASEAN Vehicle Industry Revenue (Million) Forecast, by Application 2019 & 2032
- Table 35: Global ASEAN Vehicle Industry Revenue Million Forecast, by Vehicle Type 2019 & 2032
- Table 36: Global ASEAN Vehicle Industry Revenue Million Forecast, by Country 2019 & 2032
- Table 37: Turkey ASEAN Vehicle Industry Revenue (Million) Forecast, by Application 2019 & 2032
- Table 38: Israel ASEAN Vehicle Industry Revenue (Million) Forecast, by Application 2019 & 2032
- Table 39: GCC ASEAN Vehicle Industry Revenue (Million) Forecast, by Application 2019 & 2032
- Table 40: North Africa ASEAN Vehicle Industry Revenue (Million) Forecast, by Application 2019 & 2032
- Table 41: South Africa ASEAN Vehicle Industry Revenue (Million) Forecast, by Application 2019 & 2032
- Table 42: Rest of Middle East & Africa ASEAN Vehicle Industry Revenue (Million) Forecast, by Application 2019 & 2032
- Table 43: Global ASEAN Vehicle Industry Revenue Million Forecast, by Vehicle Type 2019 & 2032
- Table 44: Global ASEAN Vehicle Industry Revenue Million Forecast, by Country 2019 & 2032
- Table 45: China ASEAN Vehicle Industry Revenue (Million) Forecast, by Application 2019 & 2032
- Table 46: India ASEAN Vehicle Industry Revenue (Million) Forecast, by Application 2019 & 2032
- Table 47: Japan ASEAN Vehicle Industry Revenue (Million) Forecast, by Application 2019 & 2032
- Table 48: South Korea ASEAN Vehicle Industry Revenue (Million) Forecast, by Application 2019 & 2032
- Table 49: ASEAN ASEAN Vehicle Industry Revenue (Million) Forecast, by Application 2019 & 2032
- Table 50: Oceania ASEAN Vehicle Industry Revenue (Million) Forecast, by Application 2019 & 2032
- Table 51: Rest of Asia Pacific ASEAN Vehicle Industry Revenue (Million) Forecast, by Application 2019 & 2032
Frequently Asked Questions
1. What is the projected Compound Annual Growth Rate (CAGR) of the ASEAN Vehicle Industry?
The projected CAGR is approximately 6.97%.
2. Which companies are prominent players in the ASEAN Vehicle Industry?
Key companies in the market include Hino Motors Ltd, Daihatsu Motor Co Ltd, Tata Motors, ISUZU MOTORS LIMITED, Hyundai Motor Company, FCA US LLC, Scania, UD Trucks Corp, IVECO, Honda Motor Co Ltd, MITSUBISHI MOTORS CORPORATION, Ford Motor Company.
3. What are the main segments of the ASEAN Vehicle Industry?
The market segments include Vehicle Type.
4. Can you provide details about the market size?
The market size is estimated to be USD 55.74 Million as of 2022.
5. What are some drivers contributing to market growth?
Technological Advancements In Vehicles Driving Demand; Others.
6. What are the notable trends driving market growth?
The Light Commercial Vehicle Segment Dominates the Market.
7. Are there any restraints impacting market growth?
High Scan Tool Costs to Limit Growth; Others.
8. Can you provide examples of recent developments in the market?
Oct 2022- Energy Absolute PCL revealed that the development of its 100% electric passenger car MINE SPA1 under MINE Mobility was still one of EA's major business plans. The current focus of EA would be on commercial vehicles first, while the MINE SPA1 electric car project would be continued. EA also revealed that it plans to launch a 1-ton electric pickup truck under the brand MINE in Q4/2022.
9. What pricing options are available for accessing the report?
Pricing options include single-user, multi-user, and enterprise licenses priced at USD 3800, USD 4500, and USD 5800 respectively.
10. Is the market size provided in terms of value or volume?
The market size is provided in terms of value, measured in Million.
11. Are there any specific market keywords associated with the report?
Yes, the market keyword associated with the report is "ASEAN Vehicle Industry," which aids in identifying and referencing the specific market segment covered.
12. How do I determine which pricing option suits my needs best?
The pricing options vary based on user requirements and access needs. Individual users may opt for single-user licenses, while businesses requiring broader access may choose multi-user or enterprise licenses for cost-effective access to the report.
13. Are there any additional resources or data provided in the ASEAN Vehicle Industry report?
While the report offers comprehensive insights, it's advisable to review the specific contents or supplementary materials provided to ascertain if additional resources or data are available.
14. How can I stay updated on further developments or reports in the ASEAN Vehicle Industry?
To stay informed about further developments, trends, and reports in the ASEAN Vehicle Industry, consider subscribing to industry newsletters, following relevant companies and organizations, or regularly checking reputable industry news sources and publications.
Methodology
Step 1 - Identification of Relevant Samples Size from Population Database


Step 2 - Approaches for Defining Global Market Size (Value, Volume* & Price*)

Note*: In applicable scenarios
Step 3 - Data Sources
Primary Research
- Web Analytics
- Survey Reports
- Research Institute
- Latest Research Reports
- Opinion Leaders
Secondary Research
- Annual Reports
- White Paper
- Latest Press Release
- Industry Association
- Paid Database
- Investor Presentations

Step 4 - Data Triangulation
Involves using different sources of information in order to increase the validity of a study
These sources are likely to be stakeholders in a program - participants, other researchers, program staff, other community members, and so on.
Then we put all data in single framework & apply various statistical tools to find out the dynamic on the market.
During the analysis stage, feedback from the stakeholder groups would be compared to determine areas of agreement as well as areas of divergence


