
Key Insights
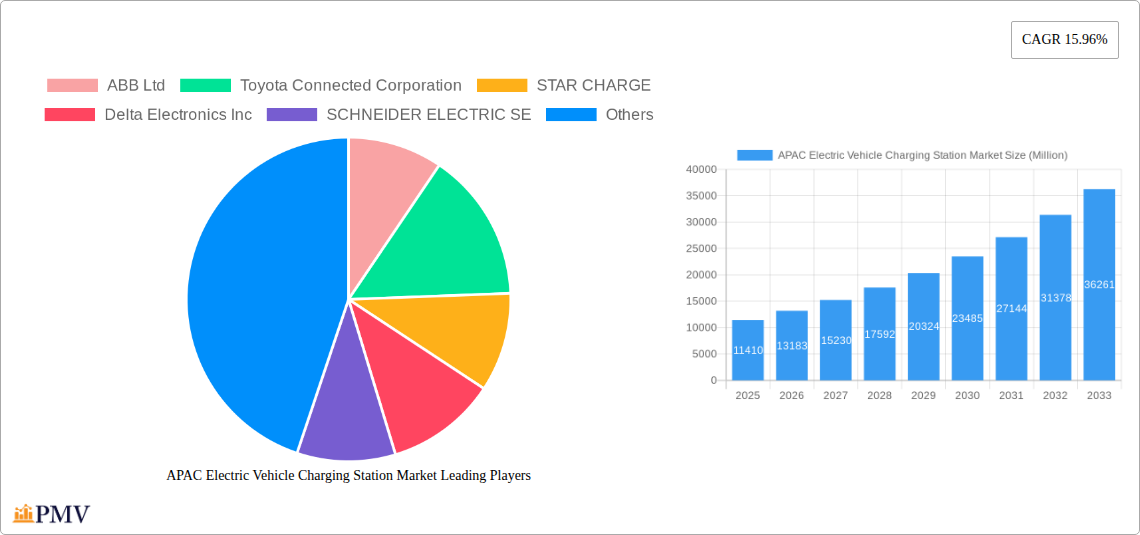
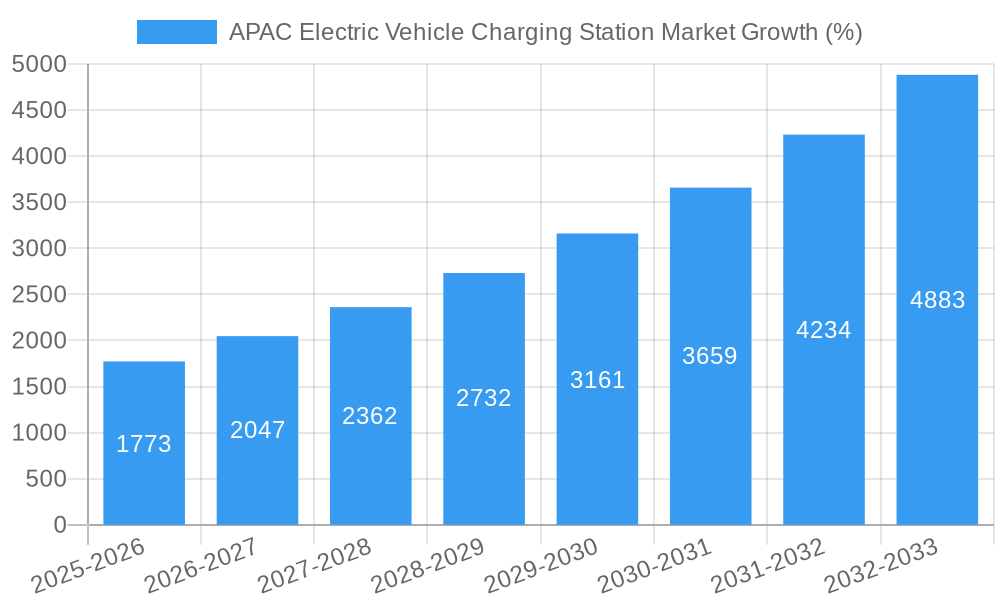
The Asia-Pacific (APAC) electric vehicle (EV) charging station market is experiencing robust growth, driven by increasing EV adoption, supportive government policies promoting sustainable transportation, and expanding charging infrastructure. The market, valued at approximately $11.41 billion in 2025, is projected to exhibit a Compound Annual Growth Rate (CAGR) of 15.96% from 2025 to 2033. This significant expansion is fueled by several key factors. China, India, Japan, and South Korea are leading the charge, with substantial investments in public and private charging networks. The rising demand for passenger cars and commercial vehicles, coupled with technological advancements in both AC and DC charging stations, contributes to the market's dynamism. However, challenges remain, such as the uneven distribution of charging infrastructure across the region, high initial investment costs for deploying charging stations, and the need for standardization across different charging technologies. Overcoming these limitations through strategic partnerships between governments, private companies, and technology providers will be crucial for sustaining the market's growth trajectory.
The segmentation of the market reveals diverse opportunities. The passenger car segment currently dominates, but the commercial vehicle segment is expected to experience faster growth in the coming years due to the increasing adoption of electric buses and delivery trucks. Similarly, while AC charging stations currently hold a larger market share, the demand for faster DC charging stations is growing rapidly, particularly in urban areas with high EV traffic. The public charging segment holds substantial potential for expansion, given the increasing focus on providing convenient and accessible charging options for EV users. Geographically, China is expected to maintain its position as the largest market within APAC due to its massive EV production and deployment and supportive government initiatives. However, other countries in the region, such as India and South Korea, are poised for significant growth, driven by their proactive government policies and increasing EV adoption rates. Key players like ABB, Tesla, and local companies are actively involved in developing and deploying charging solutions, leading to a highly competitive landscape. This competitive environment will ultimately benefit consumers through improved technology, better pricing, and broader availability of charging options.
APAC Electric Vehicle Charging Station Market: A Comprehensive Report (2019-2033)
This detailed report provides a comprehensive analysis of the Asia-Pacific (APAC) electric vehicle (EV) charging station market, offering valuable insights for stakeholders across the industry. Covering the period from 2019 to 2033, with a focus on 2025, this report dissects market dynamics, competitive landscapes, and future growth projections, empowering informed decision-making. The study encompasses key segments, including vehicle type, charger type, application type, and country-specific analyses for China, India, Japan, South Korea, and the Rest of Asia-Pacific.
APAC Electric Vehicle Charging Station Market Structure & Competitive Dynamics
The APAC EV charging station market exhibits a moderately concentrated structure, with a mix of established multinational corporations and emerging local players. Market share is dynamic, with significant fluctuations based on technological advancements, strategic partnerships, and government initiatives. Key players like ABB Ltd, Siemens AG, SCHNEIDER ELECTRIC SE, and Tesla Inc. are vying for market dominance, while innovative startups such as Charge+Zone and Charzer Tech Pvt Ltd are rapidly gaining traction.
The APAC region's innovation ecosystem is thriving, driven by significant investments in R&D, particularly in areas such as fast-charging technologies, smart grid integration, and battery management systems. Stringent government regulations promoting EV adoption and infrastructure development are further shaping the competitive landscape. The market also faces competitive pressures from alternative energy solutions and potential substitutes, impacting the overall market share distribution. M&A activity is relatively high, with deal values ranging from USD xx Million to USD xx Million, primarily focused on expanding market reach and enhancing technological capabilities. Examples include recent partnerships between established players and smaller startups aiming to accelerate the rollout of EV charging infrastructure across the region. The market concentration is approximately xx%, and the average M&A deal value is estimated at USD xx Million.
APAC Electric Vehicle Charging Station Market Industry Trends & Insights
The APAC EV charging station market is experiencing robust growth, driven by supportive government policies, rising EV adoption rates, and increasing environmental awareness. The market exhibits a Compound Annual Growth Rate (CAGR) of xx% during the forecast period (2025-2033). Technological advancements, particularly in fast-charging technologies (e.g., ultra-fast DC chargers) are significantly impacting market dynamics, reducing charging times and enhancing user experience. Consumer preferences are shifting towards convenient and reliable charging solutions, creating demand for public charging stations in densely populated urban areas and along major highways. The market penetration of EV charging stations in major APAC cities is expected to reach xx% by 2033. This is largely fueled by the increasing adoption of electric vehicles across the region. However, the market is not without its challenges, which include managing the grid integration impacts of widespread charging infrastructure and resolving uneven distribution of charging stations in certain regions. Competition remains fierce, with both established companies and new entrants continuously innovating to secure a larger market share.
Dominant Markets & Segments in APAC Electric Vehicle Charging Station Market
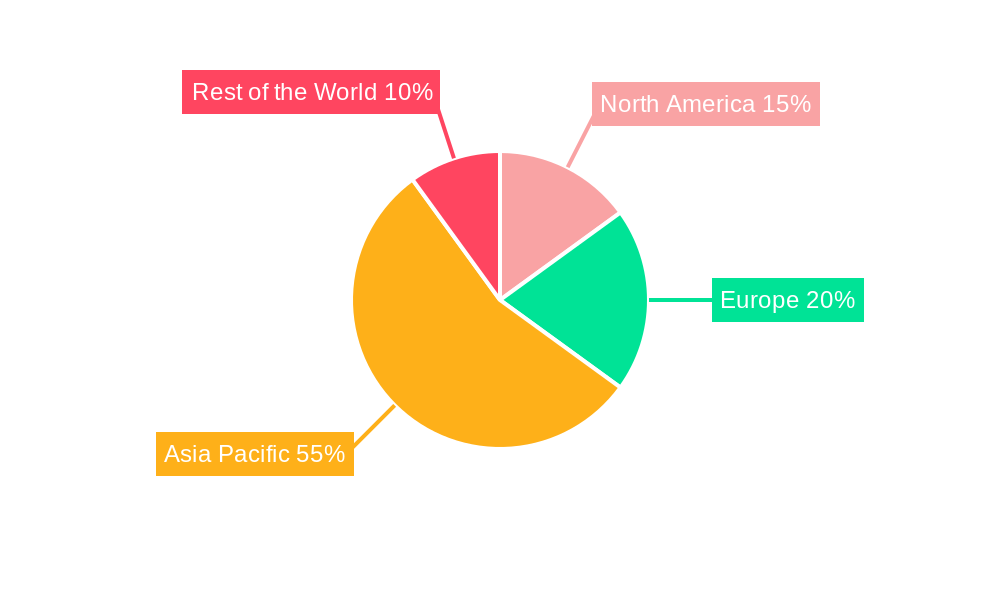
- Leading Region: China dominates the APAC EV charging station market, driven by strong government support, substantial investments, and a large EV consumer base. India is a rapidly emerging market, experiencing significant growth.
- Leading Country: China maintains its position as the dominant market due to its massive EV market size and extensive government support for charging infrastructure development.
- Leading Vehicle Type: Passenger cars currently represent the largest segment, but commercial vehicles are expected to witness significant growth owing to government incentives and fleet electrification initiatives.
- Leading Charger Type: DC fast charging stations are gaining popularity due to their efficiency, but AC charging stations still hold a significant market share, particularly in residential and private applications.
- Leading Application Type: Public charging stations are experiencing the highest growth rate, owing to increasing demand from EV users in urban areas and along major transportation routes. Private charging solutions (at homes and workplaces) remain crucial, especially for early adopters.
Key Drivers for Dominance:
- China: Extensive government subsidies, large EV manufacturing base, massive consumer demand, and strategic investments in grid infrastructure.
- India: Rising EV sales, supportive government policies, expanding charging network initiatives, and decreasing battery costs.
- Passenger Cars: High consumer demand, affordability, and expanding model availability.
- DC Charging Stations: Faster charging times, improved convenience for long-distance travel, and increasing consumer acceptance.
- Public Charging Stations: Enhanced convenience, accessibility, and availability in urban areas and along major highways.
APAC Electric Vehicle Charging Station Market Product Innovations
Recent product innovations include the introduction of ultra-fast DC chargers capable of significantly reducing charging times, intelligent charging solutions with smart grid integration, and advanced battery management systems to optimize charging efficiency and extend battery lifespan. These advancements are designed to address consumer concerns about range anxiety and charging times, ultimately accelerating the adoption of EVs. These new chargers are also designed to be more robust and have features such as better heat dissipation for enhanced performance and longevity. The market is witnessing an increased focus on user-friendly mobile apps for easy station locating and payment processing, promoting seamless user experience.
Report Segmentation & Scope
The report segments the APAC EV charging station market based on:
Vehicle Type: Passenger Car and Commercial Vehicle. Passenger cars currently dominate, while commercial vehicles are poised for rapid growth. Growth projections for each segment are provided in the full report.
Charger Type: AC Charging Station and DC Charging Station. Both segments are analyzed based on market size, growth trends, and competitive landscapes. The report predicts a shift toward higher adoption of DC fast chargers.
Application Type: Public and Private. The report assesses the market share and growth potential of both segments. Public charging infrastructure expansion is expected to be a key driver.
Country: China, India, Japan, South Korea, and Rest of Asia-Pacific. Each country is analyzed individually, considering its unique market characteristics and growth drivers. The report predicts continued dominance of China and strong growth in India.
Key Drivers of APAC Electric Vehicle Charging Station Market Growth
The APAC EV charging station market's growth is propelled by several factors:
Government Initiatives: Significant investments in EV infrastructure development, subsidies, and tax incentives are fostering market expansion.
Technological Advancements: Innovations in battery technology, charging infrastructure, and smart grid integration are enhancing charging efficiency and convenience.
Rising EV Sales: Increased demand for electric vehicles is driving the need for more robust charging infrastructure.
Environmental Concerns: Growing awareness of environmental issues is encouraging the adoption of cleaner transportation solutions.
Challenges in the APAC Electric Vehicle Charging Station Market Sector
Challenges facing the APAC EV charging station market include:
Grid Infrastructure Limitations: Integrating a large-scale EV charging network into existing grid infrastructure poses significant challenges in some regions.
High Initial Investment Costs: Setting up charging stations requires substantial capital investment, potentially hindering growth in certain areas.
Uneven Distribution of Charging Stations: The uneven distribution of charging infrastructure across the APAC region creates barriers to widespread EV adoption.
Standardization Issues: Lack of standardization in charging technologies and protocols can impede interoperability and market growth.
Leading Players in the APAC Electric Vehicle Charging Station Market Market
- ABB Ltd
- Toyota Connected Corporation
- STAR CHARGE
- Delta Electronics Inc
- SCHNEIDER ELECTRIC SE
- Siemens AG
- Kinetic Green Energy and Power Solutions Ltd
- Tesla Inc
- Tata Power Company Limited
- TecSo ChargeZone Ltd
- e-Mobility Power Inc
- Charzer Tech Pvt Ltd
- Exicom Telesystems Ltd
Key Developments in APAC Electric Vehicle Charging Station Market Sector
July 2023: Volkswagen AG invests USD 110 Million in Chinese charging infrastructure, partnering with CAMS New Energy Technology.
June 2023: Charge+Zone installs 1,600 charging stations in India and commits USD 125 Million to expand its network to over 5,000 kilometers.
September 2022: Tritium plans a 7,000-kilometer charging corridor in Western Australia.
March 2022: Automovil partners with Midgard Electric to deploy 500 charging stations across 11 Indian cities.
Strategic APAC Electric Vehicle Charging Station Market Outlook
The APAC EV charging station market holds immense future potential, driven by continuous technological advancements, supportive government policies, and burgeoning EV adoption. Strategic opportunities exist for companies to capitalize on the expanding market by investing in innovative charging technologies, optimizing charging infrastructure deployment, and developing robust charging network management systems. The focus should be on addressing the challenges of grid integration, standardization, and equitable distribution to unlock the full potential of this rapidly evolving sector.
APAC Electric Vehicle Charging Station Market Segmentation
-
1. Vehicle Type
- 1.1. Passenger Car
- 1.2. Commercial Vehicle
-
2. Charger Type
- 2.1. AC Charging Station
- 2.2. DC Charging Station
-
3. Application Ttype
- 3.1. Public
- 3.2. Private
APAC Electric Vehicle Charging Station Market Segmentation By Geography
-
1. North America
- 1.1. United States
- 1.2. Canada
- 1.3. Mexico
-
2. South America
- 2.1. Brazil
- 2.2. Argentina
- 2.3. Rest of South America
-
3. Europe
- 3.1. United Kingdom
- 3.2. Germany
- 3.3. France
- 3.4. Italy
- 3.5. Spain
- 3.6. Russia
- 3.7. Benelux
- 3.8. Nordics
- 3.9. Rest of Europe
-
4. Middle East & Africa
- 4.1. Turkey
- 4.2. Israel
- 4.3. GCC
- 4.4. North Africa
- 4.5. South Africa
- 4.6. Rest of Middle East & Africa
-
5. Asia Pacific
- 5.1. China
- 5.2. India
- 5.3. Japan
- 5.4. South Korea
- 5.5. ASEAN
- 5.6. Oceania
- 5.7. Rest of Asia Pacific
APAC Electric Vehicle Charging Station Market REPORT HIGHLIGHTS
| Aspects | Details |
|---|---|
| Study Period | 2019-2033 |
| Base Year | 2024 |
| Estimated Year | 2025 |
| Forecast Period | 2025-2033 |
| Historical Period | 2019-2024 |
| Growth Rate | CAGR of 15.96% from 2019-2033 |
| Segmentation |
|
Table of Contents
- 1. Introduction
- 1.1. Research Scope
- 1.2. Market Segmentation
- 1.3. Research Methodology
- 1.4. Definitions and Assumptions
- 2. Executive Summary
- 2.1. Introduction
- 3. Market Dynamics
- 3.1. Introduction
- 3.2. Market Drivers
- 3.2.1. Rise in Electric Vehicle Sales
- 3.3. Market Restrains
- 3.3.1. High Initial Cost to Slow Down-Market Growth
- 3.4. Market Trends
- 3.4.1. Rising Electric Passenger Car Sale to Fuel Charging Station Demand
- 4. Market Factor Analysis
- 4.1. Porters Five Forces
- 4.2. Supply/Value Chain
- 4.3. PESTEL analysis
- 4.4. Market Entropy
- 4.5. Patent/Trademark Analysis
- 5. Global APAC Electric Vehicle Charging Station Market Analysis, Insights and Forecast, 2019-2031
- 5.1. Market Analysis, Insights and Forecast - by Vehicle Type
- 5.1.1. Passenger Car
- 5.1.2. Commercial Vehicle
- 5.2. Market Analysis, Insights and Forecast - by Charger Type
- 5.2.1. AC Charging Station
- 5.2.2. DC Charging Station
- 5.3. Market Analysis, Insights and Forecast - by Application Ttype
- 5.3.1. Public
- 5.3.2. Private
- 5.4. Market Analysis, Insights and Forecast - by Region
- 5.4.1. North America
- 5.4.2. South America
- 5.4.3. Europe
- 5.4.4. Middle East & Africa
- 5.4.5. Asia Pacific
- 5.1. Market Analysis, Insights and Forecast - by Vehicle Type
- 6. North America APAC Electric Vehicle Charging Station Market Analysis, Insights and Forecast, 2019-2031
- 6.1. Market Analysis, Insights and Forecast - by Vehicle Type
- 6.1.1. Passenger Car
- 6.1.2. Commercial Vehicle
- 6.2. Market Analysis, Insights and Forecast - by Charger Type
- 6.2.1. AC Charging Station
- 6.2.2. DC Charging Station
- 6.3. Market Analysis, Insights and Forecast - by Application Ttype
- 6.3.1. Public
- 6.3.2. Private
- 6.1. Market Analysis, Insights and Forecast - by Vehicle Type
- 7. South America APAC Electric Vehicle Charging Station Market Analysis, Insights and Forecast, 2019-2031
- 7.1. Market Analysis, Insights and Forecast - by Vehicle Type
- 7.1.1. Passenger Car
- 7.1.2. Commercial Vehicle
- 7.2. Market Analysis, Insights and Forecast - by Charger Type
- 7.2.1. AC Charging Station
- 7.2.2. DC Charging Station
- 7.3. Market Analysis, Insights and Forecast - by Application Ttype
- 7.3.1. Public
- 7.3.2. Private
- 7.1. Market Analysis, Insights and Forecast - by Vehicle Type
- 8. Europe APAC Electric Vehicle Charging Station Market Analysis, Insights and Forecast, 2019-2031
- 8.1. Market Analysis, Insights and Forecast - by Vehicle Type
- 8.1.1. Passenger Car
- 8.1.2. Commercial Vehicle
- 8.2. Market Analysis, Insights and Forecast - by Charger Type
- 8.2.1. AC Charging Station
- 8.2.2. DC Charging Station
- 8.3. Market Analysis, Insights and Forecast - by Application Ttype
- 8.3.1. Public
- 8.3.2. Private
- 8.1. Market Analysis, Insights and Forecast - by Vehicle Type
- 9. Middle East & Africa APAC Electric Vehicle Charging Station Market Analysis, Insights and Forecast, 2019-2031
- 9.1. Market Analysis, Insights and Forecast - by Vehicle Type
- 9.1.1. Passenger Car
- 9.1.2. Commercial Vehicle
- 9.2. Market Analysis, Insights and Forecast - by Charger Type
- 9.2.1. AC Charging Station
- 9.2.2. DC Charging Station
- 9.3. Market Analysis, Insights and Forecast - by Application Ttype
- 9.3.1. Public
- 9.3.2. Private
- 9.1. Market Analysis, Insights and Forecast - by Vehicle Type
- 10. Asia Pacific APAC Electric Vehicle Charging Station Market Analysis, Insights and Forecast, 2019-2031
- 10.1. Market Analysis, Insights and Forecast - by Vehicle Type
- 10.1.1. Passenger Car
- 10.1.2. Commercial Vehicle
- 10.2. Market Analysis, Insights and Forecast - by Charger Type
- 10.2.1. AC Charging Station
- 10.2.2. DC Charging Station
- 10.3. Market Analysis, Insights and Forecast - by Application Ttype
- 10.3.1. Public
- 10.3.2. Private
- 10.1. Market Analysis, Insights and Forecast - by Vehicle Type
- 11. North America APAC Electric Vehicle Charging Station Market Analysis, Insights and Forecast, 2019-2031
- 11.1. Market Analysis, Insights and Forecast - By Country/Sub-region
- 11.1.1 United States
- 11.1.2 Canada
- 11.1.3 Rest of North America
- 12. Europe APAC Electric Vehicle Charging Station Market Analysis, Insights and Forecast, 2019-2031
- 12.1. Market Analysis, Insights and Forecast - By Country/Sub-region
- 12.1.1 United Kingdom
- 12.1.2 Germany
- 12.1.3 France
- 12.1.4 Spain
- 12.1.5 Rest of Europe
- 13. Asia Pacific APAC Electric Vehicle Charging Station Market Analysis, Insights and Forecast, 2019-2031
- 13.1. Market Analysis, Insights and Forecast - By Country/Sub-region
- 13.1.1 China
- 13.1.2 India
- 13.1.3 Japan
- 13.1.4 South Korea
- 13.1.5 Rest of Asia Pacific
- 14. Rest of the World APAC Electric Vehicle Charging Station Market Analysis, Insights and Forecast, 2019-2031
- 14.1. Market Analysis, Insights and Forecast - By Country/Sub-region
- 14.1.1 South America
- 14.1.2 Middle East and Africa
- 15. Competitive Analysis
- 15.1. Global Market Share Analysis 2024
- 15.2. Company Profiles
- 15.2.1 ABB Ltd
- 15.2.1.1. Overview
- 15.2.1.2. Products
- 15.2.1.3. SWOT Analysis
- 15.2.1.4. Recent Developments
- 15.2.1.5. Financials (Based on Availability)
- 15.2.2 Toyota Connected Corporation
- 15.2.2.1. Overview
- 15.2.2.2. Products
- 15.2.2.3. SWOT Analysis
- 15.2.2.4. Recent Developments
- 15.2.2.5. Financials (Based on Availability)
- 15.2.3 STAR CHARGE
- 15.2.3.1. Overview
- 15.2.3.2. Products
- 15.2.3.3. SWOT Analysis
- 15.2.3.4. Recent Developments
- 15.2.3.5. Financials (Based on Availability)
- 15.2.4 Delta Electronics Inc
- 15.2.4.1. Overview
- 15.2.4.2. Products
- 15.2.4.3. SWOT Analysis
- 15.2.4.4. Recent Developments
- 15.2.4.5. Financials (Based on Availability)
- 15.2.5 SCHNEIDER ELECTRIC SE
- 15.2.5.1. Overview
- 15.2.5.2. Products
- 15.2.5.3. SWOT Analysis
- 15.2.5.4. Recent Developments
- 15.2.5.5. Financials (Based on Availability)
- 15.2.6 Siemens AG
- 15.2.6.1. Overview
- 15.2.6.2. Products
- 15.2.6.3. SWOT Analysis
- 15.2.6.4. Recent Developments
- 15.2.6.5. Financials (Based on Availability)
- 15.2.7 Kinetic Green Energy and Power Solutions Lt
- 15.2.7.1. Overview
- 15.2.7.2. Products
- 15.2.7.3. SWOT Analysis
- 15.2.7.4. Recent Developments
- 15.2.7.5. Financials (Based on Availability)
- 15.2.8 Tesla Inc
- 15.2.8.1. Overview
- 15.2.8.2. Products
- 15.2.8.3. SWOT Analysis
- 15.2.8.4. Recent Developments
- 15.2.8.5. Financials (Based on Availability)
- 15.2.9 Tata Power Company Limited
- 15.2.9.1. Overview
- 15.2.9.2. Products
- 15.2.9.3. SWOT Analysis
- 15.2.9.4. Recent Developments
- 15.2.9.5. Financials (Based on Availability)
- 15.2.10 TecSo ChargeZone Ltd
- 15.2.10.1. Overview
- 15.2.10.2. Products
- 15.2.10.3. SWOT Analysis
- 15.2.10.4. Recent Developments
- 15.2.10.5. Financials (Based on Availability)
- 15.2.11 e-Mobility Power Inc
- 15.2.11.1. Overview
- 15.2.11.2. Products
- 15.2.11.3. SWOT Analysis
- 15.2.11.4. Recent Developments
- 15.2.11.5. Financials (Based on Availability)
- 15.2.12 Charzer Tech Pvt Ltd
- 15.2.12.1. Overview
- 15.2.12.2. Products
- 15.2.12.3. SWOT Analysis
- 15.2.12.4. Recent Developments
- 15.2.12.5. Financials (Based on Availability)
- 15.2.13 Exicom Telesystems Ltd
- 15.2.13.1. Overview
- 15.2.13.2. Products
- 15.2.13.3. SWOT Analysis
- 15.2.13.4. Recent Developments
- 15.2.13.5. Financials (Based on Availability)
- 15.2.1 ABB Ltd
List of Figures
- Figure 1: Global APAC Electric Vehicle Charging Station Market Revenue Breakdown (Million, %) by Region 2024 & 2032
- Figure 2: North America APAC Electric Vehicle Charging Station Market Revenue (Million), by Country 2024 & 2032
- Figure 3: North America APAC Electric Vehicle Charging Station Market Revenue Share (%), by Country 2024 & 2032
- Figure 4: Europe APAC Electric Vehicle Charging Station Market Revenue (Million), by Country 2024 & 2032
- Figure 5: Europe APAC Electric Vehicle Charging Station Market Revenue Share (%), by Country 2024 & 2032
- Figure 6: Asia Pacific APAC Electric Vehicle Charging Station Market Revenue (Million), by Country 2024 & 2032
- Figure 7: Asia Pacific APAC Electric Vehicle Charging Station Market Revenue Share (%), by Country 2024 & 2032
- Figure 8: Rest of the World APAC Electric Vehicle Charging Station Market Revenue (Million), by Country 2024 & 2032
- Figure 9: Rest of the World APAC Electric Vehicle Charging Station Market Revenue Share (%), by Country 2024 & 2032
- Figure 10: North America APAC Electric Vehicle Charging Station Market Revenue (Million), by Vehicle Type 2024 & 2032
- Figure 11: North America APAC Electric Vehicle Charging Station Market Revenue Share (%), by Vehicle Type 2024 & 2032
- Figure 12: North America APAC Electric Vehicle Charging Station Market Revenue (Million), by Charger Type 2024 & 2032
- Figure 13: North America APAC Electric Vehicle Charging Station Market Revenue Share (%), by Charger Type 2024 & 2032
- Figure 14: North America APAC Electric Vehicle Charging Station Market Revenue (Million), by Application Ttype 2024 & 2032
- Figure 15: North America APAC Electric Vehicle Charging Station Market Revenue Share (%), by Application Ttype 2024 & 2032
- Figure 16: North America APAC Electric Vehicle Charging Station Market Revenue (Million), by Country 2024 & 2032
- Figure 17: North America APAC Electric Vehicle Charging Station Market Revenue Share (%), by Country 2024 & 2032
- Figure 18: South America APAC Electric Vehicle Charging Station Market Revenue (Million), by Vehicle Type 2024 & 2032
- Figure 19: South America APAC Electric Vehicle Charging Station Market Revenue Share (%), by Vehicle Type 2024 & 2032
- Figure 20: South America APAC Electric Vehicle Charging Station Market Revenue (Million), by Charger Type 2024 & 2032
- Figure 21: South America APAC Electric Vehicle Charging Station Market Revenue Share (%), by Charger Type 2024 & 2032
- Figure 22: South America APAC Electric Vehicle Charging Station Market Revenue (Million), by Application Ttype 2024 & 2032
- Figure 23: South America APAC Electric Vehicle Charging Station Market Revenue Share (%), by Application Ttype 2024 & 2032
- Figure 24: South America APAC Electric Vehicle Charging Station Market Revenue (Million), by Country 2024 & 2032
- Figure 25: South America APAC Electric Vehicle Charging Station Market Revenue Share (%), by Country 2024 & 2032
- Figure 26: Europe APAC Electric Vehicle Charging Station Market Revenue (Million), by Vehicle Type 2024 & 2032
- Figure 27: Europe APAC Electric Vehicle Charging Station Market Revenue Share (%), by Vehicle Type 2024 & 2032
- Figure 28: Europe APAC Electric Vehicle Charging Station Market Revenue (Million), by Charger Type 2024 & 2032
- Figure 29: Europe APAC Electric Vehicle Charging Station Market Revenue Share (%), by Charger Type 2024 & 2032
- Figure 30: Europe APAC Electric Vehicle Charging Station Market Revenue (Million), by Application Ttype 2024 & 2032
- Figure 31: Europe APAC Electric Vehicle Charging Station Market Revenue Share (%), by Application Ttype 2024 & 2032
- Figure 32: Europe APAC Electric Vehicle Charging Station Market Revenue (Million), by Country 2024 & 2032
- Figure 33: Europe APAC Electric Vehicle Charging Station Market Revenue Share (%), by Country 2024 & 2032
- Figure 34: Middle East & Africa APAC Electric Vehicle Charging Station Market Revenue (Million), by Vehicle Type 2024 & 2032
- Figure 35: Middle East & Africa APAC Electric Vehicle Charging Station Market Revenue Share (%), by Vehicle Type 2024 & 2032
- Figure 36: Middle East & Africa APAC Electric Vehicle Charging Station Market Revenue (Million), by Charger Type 2024 & 2032
- Figure 37: Middle East & Africa APAC Electric Vehicle Charging Station Market Revenue Share (%), by Charger Type 2024 & 2032
- Figure 38: Middle East & Africa APAC Electric Vehicle Charging Station Market Revenue (Million), by Application Ttype 2024 & 2032
- Figure 39: Middle East & Africa APAC Electric Vehicle Charging Station Market Revenue Share (%), by Application Ttype 2024 & 2032
- Figure 40: Middle East & Africa APAC Electric Vehicle Charging Station Market Revenue (Million), by Country 2024 & 2032
- Figure 41: Middle East & Africa APAC Electric Vehicle Charging Station Market Revenue Share (%), by Country 2024 & 2032
- Figure 42: Asia Pacific APAC Electric Vehicle Charging Station Market Revenue (Million), by Vehicle Type 2024 & 2032
- Figure 43: Asia Pacific APAC Electric Vehicle Charging Station Market Revenue Share (%), by Vehicle Type 2024 & 2032
- Figure 44: Asia Pacific APAC Electric Vehicle Charging Station Market Revenue (Million), by Charger Type 2024 & 2032
- Figure 45: Asia Pacific APAC Electric Vehicle Charging Station Market Revenue Share (%), by Charger Type 2024 & 2032
- Figure 46: Asia Pacific APAC Electric Vehicle Charging Station Market Revenue (Million), by Application Ttype 2024 & 2032
- Figure 47: Asia Pacific APAC Electric Vehicle Charging Station Market Revenue Share (%), by Application Ttype 2024 & 2032
- Figure 48: Asia Pacific APAC Electric Vehicle Charging Station Market Revenue (Million), by Country 2024 & 2032
- Figure 49: Asia Pacific APAC Electric Vehicle Charging Station Market Revenue Share (%), by Country 2024 & 2032
List of Tables
- Table 1: Global APAC Electric Vehicle Charging Station Market Revenue Million Forecast, by Region 2019 & 2032
- Table 2: Global APAC Electric Vehicle Charging Station Market Revenue Million Forecast, by Vehicle Type 2019 & 2032
- Table 3: Global APAC Electric Vehicle Charging Station Market Revenue Million Forecast, by Charger Type 2019 & 2032
- Table 4: Global APAC Electric Vehicle Charging Station Market Revenue Million Forecast, by Application Ttype 2019 & 2032
- Table 5: Global APAC Electric Vehicle Charging Station Market Revenue Million Forecast, by Region 2019 & 2032
- Table 6: Global APAC Electric Vehicle Charging Station Market Revenue Million Forecast, by Country 2019 & 2032
- Table 7: United States APAC Electric Vehicle Charging Station Market Revenue (Million) Forecast, by Application 2019 & 2032
- Table 8: Canada APAC Electric Vehicle Charging Station Market Revenue (Million) Forecast, by Application 2019 & 2032
- Table 9: Rest of North America APAC Electric Vehicle Charging Station Market Revenue (Million) Forecast, by Application 2019 & 2032
- Table 10: Global APAC Electric Vehicle Charging Station Market Revenue Million Forecast, by Country 2019 & 2032
- Table 11: United Kingdom APAC Electric Vehicle Charging Station Market Revenue (Million) Forecast, by Application 2019 & 2032
- Table 12: Germany APAC Electric Vehicle Charging Station Market Revenue (Million) Forecast, by Application 2019 & 2032
- Table 13: France APAC Electric Vehicle Charging Station Market Revenue (Million) Forecast, by Application 2019 & 2032
- Table 14: Spain APAC Electric Vehicle Charging Station Market Revenue (Million) Forecast, by Application 2019 & 2032
- Table 15: Rest of Europe APAC Electric Vehicle Charging Station Market Revenue (Million) Forecast, by Application 2019 & 2032
- Table 16: Global APAC Electric Vehicle Charging Station Market Revenue Million Forecast, by Country 2019 & 2032
- Table 17: China APAC Electric Vehicle Charging Station Market Revenue (Million) Forecast, by Application 2019 & 2032
- Table 18: India APAC Electric Vehicle Charging Station Market Revenue (Million) Forecast, by Application 2019 & 2032
- Table 19: Japan APAC Electric Vehicle Charging Station Market Revenue (Million) Forecast, by Application 2019 & 2032
- Table 20: South Korea APAC Electric Vehicle Charging Station Market Revenue (Million) Forecast, by Application 2019 & 2032
- Table 21: Rest of Asia Pacific APAC Electric Vehicle Charging Station Market Revenue (Million) Forecast, by Application 2019 & 2032
- Table 22: Global APAC Electric Vehicle Charging Station Market Revenue Million Forecast, by Country 2019 & 2032
- Table 23: South America APAC Electric Vehicle Charging Station Market Revenue (Million) Forecast, by Application 2019 & 2032
- Table 24: Middle East and Africa APAC Electric Vehicle Charging Station Market Revenue (Million) Forecast, by Application 2019 & 2032
- Table 25: Global APAC Electric Vehicle Charging Station Market Revenue Million Forecast, by Vehicle Type 2019 & 2032
- Table 26: Global APAC Electric Vehicle Charging Station Market Revenue Million Forecast, by Charger Type 2019 & 2032
- Table 27: Global APAC Electric Vehicle Charging Station Market Revenue Million Forecast, by Application Ttype 2019 & 2032
- Table 28: Global APAC Electric Vehicle Charging Station Market Revenue Million Forecast, by Country 2019 & 2032
- Table 29: United States APAC Electric Vehicle Charging Station Market Revenue (Million) Forecast, by Application 2019 & 2032
- Table 30: Canada APAC Electric Vehicle Charging Station Market Revenue (Million) Forecast, by Application 2019 & 2032
- Table 31: Mexico APAC Electric Vehicle Charging Station Market Revenue (Million) Forecast, by Application 2019 & 2032
- Table 32: Global APAC Electric Vehicle Charging Station Market Revenue Million Forecast, by Vehicle Type 2019 & 2032
- Table 33: Global APAC Electric Vehicle Charging Station Market Revenue Million Forecast, by Charger Type 2019 & 2032
- Table 34: Global APAC Electric Vehicle Charging Station Market Revenue Million Forecast, by Application Ttype 2019 & 2032
- Table 35: Global APAC Electric Vehicle Charging Station Market Revenue Million Forecast, by Country 2019 & 2032
- Table 36: Brazil APAC Electric Vehicle Charging Station Market Revenue (Million) Forecast, by Application 2019 & 2032
- Table 37: Argentina APAC Electric Vehicle Charging Station Market Revenue (Million) Forecast, by Application 2019 & 2032
- Table 38: Rest of South America APAC Electric Vehicle Charging Station Market Revenue (Million) Forecast, by Application 2019 & 2032
- Table 39: Global APAC Electric Vehicle Charging Station Market Revenue Million Forecast, by Vehicle Type 2019 & 2032
- Table 40: Global APAC Electric Vehicle Charging Station Market Revenue Million Forecast, by Charger Type 2019 & 2032
- Table 41: Global APAC Electric Vehicle Charging Station Market Revenue Million Forecast, by Application Ttype 2019 & 2032
- Table 42: Global APAC Electric Vehicle Charging Station Market Revenue Million Forecast, by Country 2019 & 2032
- Table 43: United Kingdom APAC Electric Vehicle Charging Station Market Revenue (Million) Forecast, by Application 2019 & 2032
- Table 44: Germany APAC Electric Vehicle Charging Station Market Revenue (Million) Forecast, by Application 2019 & 2032
- Table 45: France APAC Electric Vehicle Charging Station Market Revenue (Million) Forecast, by Application 2019 & 2032
- Table 46: Italy APAC Electric Vehicle Charging Station Market Revenue (Million) Forecast, by Application 2019 & 2032
- Table 47: Spain APAC Electric Vehicle Charging Station Market Revenue (Million) Forecast, by Application 2019 & 2032
- Table 48: Russia APAC Electric Vehicle Charging Station Market Revenue (Million) Forecast, by Application 2019 & 2032
- Table 49: Benelux APAC Electric Vehicle Charging Station Market Revenue (Million) Forecast, by Application 2019 & 2032
- Table 50: Nordics APAC Electric Vehicle Charging Station Market Revenue (Million) Forecast, by Application 2019 & 2032
- Table 51: Rest of Europe APAC Electric Vehicle Charging Station Market Revenue (Million) Forecast, by Application 2019 & 2032
- Table 52: Global APAC Electric Vehicle Charging Station Market Revenue Million Forecast, by Vehicle Type 2019 & 2032
- Table 53: Global APAC Electric Vehicle Charging Station Market Revenue Million Forecast, by Charger Type 2019 & 2032
- Table 54: Global APAC Electric Vehicle Charging Station Market Revenue Million Forecast, by Application Ttype 2019 & 2032
- Table 55: Global APAC Electric Vehicle Charging Station Market Revenue Million Forecast, by Country 2019 & 2032
- Table 56: Turkey APAC Electric Vehicle Charging Station Market Revenue (Million) Forecast, by Application 2019 & 2032
- Table 57: Israel APAC Electric Vehicle Charging Station Market Revenue (Million) Forecast, by Application 2019 & 2032
- Table 58: GCC APAC Electric Vehicle Charging Station Market Revenue (Million) Forecast, by Application 2019 & 2032
- Table 59: North Africa APAC Electric Vehicle Charging Station Market Revenue (Million) Forecast, by Application 2019 & 2032
- Table 60: South Africa APAC Electric Vehicle Charging Station Market Revenue (Million) Forecast, by Application 2019 & 2032
- Table 61: Rest of Middle East & Africa APAC Electric Vehicle Charging Station Market Revenue (Million) Forecast, by Application 2019 & 2032
- Table 62: Global APAC Electric Vehicle Charging Station Market Revenue Million Forecast, by Vehicle Type 2019 & 2032
- Table 63: Global APAC Electric Vehicle Charging Station Market Revenue Million Forecast, by Charger Type 2019 & 2032
- Table 64: Global APAC Electric Vehicle Charging Station Market Revenue Million Forecast, by Application Ttype 2019 & 2032
- Table 65: Global APAC Electric Vehicle Charging Station Market Revenue Million Forecast, by Country 2019 & 2032
- Table 66: China APAC Electric Vehicle Charging Station Market Revenue (Million) Forecast, by Application 2019 & 2032
- Table 67: India APAC Electric Vehicle Charging Station Market Revenue (Million) Forecast, by Application 2019 & 2032
- Table 68: Japan APAC Electric Vehicle Charging Station Market Revenue (Million) Forecast, by Application 2019 & 2032
- Table 69: South Korea APAC Electric Vehicle Charging Station Market Revenue (Million) Forecast, by Application 2019 & 2032
- Table 70: ASEAN APAC Electric Vehicle Charging Station Market Revenue (Million) Forecast, by Application 2019 & 2032
- Table 71: Oceania APAC Electric Vehicle Charging Station Market Revenue (Million) Forecast, by Application 2019 & 2032
- Table 72: Rest of Asia Pacific APAC Electric Vehicle Charging Station Market Revenue (Million) Forecast, by Application 2019 & 2032
Frequently Asked Questions
1. What is the projected Compound Annual Growth Rate (CAGR) of the APAC Electric Vehicle Charging Station Market?
The projected CAGR is approximately 15.96%.
2. Which companies are prominent players in the APAC Electric Vehicle Charging Station Market?
Key companies in the market include ABB Ltd, Toyota Connected Corporation, STAR CHARGE, Delta Electronics Inc, SCHNEIDER ELECTRIC SE, Siemens AG, Kinetic Green Energy and Power Solutions Lt, Tesla Inc, Tata Power Company Limited, TecSo ChargeZone Ltd, e-Mobility Power Inc, Charzer Tech Pvt Ltd, Exicom Telesystems Ltd.
3. What are the main segments of the APAC Electric Vehicle Charging Station Market?
The market segments include Vehicle Type, Charger Type, Application Ttype.
4. Can you provide details about the market size?
The market size is estimated to be USD 11.41 Million as of 2022.
5. What are some drivers contributing to market growth?
Rise in Electric Vehicle Sales.
6. What are the notable trends driving market growth?
Rising Electric Passenger Car Sale to Fuel Charging Station Demand.
7. Are there any restraints impacting market growth?
High Initial Cost to Slow Down-Market Growth.
8. Can you provide examples of recent developments in the market?
July 2023: Volkswagen AG unveiled a significant investment of USD 110 million to develop a charging station infrastructure in China. The company forged a strategic partnership with CAMS New Energy Technology (CAMS) to spearhead the charging station project within the country.
9. What pricing options are available for accessing the report?
Pricing options include single-user, multi-user, and enterprise licenses priced at USD 4750, USD 4950, and USD 6800 respectively.
10. Is the market size provided in terms of value or volume?
The market size is provided in terms of value, measured in Million.
11. Are there any specific market keywords associated with the report?
Yes, the market keyword associated with the report is "APAC Electric Vehicle Charging Station Market," which aids in identifying and referencing the specific market segment covered.
12. How do I determine which pricing option suits my needs best?
The pricing options vary based on user requirements and access needs. Individual users may opt for single-user licenses, while businesses requiring broader access may choose multi-user or enterprise licenses for cost-effective access to the report.
13. Are there any additional resources or data provided in the APAC Electric Vehicle Charging Station Market report?
While the report offers comprehensive insights, it's advisable to review the specific contents or supplementary materials provided to ascertain if additional resources or data are available.
14. How can I stay updated on further developments or reports in the APAC Electric Vehicle Charging Station Market?
To stay informed about further developments, trends, and reports in the APAC Electric Vehicle Charging Station Market, consider subscribing to industry newsletters, following relevant companies and organizations, or regularly checking reputable industry news sources and publications.
Methodology
Step 1 - Identification of Relevant Samples Size from Population Database


Step 2 - Approaches for Defining Global Market Size (Value, Volume* & Price*)

Note*: In applicable scenarios
Step 3 - Data Sources
Primary Research
- Web Analytics
- Survey Reports
- Research Institute
- Latest Research Reports
- Opinion Leaders
Secondary Research
- Annual Reports
- White Paper
- Latest Press Release
- Industry Association
- Paid Database
- Investor Presentations

Step 4 - Data Triangulation
Involves using different sources of information in order to increase the validity of a study
These sources are likely to be stakeholders in a program - participants, other researchers, program staff, other community members, and so on.
Then we put all data in single framework & apply various statistical tools to find out the dynamic on the market.
During the analysis stage, feedback from the stakeholder groups would be compared to determine areas of agreement as well as areas of divergence


