
Key Insights
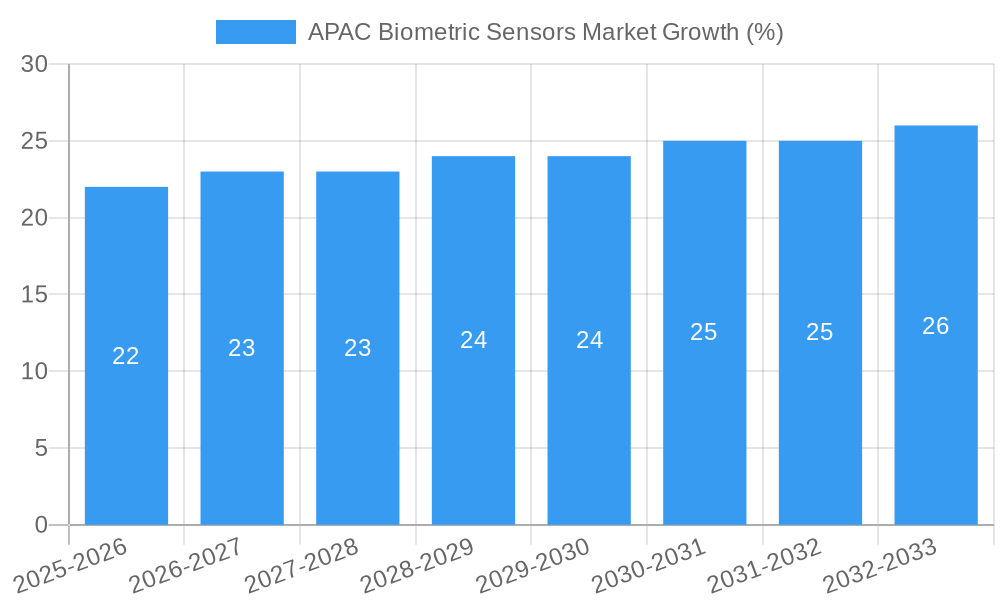
The Asia-Pacific (APAC) biometric sensors market is experiencing robust growth, driven by increasing smartphone adoption, rising security concerns across various sectors, and the expanding Internet of Things (IoT) ecosystem. The region's large and rapidly developing economies, particularly in India and China, contribute significantly to this market expansion. The 1.73% CAGR suggests a steady, albeit moderate, growth trajectory. While this figure might seem conservative compared to other rapidly evolving tech sectors, considerations such as market maturity in certain segments (e.g., fingerprint sensors in smartphones) and the cyclical nature of technological adoption need to be factored in. The market is segmented by application (smartphones/tablets holding a dominant share, followed by laptops, smartcards, and IoT devices), end-user industry (consumer electronics, BFSI, and government sectors showing strong demand), and sensor type (capacitive and optical sensors leading the pack). Competitive pressures are intense, with both established players like Synaptics and Qualcomm and emerging companies from China vying for market share. This competitive landscape fosters innovation and drives down prices, making biometric technology more accessible across various applications.
Future growth will be fueled by advancements in sensor technology, leading to more accurate, reliable, and cost-effective solutions. The integration of biometric authentication into diverse applications, ranging from access control systems in government and military settings to secure financial transactions in the BFSI sector, will further propel market expansion. However, challenges remain, including concerns about data privacy and security, which need to be addressed to ensure widespread adoption. The APAC region's diverse regulatory landscape also presents a challenge for companies operating across multiple countries. Despite these challenges, the long-term outlook for the APAC biometric sensors market remains positive, with continued growth expected throughout the forecast period (2025-2033). Factors like increased government investment in digital infrastructure and the growing focus on contactless technologies will further bolster market growth.
APAC Biometric Sensors Market: A Comprehensive Report (2019-2033)
This comprehensive report provides an in-depth analysis of the Asia-Pacific (APAC) biometric sensors market, offering invaluable insights for stakeholders seeking to understand and capitalize on the region's dynamic growth trajectory. The report covers the period from 2019 to 2033, with a focus on the estimated year 2025 and a forecast period spanning 2025-2033. Key segments analyzed include application (smartphones/tablets, laptops, smartcards, IoT, and other applications), end-user industry (military & defense, consumer electronics, BFSI, government, and others), country (China, Japan, India, South Korea, and Rest of APAC), and sensor type (optical, capacitive, thermal, and ultrasonic).
APAC Biometric Sensors Market Structure & Competitive Dynamics
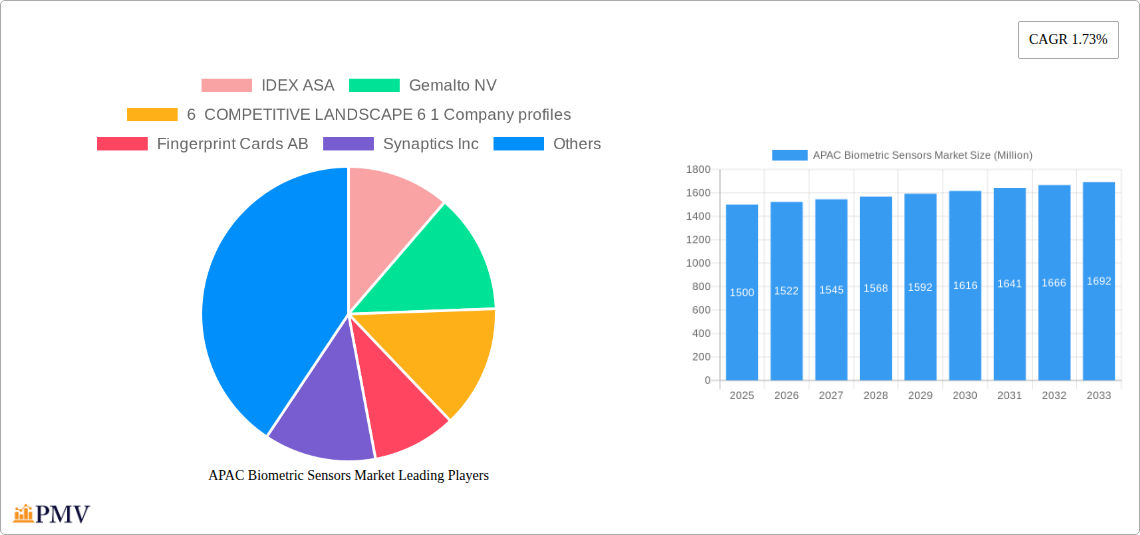
The APAC biometric sensors market exhibits a moderately concentrated structure, with a handful of global players holding significant market share. However, a vibrant ecosystem of smaller, innovative companies is also present, driving competition and technological advancements. The market is influenced by stringent regulatory frameworks concerning data privacy and security, particularly in sectors like BFSI and government. Product substitutes, such as traditional authentication methods, continue to pose a challenge, but their market penetration is gradually declining due to the enhanced security and convenience offered by biometric solutions. End-user trends toward seamless user experiences and enhanced security are fuelling demand for advanced biometric technologies. The market has witnessed several mergers and acquisitions (M&A) in recent years, with deal values exceeding xx Million in the past five years, primarily driven by the consolidation of market share and access to new technologies. Key players like IDEX ASA, Gemalto NV, Fingerprint Cards AB, and Synaptics Inc. are actively shaping market dynamics through strategic partnerships and product launches. Market share analysis reveals that the top 5 players account for approximately xx% of the market in 2025.
APAC Biometric Sensors Market Industry Trends & Insights
The APAC biometric sensors market is experiencing robust growth, driven by a multitude of factors. The increasing adoption of smartphones and other smart devices, coupled with rising consumer awareness of security concerns, is a primary driver. Technological advancements, such as improved sensor accuracy, miniaturization, and lower costs, are further fueling market expansion. The integration of biometric authentication into various applications, from mobile payments to access control systems, is creating new avenues for growth. Consumer preference for convenient and secure authentication methods is also significantly influencing market dynamics. The market is predicted to witness a Compound Annual Growth Rate (CAGR) of xx% during the forecast period (2025-2033). Market penetration is particularly high in China and India, with significant growth potential remaining in other APAC countries. Competitive dynamics are shaped by continuous innovation, strategic partnerships, and the emergence of new players, creating a dynamic and evolving market landscape.
Dominant Markets & Segments in APAC Biometric Sensors Market
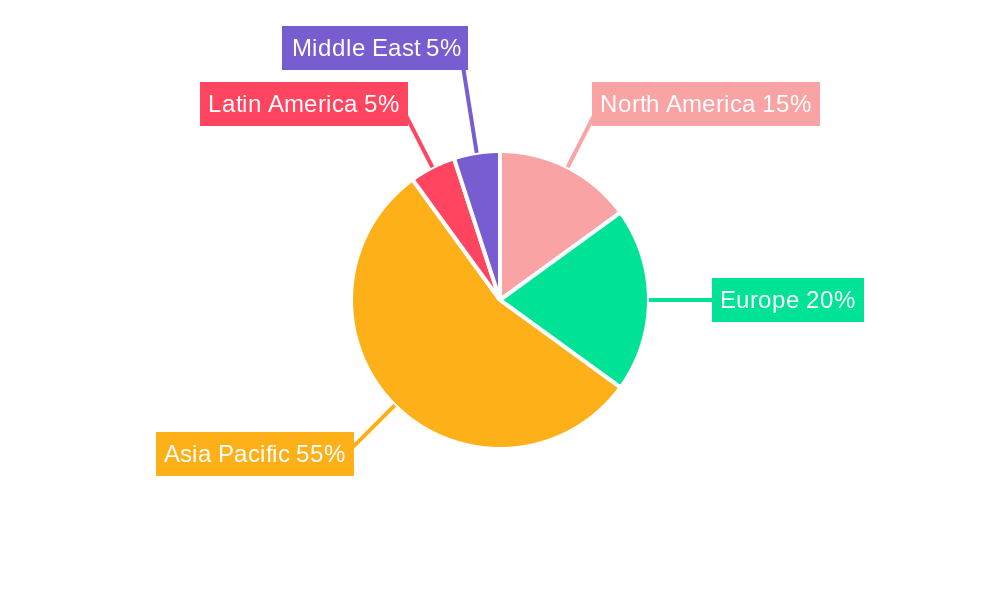
- Leading Region: China dominates the APAC biometric sensors market, driven by its vast consumer base, expanding smartphone market, and increasing government investments in security infrastructure.
- Leading Country: China's dominance extends to the country level, due to its robust manufacturing base, massive consumer electronics market, and proactive government policies supporting technological innovation.
- Leading Application Segment: Smartphones/tablets represent the largest application segment, driven by the widespread adoption of mobile devices and the integration of biometric authentication features into these devices.
- Leading End-user Industry: The consumer electronics sector is the primary driver, followed closely by the BFSI and government sectors, which are increasingly adopting biometric solutions for enhanced security and fraud prevention.
- Leading Sensor Type: Capacitive sensors currently hold the largest market share due to their cost-effectiveness and relatively high accuracy. However, optical sensors are witnessing rapid growth due to their advanced features.
China's dominance stems from several key factors:
- Robust Manufacturing Base: China houses a significant portion of the global manufacturing capacity for electronic components, including biometric sensors.
- Large Consumer Base: A massive consumer base fuels high demand for smartphones and other devices integrated with biometric sensors.
- Government Initiatives: Government policies promoting technological advancement and digitalization further boost market growth.
APAC Biometric Sensors Market Product Innovations
Recent product developments focus on enhancing sensor accuracy, miniaturization, and power efficiency. Innovations in optical and ultrasonic sensor technologies are particularly noteworthy, offering improved performance and enhanced user experiences. Companies are also developing multi-modal biometric systems that combine different sensor types to improve security and reliability. These advancements are driving increased market penetration across various applications and cater to diverse user preferences and security requirements.
Report Segmentation & Scope
The report segments the APAC biometric sensors market based on Application (Smartphones/Tablets, Laptops, Smartcards, IoT and Other Applications), End-user Industry (Military and Defense, Consumer Electronics, BFSI, Government, Other End-user Industries), Country (China, Japan, India, South Korea, Rest of Asia Pacific), and Type (Optical, Capacitive, Thermal, Ultrasonic). Each segment provides detailed growth projections, market size estimations, and a competitive landscape analysis. The market size for smartphones/tablets is projected to reach xx Million by 2033, while the consumer electronics segment is expected to maintain its leading position in terms of revenue contribution.
Key Drivers of APAC Biometric Sensors Market Growth
Technological advancements, particularly in sensor accuracy, miniaturization, and cost reduction, are significant drivers. The rising adoption of smartphones and other smart devices, fueled by increasing disposable incomes and expanding internet penetration, creates substantial demand. Government initiatives promoting digitalization and smart city projects further stimulate market growth. Moreover, the growing emphasis on security and privacy across diverse sectors, including finance and government, propels the adoption of biometric authentication solutions.
Challenges in the APAC Biometric Sensors Market Sector
Data privacy concerns and regulatory hurdles surrounding the handling of biometric data pose significant challenges. Supply chain disruptions and the increasing reliance on specific component suppliers can impact production and market stability. Intense competition among established and emerging players creates pressure on pricing and profit margins. These factors, if not effectively addressed, can impede the market's growth trajectory. For instance, supply chain issues during 2022 resulted in a xx% increase in sensor costs, impacting overall market profitability.
Leading Players in the APAC Biometric Sensors Market Market
- IDEX ASA
- Gemalto NV
- Fingerprint Cards AB
- Synaptics Inc
- Qualcomm Technologies Inc
- NEC Corporation
- TDK Corporation
- CrucialTec Co Ltd
- Shenzhen Goodix Technology Co Ltd
- Vkansee Technology Inc
- Egis Technology Inc
Key Developments in APAC Biometric Sensors Market Sector
- Q1 2023: Synaptics Inc. launched a new generation of in-display fingerprint sensors with enhanced accuracy and speed.
- Q3 2022: A major merger between two key players resulted in the consolidation of market share.
- 2021: Several new regulations regarding data privacy went into effect across several APAC countries.
Strategic APAC Biometric Sensors Market Market Outlook
The APAC biometric sensors market exhibits significant growth potential, driven by continued technological advancements, expanding application areas, and supportive government policies. Strategic opportunities exist for companies to develop innovative products, expand into underserved markets, and forge strategic partnerships to achieve sustainable growth. The focus should be on developing secure and reliable solutions that address evolving data privacy concerns and leverage emerging technologies such as AI and machine learning to enhance sensor performance. The market's future potential is particularly promising in the IoT sector and in emerging economies within the region.
APAC Biometric Sensors Market Segmentation
-
1. Type
- 1.1. Optical
- 1.2. Capacitive
- 1.3. Thermal
- 1.4. Ultrasonic
-
2. Application
- 2.1. Smartphones/Tablets
- 2.2. Laptops
- 2.3. Smartcards
- 2.4. IoT and Other Applications
-
3. End-user Industry
- 3.1. Military and Defense
- 3.2. Consumer Electronics
- 3.3. BFSI
- 3.4. Government
- 3.5. Other End-user Industries
APAC Biometric Sensors Market Segmentation By Geography
-
1. North America
- 1.1. United States
- 1.2. Canada
- 1.3. Mexico
-
2. South America
- 2.1. Brazil
- 2.2. Argentina
- 2.3. Rest of South America
-
3. Europe
- 3.1. United Kingdom
- 3.2. Germany
- 3.3. France
- 3.4. Italy
- 3.5. Spain
- 3.6. Russia
- 3.7. Benelux
- 3.8. Nordics
- 3.9. Rest of Europe
-
4. Middle East & Africa
- 4.1. Turkey
- 4.2. Israel
- 4.3. GCC
- 4.4. North Africa
- 4.5. South Africa
- 4.6. Rest of Middle East & Africa
-
5. Asia Pacific
- 5.1. China
- 5.2. India
- 5.3. Japan
- 5.4. South Korea
- 5.5. ASEAN
- 5.6. Oceania
- 5.7. Rest of Asia Pacific
APAC Biometric Sensors Market REPORT HIGHLIGHTS
| Aspects | Details |
|---|---|
| Study Period | 2019-2033 |
| Base Year | 2024 |
| Estimated Year | 2025 |
| Forecast Period | 2025-2033 |
| Historical Period | 2019-2024 |
| Growth Rate | CAGR of 1.73% from 2019-2033 |
| Segmentation |
|
Table of Contents
- 1. Introduction
- 1.1. Research Scope
- 1.2. Market Segmentation
- 1.3. Research Methodology
- 1.4. Definitions and Assumptions
- 2. Executive Summary
- 2.1. Introduction
- 3. Market Dynamics
- 3.1. Introduction
- 3.2. Market Drivers
- 3.2.1. ; Increasing Usage of Fingerprint Sensors for Smart Wearable Devices and Smartphones
- 3.3. Market Restrains
- 3.3.1 ; Increase in Adoption of Substitute Technologies
- 3.3.2 Such as Face and Iris Scanning
- 3.4. Market Trends
- 3.4.1. Consumer Electronics to Drive the Market Growth
- 4. Market Factor Analysis
- 4.1. Porters Five Forces
- 4.2. Supply/Value Chain
- 4.3. PESTEL analysis
- 4.4. Market Entropy
- 4.5. Patent/Trademark Analysis
- 5. Global APAC Biometric Sensors Market Analysis, Insights and Forecast, 2019-2031
- 5.1. Market Analysis, Insights and Forecast - by Type
- 5.1.1. Optical
- 5.1.2. Capacitive
- 5.1.3. Thermal
- 5.1.4. Ultrasonic
- 5.2. Market Analysis, Insights and Forecast - by Application
- 5.2.1. Smartphones/Tablets
- 5.2.2. Laptops
- 5.2.3. Smartcards
- 5.2.4. IoT and Other Applications
- 5.3. Market Analysis, Insights and Forecast - by End-user Industry
- 5.3.1. Military and Defense
- 5.3.2. Consumer Electronics
- 5.3.3. BFSI
- 5.3.4. Government
- 5.3.5. Other End-user Industries
- 5.4. Market Analysis, Insights and Forecast - by Region
- 5.4.1. North America
- 5.4.2. South America
- 5.4.3. Europe
- 5.4.4. Middle East & Africa
- 5.4.5. Asia Pacific
- 5.1. Market Analysis, Insights and Forecast - by Type
- 6. North America APAC Biometric Sensors Market Analysis, Insights and Forecast, 2019-2031
- 6.1. Market Analysis, Insights and Forecast - by Type
- 6.1.1. Optical
- 6.1.2. Capacitive
- 6.1.3. Thermal
- 6.1.4. Ultrasonic
- 6.2. Market Analysis, Insights and Forecast - by Application
- 6.2.1. Smartphones/Tablets
- 6.2.2. Laptops
- 6.2.3. Smartcards
- 6.2.4. IoT and Other Applications
- 6.3. Market Analysis, Insights and Forecast - by End-user Industry
- 6.3.1. Military and Defense
- 6.3.2. Consumer Electronics
- 6.3.3. BFSI
- 6.3.4. Government
- 6.3.5. Other End-user Industries
- 6.1. Market Analysis, Insights and Forecast - by Type
- 7. South America APAC Biometric Sensors Market Analysis, Insights and Forecast, 2019-2031
- 7.1. Market Analysis, Insights and Forecast - by Type
- 7.1.1. Optical
- 7.1.2. Capacitive
- 7.1.3. Thermal
- 7.1.4. Ultrasonic
- 7.2. Market Analysis, Insights and Forecast - by Application
- 7.2.1. Smartphones/Tablets
- 7.2.2. Laptops
- 7.2.3. Smartcards
- 7.2.4. IoT and Other Applications
- 7.3. Market Analysis, Insights and Forecast - by End-user Industry
- 7.3.1. Military and Defense
- 7.3.2. Consumer Electronics
- 7.3.3. BFSI
- 7.3.4. Government
- 7.3.5. Other End-user Industries
- 7.1. Market Analysis, Insights and Forecast - by Type
- 8. Europe APAC Biometric Sensors Market Analysis, Insights and Forecast, 2019-2031
- 8.1. Market Analysis, Insights and Forecast - by Type
- 8.1.1. Optical
- 8.1.2. Capacitive
- 8.1.3. Thermal
- 8.1.4. Ultrasonic
- 8.2. Market Analysis, Insights and Forecast - by Application
- 8.2.1. Smartphones/Tablets
- 8.2.2. Laptops
- 8.2.3. Smartcards
- 8.2.4. IoT and Other Applications
- 8.3. Market Analysis, Insights and Forecast - by End-user Industry
- 8.3.1. Military and Defense
- 8.3.2. Consumer Electronics
- 8.3.3. BFSI
- 8.3.4. Government
- 8.3.5. Other End-user Industries
- 8.1. Market Analysis, Insights and Forecast - by Type
- 9. Middle East & Africa APAC Biometric Sensors Market Analysis, Insights and Forecast, 2019-2031
- 9.1. Market Analysis, Insights and Forecast - by Type
- 9.1.1. Optical
- 9.1.2. Capacitive
- 9.1.3. Thermal
- 9.1.4. Ultrasonic
- 9.2. Market Analysis, Insights and Forecast - by Application
- 9.2.1. Smartphones/Tablets
- 9.2.2. Laptops
- 9.2.3. Smartcards
- 9.2.4. IoT and Other Applications
- 9.3. Market Analysis, Insights and Forecast - by End-user Industry
- 9.3.1. Military and Defense
- 9.3.2. Consumer Electronics
- 9.3.3. BFSI
- 9.3.4. Government
- 9.3.5. Other End-user Industries
- 9.1. Market Analysis, Insights and Forecast - by Type
- 10. Asia Pacific APAC Biometric Sensors Market Analysis, Insights and Forecast, 2019-2031
- 10.1. Market Analysis, Insights and Forecast - by Type
- 10.1.1. Optical
- 10.1.2. Capacitive
- 10.1.3. Thermal
- 10.1.4. Ultrasonic
- 10.2. Market Analysis, Insights and Forecast - by Application
- 10.2.1. Smartphones/Tablets
- 10.2.2. Laptops
- 10.2.3. Smartcards
- 10.2.4. IoT and Other Applications
- 10.3. Market Analysis, Insights and Forecast - by End-user Industry
- 10.3.1. Military and Defense
- 10.3.2. Consumer Electronics
- 10.3.3. BFSI
- 10.3.4. Government
- 10.3.5. Other End-user Industries
- 10.1. Market Analysis, Insights and Forecast - by Type
- 11. North America APAC Biometric Sensors Market Analysis, Insights and Forecast, 2019-2031
- 11.1. Market Analysis, Insights and Forecast - By Country/Sub-region
- 11.1.1 United States
- 11.1.2 Canada
- 12. Europe APAC Biometric Sensors Market Analysis, Insights and Forecast, 2019-2031
- 12.1. Market Analysis, Insights and Forecast - By Country/Sub-region
- 12.1.1 Germany
- 12.1.2 United Kingdom
- 12.1.3 France
- 12.1.4 Rest of Europe
- 13. Asia Pacific APAC Biometric Sensors Market Analysis, Insights and Forecast, 2019-2031
- 13.1. Market Analysis, Insights and Forecast - By Country/Sub-region
- 13.1.1 India
- 13.1.2 China
- 13.1.3 Japan
- 13.1.4 Rest of Asia Pacific
- 14. Latin America APAC Biometric Sensors Market Analysis, Insights and Forecast, 2019-2031
- 14.1. Market Analysis, Insights and Forecast - By Country/Sub-region
- 14.1.1 Brazil
- 14.1.2 Argentina
- 14.1.3 Rest of Latin America
- 15. Middle East APAC Biometric Sensors Market Analysis, Insights and Forecast, 2019-2031
- 15.1. Market Analysis, Insights and Forecast - By Country/Sub-region
- 15.1.1.
- 16. United Arab Emirates APAC Biometric Sensors Market Analysis, Insights and Forecast, 2019-2031
- 16.1. Market Analysis, Insights and Forecast - By Country/Sub-region
- 16.1.1 Saudi Arabia
- 16.1.2 Rest of Middle East
- 17. Competitive Analysis
- 17.1. Global Market Share Analysis 2024
- 17.2. Company Profiles
- 17.2.1 IDEX ASA
- 17.2.1.1. Overview
- 17.2.1.2. Products
- 17.2.1.3. SWOT Analysis
- 17.2.1.4. Recent Developments
- 17.2.1.5. Financials (Based on Availability)
- 17.2.2 Gemalto NV
- 17.2.2.1. Overview
- 17.2.2.2. Products
- 17.2.2.3. SWOT Analysis
- 17.2.2.4. Recent Developments
- 17.2.2.5. Financials (Based on Availability)
- 17.2.3 6 COMPETITIVE LANDSCAPE 6 1 Company profiles
- 17.2.3.1. Overview
- 17.2.3.2. Products
- 17.2.3.3. SWOT Analysis
- 17.2.3.4. Recent Developments
- 17.2.3.5. Financials (Based on Availability)
- 17.2.4 Fingerprint Cards AB
- 17.2.4.1. Overview
- 17.2.4.2. Products
- 17.2.4.3. SWOT Analysis
- 17.2.4.4. Recent Developments
- 17.2.4.5. Financials (Based on Availability)
- 17.2.5 Synaptics Inc
- 17.2.5.1. Overview
- 17.2.5.2. Products
- 17.2.5.3. SWOT Analysis
- 17.2.5.4. Recent Developments
- 17.2.5.5. Financials (Based on Availability)
- 17.2.6 Qualcomm Technologies Inc
- 17.2.6.1. Overview
- 17.2.6.2. Products
- 17.2.6.3. SWOT Analysis
- 17.2.6.4. Recent Developments
- 17.2.6.5. Financials (Based on Availability)
- 17.2.7 NEC Corporation
- 17.2.7.1. Overview
- 17.2.7.2. Products
- 17.2.7.3. SWOT Analysis
- 17.2.7.4. Recent Developments
- 17.2.7.5. Financials (Based on Availability)
- 17.2.8 TDK Corporation
- 17.2.8.1. Overview
- 17.2.8.2. Products
- 17.2.8.3. SWOT Analysis
- 17.2.8.4. Recent Developments
- 17.2.8.5. Financials (Based on Availability)
- 17.2.9 CrucialTec Co Ltd *List Not Exhaustive
- 17.2.9.1. Overview
- 17.2.9.2. Products
- 17.2.9.3. SWOT Analysis
- 17.2.9.4. Recent Developments
- 17.2.9.5. Financials (Based on Availability)
- 17.2.10 Shenzhen Goodix Technology Co Ltd
- 17.2.10.1. Overview
- 17.2.10.2. Products
- 17.2.10.3. SWOT Analysis
- 17.2.10.4. Recent Developments
- 17.2.10.5. Financials (Based on Availability)
- 17.2.11 Vkansee Technology Inc
- 17.2.11.1. Overview
- 17.2.11.2. Products
- 17.2.11.3. SWOT Analysis
- 17.2.11.4. Recent Developments
- 17.2.11.5. Financials (Based on Availability)
- 17.2.12 Egis Technology Inc
- 17.2.12.1. Overview
- 17.2.12.2. Products
- 17.2.12.3. SWOT Analysis
- 17.2.12.4. Recent Developments
- 17.2.12.5. Financials (Based on Availability)
- 17.2.1 IDEX ASA
List of Figures
- Figure 1: Global APAC Biometric Sensors Market Revenue Breakdown (Million, %) by Region 2024 & 2032
- Figure 2: North America APAC Biometric Sensors Market Revenue (Million), by Country 2024 & 2032
- Figure 3: North America APAC Biometric Sensors Market Revenue Share (%), by Country 2024 & 2032
- Figure 4: Europe APAC Biometric Sensors Market Revenue (Million), by Country 2024 & 2032
- Figure 5: Europe APAC Biometric Sensors Market Revenue Share (%), by Country 2024 & 2032
- Figure 6: Asia Pacific APAC Biometric Sensors Market Revenue (Million), by Country 2024 & 2032
- Figure 7: Asia Pacific APAC Biometric Sensors Market Revenue Share (%), by Country 2024 & 2032
- Figure 8: Latin America APAC Biometric Sensors Market Revenue (Million), by Country 2024 & 2032
- Figure 9: Latin America APAC Biometric Sensors Market Revenue Share (%), by Country 2024 & 2032
- Figure 10: Middle East APAC Biometric Sensors Market Revenue (Million), by Country 2024 & 2032
- Figure 11: Middle East APAC Biometric Sensors Market Revenue Share (%), by Country 2024 & 2032
- Figure 12: United Arab Emirates APAC Biometric Sensors Market Revenue (Million), by Country 2024 & 2032
- Figure 13: United Arab Emirates APAC Biometric Sensors Market Revenue Share (%), by Country 2024 & 2032
- Figure 14: North America APAC Biometric Sensors Market Revenue (Million), by Type 2024 & 2032
- Figure 15: North America APAC Biometric Sensors Market Revenue Share (%), by Type 2024 & 2032
- Figure 16: North America APAC Biometric Sensors Market Revenue (Million), by Application 2024 & 2032
- Figure 17: North America APAC Biometric Sensors Market Revenue Share (%), by Application 2024 & 2032
- Figure 18: North America APAC Biometric Sensors Market Revenue (Million), by End-user Industry 2024 & 2032
- Figure 19: North America APAC Biometric Sensors Market Revenue Share (%), by End-user Industry 2024 & 2032
- Figure 20: North America APAC Biometric Sensors Market Revenue (Million), by Country 2024 & 2032
- Figure 21: North America APAC Biometric Sensors Market Revenue Share (%), by Country 2024 & 2032
- Figure 22: South America APAC Biometric Sensors Market Revenue (Million), by Type 2024 & 2032
- Figure 23: South America APAC Biometric Sensors Market Revenue Share (%), by Type 2024 & 2032
- Figure 24: South America APAC Biometric Sensors Market Revenue (Million), by Application 2024 & 2032
- Figure 25: South America APAC Biometric Sensors Market Revenue Share (%), by Application 2024 & 2032
- Figure 26: South America APAC Biometric Sensors Market Revenue (Million), by End-user Industry 2024 & 2032
- Figure 27: South America APAC Biometric Sensors Market Revenue Share (%), by End-user Industry 2024 & 2032
- Figure 28: South America APAC Biometric Sensors Market Revenue (Million), by Country 2024 & 2032
- Figure 29: South America APAC Biometric Sensors Market Revenue Share (%), by Country 2024 & 2032
- Figure 30: Europe APAC Biometric Sensors Market Revenue (Million), by Type 2024 & 2032
- Figure 31: Europe APAC Biometric Sensors Market Revenue Share (%), by Type 2024 & 2032
- Figure 32: Europe APAC Biometric Sensors Market Revenue (Million), by Application 2024 & 2032
- Figure 33: Europe APAC Biometric Sensors Market Revenue Share (%), by Application 2024 & 2032
- Figure 34: Europe APAC Biometric Sensors Market Revenue (Million), by End-user Industry 2024 & 2032
- Figure 35: Europe APAC Biometric Sensors Market Revenue Share (%), by End-user Industry 2024 & 2032
- Figure 36: Europe APAC Biometric Sensors Market Revenue (Million), by Country 2024 & 2032
- Figure 37: Europe APAC Biometric Sensors Market Revenue Share (%), by Country 2024 & 2032
- Figure 38: Middle East & Africa APAC Biometric Sensors Market Revenue (Million), by Type 2024 & 2032
- Figure 39: Middle East & Africa APAC Biometric Sensors Market Revenue Share (%), by Type 2024 & 2032
- Figure 40: Middle East & Africa APAC Biometric Sensors Market Revenue (Million), by Application 2024 & 2032
- Figure 41: Middle East & Africa APAC Biometric Sensors Market Revenue Share (%), by Application 2024 & 2032
- Figure 42: Middle East & Africa APAC Biometric Sensors Market Revenue (Million), by End-user Industry 2024 & 2032
- Figure 43: Middle East & Africa APAC Biometric Sensors Market Revenue Share (%), by End-user Industry 2024 & 2032
- Figure 44: Middle East & Africa APAC Biometric Sensors Market Revenue (Million), by Country 2024 & 2032
- Figure 45: Middle East & Africa APAC Biometric Sensors Market Revenue Share (%), by Country 2024 & 2032
- Figure 46: Asia Pacific APAC Biometric Sensors Market Revenue (Million), by Type 2024 & 2032
- Figure 47: Asia Pacific APAC Biometric Sensors Market Revenue Share (%), by Type 2024 & 2032
- Figure 48: Asia Pacific APAC Biometric Sensors Market Revenue (Million), by Application 2024 & 2032
- Figure 49: Asia Pacific APAC Biometric Sensors Market Revenue Share (%), by Application 2024 & 2032
- Figure 50: Asia Pacific APAC Biometric Sensors Market Revenue (Million), by End-user Industry 2024 & 2032
- Figure 51: Asia Pacific APAC Biometric Sensors Market Revenue Share (%), by End-user Industry 2024 & 2032
- Figure 52: Asia Pacific APAC Biometric Sensors Market Revenue (Million), by Country 2024 & 2032
- Figure 53: Asia Pacific APAC Biometric Sensors Market Revenue Share (%), by Country 2024 & 2032
List of Tables
- Table 1: Global APAC Biometric Sensors Market Revenue Million Forecast, by Region 2019 & 2032
- Table 2: Global APAC Biometric Sensors Market Revenue Million Forecast, by Type 2019 & 2032
- Table 3: Global APAC Biometric Sensors Market Revenue Million Forecast, by Application 2019 & 2032
- Table 4: Global APAC Biometric Sensors Market Revenue Million Forecast, by End-user Industry 2019 & 2032
- Table 5: Global APAC Biometric Sensors Market Revenue Million Forecast, by Region 2019 & 2032
- Table 6: Global APAC Biometric Sensors Market Revenue Million Forecast, by Country 2019 & 2032
- Table 7: United States APAC Biometric Sensors Market Revenue (Million) Forecast, by Application 2019 & 2032
- Table 8: Canada APAC Biometric Sensors Market Revenue (Million) Forecast, by Application 2019 & 2032
- Table 9: Global APAC Biometric Sensors Market Revenue Million Forecast, by Country 2019 & 2032
- Table 10: Germany APAC Biometric Sensors Market Revenue (Million) Forecast, by Application 2019 & 2032
- Table 11: United Kingdom APAC Biometric Sensors Market Revenue (Million) Forecast, by Application 2019 & 2032
- Table 12: France APAC Biometric Sensors Market Revenue (Million) Forecast, by Application 2019 & 2032
- Table 13: Rest of Europe APAC Biometric Sensors Market Revenue (Million) Forecast, by Application 2019 & 2032
- Table 14: Global APAC Biometric Sensors Market Revenue Million Forecast, by Country 2019 & 2032
- Table 15: India APAC Biometric Sensors Market Revenue (Million) Forecast, by Application 2019 & 2032
- Table 16: China APAC Biometric Sensors Market Revenue (Million) Forecast, by Application 2019 & 2032
- Table 17: Japan APAC Biometric Sensors Market Revenue (Million) Forecast, by Application 2019 & 2032
- Table 18: Rest of Asia Pacific APAC Biometric Sensors Market Revenue (Million) Forecast, by Application 2019 & 2032
- Table 19: Global APAC Biometric Sensors Market Revenue Million Forecast, by Country 2019 & 2032
- Table 20: Brazil APAC Biometric Sensors Market Revenue (Million) Forecast, by Application 2019 & 2032
- Table 21: Argentina APAC Biometric Sensors Market Revenue (Million) Forecast, by Application 2019 & 2032
- Table 22: Rest of Latin America APAC Biometric Sensors Market Revenue (Million) Forecast, by Application 2019 & 2032
- Table 23: Global APAC Biometric Sensors Market Revenue Million Forecast, by Country 2019 & 2032
- Table 24: APAC Biometric Sensors Market Revenue (Million) Forecast, by Application 2019 & 2032
- Table 25: Global APAC Biometric Sensors Market Revenue Million Forecast, by Country 2019 & 2032
- Table 26: Saudi Arabia APAC Biometric Sensors Market Revenue (Million) Forecast, by Application 2019 & 2032
- Table 27: Rest of Middle East APAC Biometric Sensors Market Revenue (Million) Forecast, by Application 2019 & 2032
- Table 28: Global APAC Biometric Sensors Market Revenue Million Forecast, by Type 2019 & 2032
- Table 29: Global APAC Biometric Sensors Market Revenue Million Forecast, by Application 2019 & 2032
- Table 30: Global APAC Biometric Sensors Market Revenue Million Forecast, by End-user Industry 2019 & 2032
- Table 31: Global APAC Biometric Sensors Market Revenue Million Forecast, by Country 2019 & 2032
- Table 32: United States APAC Biometric Sensors Market Revenue (Million) Forecast, by Application 2019 & 2032
- Table 33: Canada APAC Biometric Sensors Market Revenue (Million) Forecast, by Application 2019 & 2032
- Table 34: Mexico APAC Biometric Sensors Market Revenue (Million) Forecast, by Application 2019 & 2032
- Table 35: Global APAC Biometric Sensors Market Revenue Million Forecast, by Type 2019 & 2032
- Table 36: Global APAC Biometric Sensors Market Revenue Million Forecast, by Application 2019 & 2032
- Table 37: Global APAC Biometric Sensors Market Revenue Million Forecast, by End-user Industry 2019 & 2032
- Table 38: Global APAC Biometric Sensors Market Revenue Million Forecast, by Country 2019 & 2032
- Table 39: Brazil APAC Biometric Sensors Market Revenue (Million) Forecast, by Application 2019 & 2032
- Table 40: Argentina APAC Biometric Sensors Market Revenue (Million) Forecast, by Application 2019 & 2032
- Table 41: Rest of South America APAC Biometric Sensors Market Revenue (Million) Forecast, by Application 2019 & 2032
- Table 42: Global APAC Biometric Sensors Market Revenue Million Forecast, by Type 2019 & 2032
- Table 43: Global APAC Biometric Sensors Market Revenue Million Forecast, by Application 2019 & 2032
- Table 44: Global APAC Biometric Sensors Market Revenue Million Forecast, by End-user Industry 2019 & 2032
- Table 45: Global APAC Biometric Sensors Market Revenue Million Forecast, by Country 2019 & 2032
- Table 46: United Kingdom APAC Biometric Sensors Market Revenue (Million) Forecast, by Application 2019 & 2032
- Table 47: Germany APAC Biometric Sensors Market Revenue (Million) Forecast, by Application 2019 & 2032
- Table 48: France APAC Biometric Sensors Market Revenue (Million) Forecast, by Application 2019 & 2032
- Table 49: Italy APAC Biometric Sensors Market Revenue (Million) Forecast, by Application 2019 & 2032
- Table 50: Spain APAC Biometric Sensors Market Revenue (Million) Forecast, by Application 2019 & 2032
- Table 51: Russia APAC Biometric Sensors Market Revenue (Million) Forecast, by Application 2019 & 2032
- Table 52: Benelux APAC Biometric Sensors Market Revenue (Million) Forecast, by Application 2019 & 2032
- Table 53: Nordics APAC Biometric Sensors Market Revenue (Million) Forecast, by Application 2019 & 2032
- Table 54: Rest of Europe APAC Biometric Sensors Market Revenue (Million) Forecast, by Application 2019 & 2032
- Table 55: Global APAC Biometric Sensors Market Revenue Million Forecast, by Type 2019 & 2032
- Table 56: Global APAC Biometric Sensors Market Revenue Million Forecast, by Application 2019 & 2032
- Table 57: Global APAC Biometric Sensors Market Revenue Million Forecast, by End-user Industry 2019 & 2032
- Table 58: Global APAC Biometric Sensors Market Revenue Million Forecast, by Country 2019 & 2032
- Table 59: Turkey APAC Biometric Sensors Market Revenue (Million) Forecast, by Application 2019 & 2032
- Table 60: Israel APAC Biometric Sensors Market Revenue (Million) Forecast, by Application 2019 & 2032
- Table 61: GCC APAC Biometric Sensors Market Revenue (Million) Forecast, by Application 2019 & 2032
- Table 62: North Africa APAC Biometric Sensors Market Revenue (Million) Forecast, by Application 2019 & 2032
- Table 63: South Africa APAC Biometric Sensors Market Revenue (Million) Forecast, by Application 2019 & 2032
- Table 64: Rest of Middle East & Africa APAC Biometric Sensors Market Revenue (Million) Forecast, by Application 2019 & 2032
- Table 65: Global APAC Biometric Sensors Market Revenue Million Forecast, by Type 2019 & 2032
- Table 66: Global APAC Biometric Sensors Market Revenue Million Forecast, by Application 2019 & 2032
- Table 67: Global APAC Biometric Sensors Market Revenue Million Forecast, by End-user Industry 2019 & 2032
- Table 68: Global APAC Biometric Sensors Market Revenue Million Forecast, by Country 2019 & 2032
- Table 69: China APAC Biometric Sensors Market Revenue (Million) Forecast, by Application 2019 & 2032
- Table 70: India APAC Biometric Sensors Market Revenue (Million) Forecast, by Application 2019 & 2032
- Table 71: Japan APAC Biometric Sensors Market Revenue (Million) Forecast, by Application 2019 & 2032
- Table 72: South Korea APAC Biometric Sensors Market Revenue (Million) Forecast, by Application 2019 & 2032
- Table 73: ASEAN APAC Biometric Sensors Market Revenue (Million) Forecast, by Application 2019 & 2032
- Table 74: Oceania APAC Biometric Sensors Market Revenue (Million) Forecast, by Application 2019 & 2032
- Table 75: Rest of Asia Pacific APAC Biometric Sensors Market Revenue (Million) Forecast, by Application 2019 & 2032
Frequently Asked Questions
1. What is the projected Compound Annual Growth Rate (CAGR) of the APAC Biometric Sensors Market?
The projected CAGR is approximately 1.73%.
2. Which companies are prominent players in the APAC Biometric Sensors Market?
Key companies in the market include IDEX ASA, Gemalto NV, 6 COMPETITIVE LANDSCAPE 6 1 Company profiles, Fingerprint Cards AB, Synaptics Inc, Qualcomm Technologies Inc, NEC Corporation, TDK Corporation, CrucialTec Co Ltd *List Not Exhaustive, Shenzhen Goodix Technology Co Ltd, Vkansee Technology Inc, Egis Technology Inc.
3. What are the main segments of the APAC Biometric Sensors Market?
The market segments include Type, Application, End-user Industry.
4. Can you provide details about the market size?
The market size is estimated to be USD XX Million as of 2022.
5. What are some drivers contributing to market growth?
; Increasing Usage of Fingerprint Sensors for Smart Wearable Devices and Smartphones.
6. What are the notable trends driving market growth?
Consumer Electronics to Drive the Market Growth.
7. Are there any restraints impacting market growth?
; Increase in Adoption of Substitute Technologies. Such as Face and Iris Scanning.
8. Can you provide examples of recent developments in the market?
N/A
9. What pricing options are available for accessing the report?
Pricing options include single-user, multi-user, and enterprise licenses priced at USD 3800, USD 4500, and USD 5800 respectively.
10. Is the market size provided in terms of value or volume?
The market size is provided in terms of value, measured in Million.
11. Are there any specific market keywords associated with the report?
Yes, the market keyword associated with the report is "APAC Biometric Sensors Market," which aids in identifying and referencing the specific market segment covered.
12. How do I determine which pricing option suits my needs best?
The pricing options vary based on user requirements and access needs. Individual users may opt for single-user licenses, while businesses requiring broader access may choose multi-user or enterprise licenses for cost-effective access to the report.
13. Are there any additional resources or data provided in the APAC Biometric Sensors Market report?
While the report offers comprehensive insights, it's advisable to review the specific contents or supplementary materials provided to ascertain if additional resources or data are available.
14. How can I stay updated on further developments or reports in the APAC Biometric Sensors Market?
To stay informed about further developments, trends, and reports in the APAC Biometric Sensors Market, consider subscribing to industry newsletters, following relevant companies and organizations, or regularly checking reputable industry news sources and publications.
Methodology
Step 1 - Identification of Relevant Samples Size from Population Database


Step 2 - Approaches for Defining Global Market Size (Value, Volume* & Price*)

Note*: In applicable scenarios
Step 3 - Data Sources
Primary Research
- Web Analytics
- Survey Reports
- Research Institute
- Latest Research Reports
- Opinion Leaders
Secondary Research
- Annual Reports
- White Paper
- Latest Press Release
- Industry Association
- Paid Database
- Investor Presentations

Step 4 - Data Triangulation
Involves using different sources of information in order to increase the validity of a study
These sources are likely to be stakeholders in a program - participants, other researchers, program staff, other community members, and so on.
Then we put all data in single framework & apply various statistical tools to find out the dynamic on the market.
During the analysis stage, feedback from the stakeholder groups would be compared to determine areas of agreement as well as areas of divergence


