

Key Insights
The global Anti-Counterfeiting Service market is poised for significant expansion, with an estimated market size of USD 201.99 billion in 2025. This robust growth is underpinned by a compelling Compound Annual Growth Rate (CAGR) of 12.77% projected over the forecast period of 2025-2033. The escalating sophistication and prevalence of counterfeit products across diverse sectors, ranging from pharmaceuticals and luxury goods to electronics and industrial components, are the primary catalysts for this market surge. Businesses are increasingly recognizing the substantial financial losses, reputational damage, and potential consumer harm associated with counterfeiting, driving proactive adoption of anti-counterfeiting solutions. The market is witnessing a pronounced trend towards the integration of advanced technologies such as blockchain, AI-powered track-and-trace systems, serialization, and advanced authentication methods to provide robust protection against illicit trade. The growing demand for verified product integrity and consumer trust further fuels the need for comprehensive anti-counterfeiting strategies.
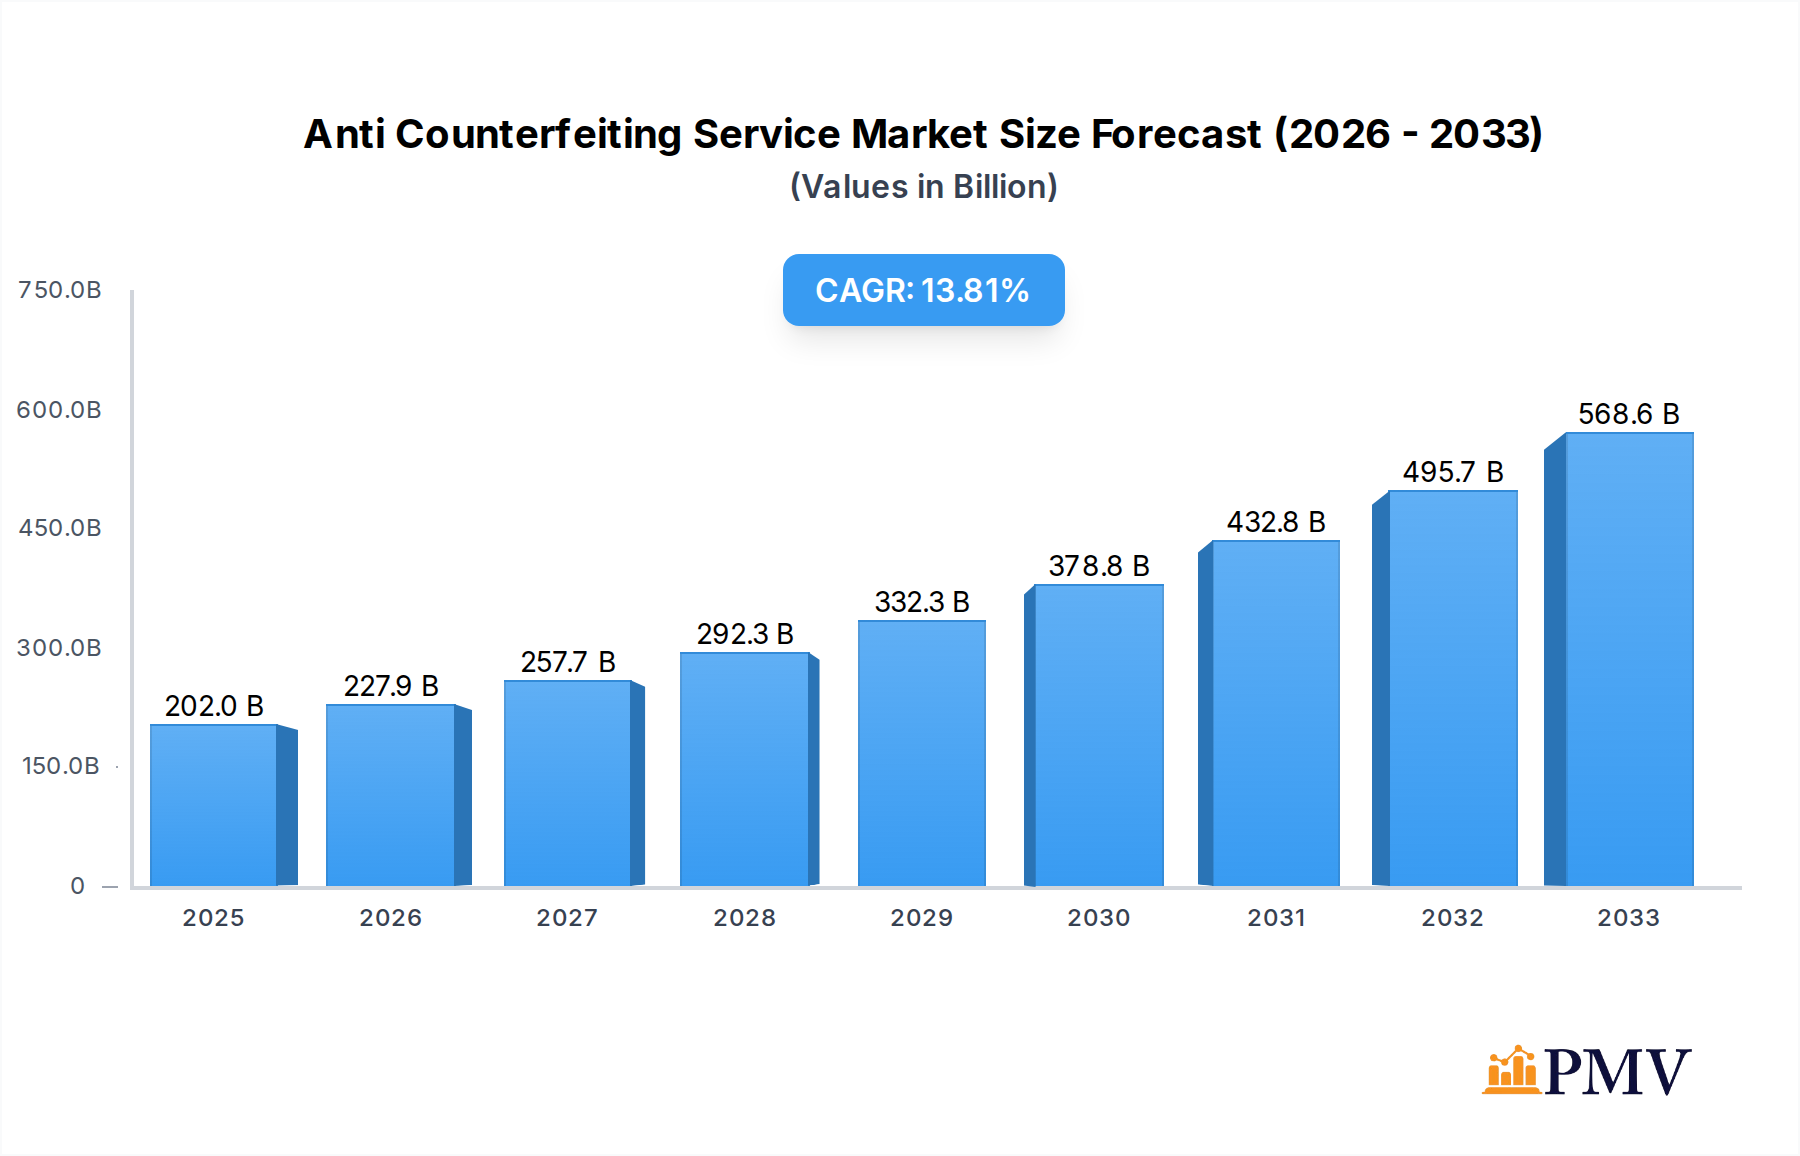
Anti Counterfeiting Service Market Size (In Billion)
The market's trajectory is also influenced by evolving regulatory landscapes that mandate stronger product authentication and recall capabilities, particularly in critical industries like healthcare and food & beverages. The expanding e-commerce ecosystem, while offering unprecedented market access, simultaneously presents a fertile ground for counterfeiters, thereby accentuating the need for effective online monitoring and enforcement services. While the market benefits from strong demand, potential restraints include the high implementation costs of advanced technologies and the continuous need for innovation to stay ahead of evolving counterfeiting techniques. Despite these challenges, the strategic investments by key industry players, coupled with increasing global awareness and a concerted effort to safeguard intellectual property and consumer well-being, are collectively shaping a dynamic and growth-oriented future for the anti-counterfeiting service market.

Anti Counterfeiting Service Company Market Share
Anti Counterfeiting Service Market Research Report: Unveiling Brand Protection Strategies
This comprehensive report provides an in-depth analysis of the global Anti Counterfeiting Service market, offering actionable insights and strategic recommendations for stakeholders. Covering the period from 2019 to 2033, with a base year of 2025 and an estimated year of 2025, this study delves into market structure, competitive dynamics, industry trends, dominant segments, product innovations, and future outlook. With a projected market size in the billions, this report is an essential resource for understanding the evolving landscape of brand protection and combating the ever-growing threat of counterfeiting across diverse industries.
Anti Counterfeiting Service Market Structure & Competitive Dynamics
The Anti Counterfeiting Service market exhibits a moderate to high level of concentration, driven by the increasing need for sophisticated brand protection solutions. Leading players are investing heavily in technological advancements, particularly in online monitoring and legal services, to stay ahead of counterfeiters. The innovation ecosystem thrives on partnerships between technology providers, legal firms, and specialized anti-counterfeiting agencies. Regulatory frameworks are progressively strengthening globally, compelling businesses to adopt robust anti-counterfeiting measures. Product substitutes, while present in the form of in-house solutions, often lack the specialized expertise and reach of dedicated service providers. End-user trends highlight a growing demand for integrated solutions that encompass proactive monitoring, swift investigation, and effective enforcement. Mergers and acquisitions (M&A) are playing a significant role in market consolidation, with recent deals valued in the billions, aimed at expanding service portfolios and geographical reach. Companies like Dickinson Wright, Onsist, and Klemchuk are key participants in this dynamic environment.
Anti Counterfeiting Service Industry Trends & Insights
The global Anti Counterfeiting Service market is poised for significant expansion, driven by a confluence of escalating economic losses from counterfeit goods and heightened consumer awareness. The pharmaceutical and healthcare and consumer electronics sectors are particularly vulnerable, experiencing substantial market penetration of fake products, thereby fueling the demand for advanced anti-counterfeiting solutions. Technological disruptions, including the widespread adoption of AI-powered online monitoring tools, blockchain for supply chain integrity, and advanced track-and-trace technologies, are revolutionizing the industry. These innovations enable real-time identification and mitigation of counterfeit threats, drastically improving the efficiency of investigations. Consumer preferences are shifting towards greater assurance of product authenticity, pushing brands to invest more in visible security features and transparent supply chains. The compound annual growth rate (CAGR) for the Anti Counterfeiting Service market is projected to be substantial, estimated in the billions of dollars annually over the forecast period. Companies are increasingly recognizing that robust anti-counterfeiting strategies are not just a cost but a critical investment in brand reputation and customer trust. The growing prevalence of e-commerce platforms has amplified the challenge, making online monitoring a cornerstone of any effective anti-counterfeiting strategy. The market penetration of specialized services is expected to reach billions by 2033.
Dominant Markets & Segments in Anti Counterfeiting Service
The Pharmaceutical & Healthcare segment is a dominant force within the Anti Counterfeiting Service market, driven by stringent regulatory requirements and the life-threatening consequences of counterfeit drugs. The sheer volume of medical products and the critical need for patient safety make this sector a prime target for counterfeiters, necessitating extensive legal service and investigations. In terms of geography, North America and Europe currently lead the market, owing to well-established regulatory frameworks and a high concentration of industries heavily impacted by counterfeiting. However, Asia-Pacific is emerging as a rapidly growing region, fueled by increasing industrialization, a burgeoning e-commerce landscape, and a rising number of counterfeit incidents.
Key Drivers in Pharmaceutical & Healthcare:
- Strict government regulations and enforcement (e.g., FDA, EMA guidelines).
- High profit margins for counterfeiters, leading to increased targeting.
- Growing consumer and healthcare provider awareness of the dangers of fake medicines.
- Advancements in serialization and track-and-trace technologies.
Dominance Analysis in Consumer Electronics: The Consumer Electronics segment also holds significant market share due to the high volume of products, rapid product lifecycles, and globalized supply chains, making them susceptible to counterfeiting. The ease with which fake electronic components can be manufactured and sold online presents a constant challenge. The need for online monitoring is paramount in this segment to detect fraudulent listings and unauthorized sales.
Emerging Trends in Clothing & Apparel: While traditionally a large market for counterfeits, the Clothing & Apparel sector is seeing increased adoption of technologies like NFC tags and QR codes for authentication. The growth in this segment is directly tied to the expansion of online retail and the demand for luxury goods, which are frequently targeted by counterfeit operations.
Anti Counterfeiting Service Product Innovations
Recent product innovations in the anti-counterfeiting space are centered on leveraging advanced technologies to provide more proactive and intelligent brand protection. Developments include AI-driven online monitoring platforms capable of identifying sophisticated counterfeits across multiple e-commerce channels and social media, and blockchain-based solutions for immutable supply chain tracking. Holographic security features, invisible inks, and tamper-evident packaging are also gaining traction, offering enhanced physical authentication. These innovations provide significant competitive advantages by offering faster detection, more accurate identification, and stronger deterrence against counterfeiters, ensuring market fit in a rapidly evolving threat landscape.
Report Segmentation & Scope
This report segments the Anti Counterfeiting Service market across key applications and service types. The Application segments include Food & Beverages, Pharmaceutical & Healthcare, Industrial & Automotive, Consumer Electronics, Cosmetics & Personal Care, Clothing & Apparel, and Others. The Type segments encompass Online Monitoring, Investigations, Legal Service, and Others. Each segment is analyzed for its specific market size, growth projections in the billions, and the competitive dynamics influencing its evolution. The forecast period of 2025–2033 will witness significant growth across all these segments, with Pharmaceutical & Healthcare and Consumer Electronics expected to lead in terms of absolute market value.
Key Drivers of Anti Counterfeiting Service Growth
Several key drivers are fueling the growth of the Anti Counterfeiting Service market. Technologically, the increasing sophistication of AI and machine learning algorithms for online monitoring and pattern recognition is a major catalyst. Economically, the substantial financial losses incurred by businesses due to counterfeiting, estimated to be in the billions, are compelling greater investment in protective measures. Regulatory factors, such as stricter enforcement of intellectual property laws and increased government initiatives to combat illicit trade, also play a crucial role. For instance, the global push for supply chain transparency in sectors like Pharmaceutical & Healthcare directly boosts demand for serialization and anti-counterfeiting services.
Challenges in the Anti Counterfeiting Service Sector
Despite robust growth, the Anti Counterfeiting Service sector faces several challenges. Regulatory hurdles can still exist in certain jurisdictions, making cross-border enforcement difficult. Supply chain complexities and the global nature of illicit trade make comprehensive monitoring and investigation challenging, especially for smaller businesses. Fierce competitive pressures among service providers can lead to price wars, impacting profitability. Quantifiable impacts include billions in lost revenue for brands and a persistent risk to consumer safety, underscoring the ongoing need for effective anti-counterfeiting solutions.
Leading Players in the Anti Counterfeiting Service Market
- Dickinson Wright
- Onsist
- Klemchuk
- Olnica
- Corporation Service Company
- Fieldfisher
- Sterne Kessler
- Corteva
- Selinko
- Dennemeyer
- Ethosrisk
- Greenberg
Key Developments in Anti Counterfeiting Service Sector
- 2023: Increased adoption of AI-powered online monitoring solutions for real-time detection of counterfeit listings.
- 2023: Major legal service firms launching dedicated divisions for intellectual property protection against online counterfeiting.
- 2024: Companies like Selinko and Dennemeyer expanding their blockchain-based track-and-trace offerings to enhance supply chain integrity.
- 2024: Growing emphasis on proactive investigations and forensic analysis to dismantle counterfeit networks.
- 2025: Emerging partnerships between technology providers and brands in the Food & Beverages sector to combat sophisticated food fraud.
Strategic Anti Counterfeiting Service Market Outlook
The strategic outlook for the Anti Counterfeiting Service market remains highly positive, driven by persistent and evolving threats from counterfeiters. Future growth accelerators will include the continued integration of advanced technologies like AI, IoT, and blockchain across all service types. The increasing demand for end-to-end solutions that combine online monitoring, robust investigations, and comprehensive legal service will create significant market opportunities. As global trade continues to expand, so will the avenues for counterfeiting, necessitating continuous innovation and strategic investments in brand protection for companies of all sizes, aiming to secure billions in brand value and consumer trust.
Anti Counterfeiting Service Segmentation
-
1. Application
- 1.1. Food & Beverages
- 1.2. Pharmaceutical & Healthcare
- 1.3. Industrial & Automotive
- 1.4. Consumer Electronics
- 1.5. Cosmetics & Personal Care
- 1.6. Clothing & Apparel
- 1.7. Others
-
2. Type
- 2.1. Online Monitoring
- 2.2. Investigations
- 2.3. Legal Service
- 2.4. Others
Anti Counterfeiting Service Segmentation By Geography
-
1. North America
- 1.1. United States
- 1.2. Canada
- 1.3. Mexico
-
2. South America
- 2.1. Brazil
- 2.2. Argentina
- 2.3. Rest of South America
-
3. Europe
- 3.1. United Kingdom
- 3.2. Germany
- 3.3. France
- 3.4. Italy
- 3.5. Spain
- 3.6. Russia
- 3.7. Benelux
- 3.8. Nordics
- 3.9. Rest of Europe
-
4. Middle East & Africa
- 4.1. Turkey
- 4.2. Israel
- 4.3. GCC
- 4.4. North Africa
- 4.5. South Africa
- 4.6. Rest of Middle East & Africa
-
5. Asia Pacific
- 5.1. China
- 5.2. India
- 5.3. Japan
- 5.4. South Korea
- 5.5. ASEAN
- 5.6. Oceania
- 5.7. Rest of Asia Pacific
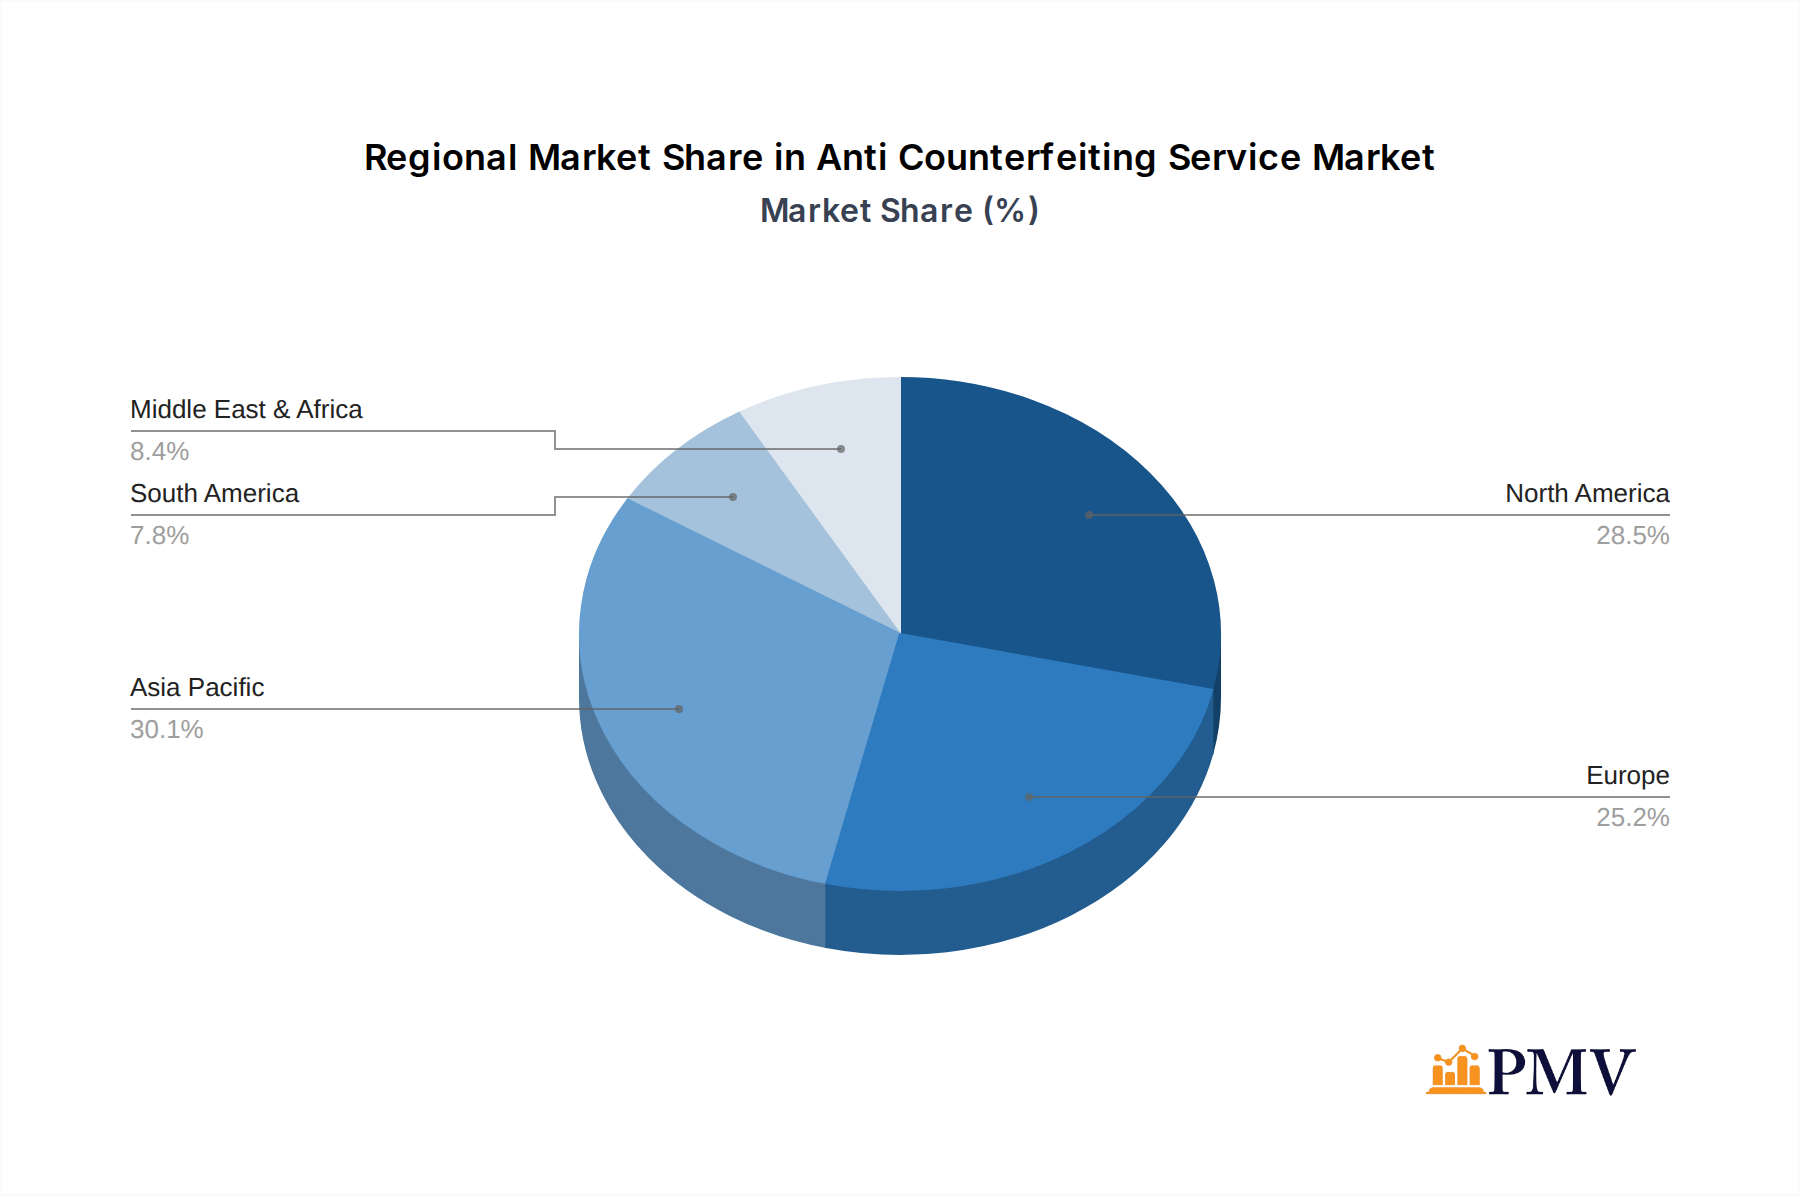
Anti Counterfeiting Service Regional Market Share
Geographic Coverage of Anti Counterfeiting Service
Anti Counterfeiting Service REPORT HIGHLIGHTS
| Aspects | Details |
|---|---|
| Study Period | 2020-2034 |
| Base Year | 2025 |
| Estimated Year | 2026 |
| Forecast Period | 2026-2034 |
| Historical Period | 2020-2025 |
| Growth Rate | CAGR of 12.77% from 2020-2034 |
| Segmentation |
|
Table of Contents
- 1. Introduction
- 1.1. Research Scope
- 1.2. Market Segmentation
- 1.3. Research Methodology
- 1.4. Definitions and Assumptions
- 2. Executive Summary
- 2.1. Introduction
- 3. Market Dynamics
- 3.1. Introduction
- 3.2. Market Drivers
- 3.3. Market Restrains
- 3.4. Market Trends
- 4. Market Factor Analysis
- 4.1. Porters Five Forces
- 4.2. Supply/Value Chain
- 4.3. PESTEL analysis
- 4.4. Market Entropy
- 4.5. Patent/Trademark Analysis
- 5. Global Anti Counterfeiting Service Analysis, Insights and Forecast, 2020-2032
- 5.1. Market Analysis, Insights and Forecast - by Application
- 5.1.1. Food & Beverages
- 5.1.2. Pharmaceutical & Healthcare
- 5.1.3. Industrial & Automotive
- 5.1.4. Consumer Electronics
- 5.1.5. Cosmetics & Personal Care
- 5.1.6. Clothing & Apparel
- 5.1.7. Others
- 5.2. Market Analysis, Insights and Forecast - by Type
- 5.2.1. Online Monitoring
- 5.2.2. Investigations
- 5.2.3. Legal Service
- 5.2.4. Others
- 5.3. Market Analysis, Insights and Forecast - by Region
- 5.3.1. North America
- 5.3.2. South America
- 5.3.3. Europe
- 5.3.4. Middle East & Africa
- 5.3.5. Asia Pacific
- 5.1. Market Analysis, Insights and Forecast - by Application
- 6. North America Anti Counterfeiting Service Analysis, Insights and Forecast, 2020-2032
- 6.1. Market Analysis, Insights and Forecast - by Application
- 6.1.1. Food & Beverages
- 6.1.2. Pharmaceutical & Healthcare
- 6.1.3. Industrial & Automotive
- 6.1.4. Consumer Electronics
- 6.1.5. Cosmetics & Personal Care
- 6.1.6. Clothing & Apparel
- 6.1.7. Others
- 6.2. Market Analysis, Insights and Forecast - by Type
- 6.2.1. Online Monitoring
- 6.2.2. Investigations
- 6.2.3. Legal Service
- 6.2.4. Others
- 6.1. Market Analysis, Insights and Forecast - by Application
- 7. South America Anti Counterfeiting Service Analysis, Insights and Forecast, 2020-2032
- 7.1. Market Analysis, Insights and Forecast - by Application
- 7.1.1. Food & Beverages
- 7.1.2. Pharmaceutical & Healthcare
- 7.1.3. Industrial & Automotive
- 7.1.4. Consumer Electronics
- 7.1.5. Cosmetics & Personal Care
- 7.1.6. Clothing & Apparel
- 7.1.7. Others
- 7.2. Market Analysis, Insights and Forecast - by Type
- 7.2.1. Online Monitoring
- 7.2.2. Investigations
- 7.2.3. Legal Service
- 7.2.4. Others
- 7.1. Market Analysis, Insights and Forecast - by Application
- 8. Europe Anti Counterfeiting Service Analysis, Insights and Forecast, 2020-2032
- 8.1. Market Analysis, Insights and Forecast - by Application
- 8.1.1. Food & Beverages
- 8.1.2. Pharmaceutical & Healthcare
- 8.1.3. Industrial & Automotive
- 8.1.4. Consumer Electronics
- 8.1.5. Cosmetics & Personal Care
- 8.1.6. Clothing & Apparel
- 8.1.7. Others
- 8.2. Market Analysis, Insights and Forecast - by Type
- 8.2.1. Online Monitoring
- 8.2.2. Investigations
- 8.2.3. Legal Service
- 8.2.4. Others
- 8.1. Market Analysis, Insights and Forecast - by Application
- 9. Middle East & Africa Anti Counterfeiting Service Analysis, Insights and Forecast, 2020-2032
- 9.1. Market Analysis, Insights and Forecast - by Application
- 9.1.1. Food & Beverages
- 9.1.2. Pharmaceutical & Healthcare
- 9.1.3. Industrial & Automotive
- 9.1.4. Consumer Electronics
- 9.1.5. Cosmetics & Personal Care
- 9.1.6. Clothing & Apparel
- 9.1.7. Others
- 9.2. Market Analysis, Insights and Forecast - by Type
- 9.2.1. Online Monitoring
- 9.2.2. Investigations
- 9.2.3. Legal Service
- 9.2.4. Others
- 9.1. Market Analysis, Insights and Forecast - by Application
- 10. Asia Pacific Anti Counterfeiting Service Analysis, Insights and Forecast, 2020-2032
- 10.1. Market Analysis, Insights and Forecast - by Application
- 10.1.1. Food & Beverages
- 10.1.2. Pharmaceutical & Healthcare
- 10.1.3. Industrial & Automotive
- 10.1.4. Consumer Electronics
- 10.1.5. Cosmetics & Personal Care
- 10.1.6. Clothing & Apparel
- 10.1.7. Others
- 10.2. Market Analysis, Insights and Forecast - by Type
- 10.2.1. Online Monitoring
- 10.2.2. Investigations
- 10.2.3. Legal Service
- 10.2.4. Others
- 10.1. Market Analysis, Insights and Forecast - by Application
- 11. Competitive Analysis
- 11.1. Global Market Share Analysis 2025
- 11.2. Company Profiles
- 11.2.1 Dickinson Wright
- 11.2.1.1. Overview
- 11.2.1.2. Products
- 11.2.1.3. SWOT Analysis
- 11.2.1.4. Recent Developments
- 11.2.1.5. Financials (Based on Availability)
- 11.2.2 Onsist
- 11.2.2.1. Overview
- 11.2.2.2. Products
- 11.2.2.3. SWOT Analysis
- 11.2.2.4. Recent Developments
- 11.2.2.5. Financials (Based on Availability)
- 11.2.3 Klemchuk
- 11.2.3.1. Overview
- 11.2.3.2. Products
- 11.2.3.3. SWOT Analysis
- 11.2.3.4. Recent Developments
- 11.2.3.5. Financials (Based on Availability)
- 11.2.4 Olnica
- 11.2.4.1. Overview
- 11.2.4.2. Products
- 11.2.4.3. SWOT Analysis
- 11.2.4.4. Recent Developments
- 11.2.4.5. Financials (Based on Availability)
- 11.2.5 Corporation Service Company
- 11.2.5.1. Overview
- 11.2.5.2. Products
- 11.2.5.3. SWOT Analysis
- 11.2.5.4. Recent Developments
- 11.2.5.5. Financials (Based on Availability)
- 11.2.6 Fieldfisher
- 11.2.6.1. Overview
- 11.2.6.2. Products
- 11.2.6.3. SWOT Analysis
- 11.2.6.4. Recent Developments
- 11.2.6.5. Financials (Based on Availability)
- 11.2.7 Sterne Kessler
- 11.2.7.1. Overview
- 11.2.7.2. Products
- 11.2.7.3. SWOT Analysis
- 11.2.7.4. Recent Developments
- 11.2.7.5. Financials (Based on Availability)
- 11.2.8 Corteva
- 11.2.8.1. Overview
- 11.2.8.2. Products
- 11.2.8.3. SWOT Analysis
- 11.2.8.4. Recent Developments
- 11.2.8.5. Financials (Based on Availability)
- 11.2.9 Selinko
- 11.2.9.1. Overview
- 11.2.9.2. Products
- 11.2.9.3. SWOT Analysis
- 11.2.9.4. Recent Developments
- 11.2.9.5. Financials (Based on Availability)
- 11.2.10 Dennemeyer
- 11.2.10.1. Overview
- 11.2.10.2. Products
- 11.2.10.3. SWOT Analysis
- 11.2.10.4. Recent Developments
- 11.2.10.5. Financials (Based on Availability)
- 11.2.11 Ethosrisk
- 11.2.11.1. Overview
- 11.2.11.2. Products
- 11.2.11.3. SWOT Analysis
- 11.2.11.4. Recent Developments
- 11.2.11.5. Financials (Based on Availability)
- 11.2.12 Greenberg
- 11.2.12.1. Overview
- 11.2.12.2. Products
- 11.2.12.3. SWOT Analysis
- 11.2.12.4. Recent Developments
- 11.2.12.5. Financials (Based on Availability)
- 11.2.1 Dickinson Wright
List of Figures
- Figure 1: Global Anti Counterfeiting Service Revenue Breakdown (undefined, %) by Region 2025 & 2033
- Figure 2: North America Anti Counterfeiting Service Revenue (undefined), by Application 2025 & 2033
- Figure 3: North America Anti Counterfeiting Service Revenue Share (%), by Application 2025 & 2033
- Figure 4: North America Anti Counterfeiting Service Revenue (undefined), by Type 2025 & 2033
- Figure 5: North America Anti Counterfeiting Service Revenue Share (%), by Type 2025 & 2033
- Figure 6: North America Anti Counterfeiting Service Revenue (undefined), by Country 2025 & 2033
- Figure 7: North America Anti Counterfeiting Service Revenue Share (%), by Country 2025 & 2033
- Figure 8: South America Anti Counterfeiting Service Revenue (undefined), by Application 2025 & 2033
- Figure 9: South America Anti Counterfeiting Service Revenue Share (%), by Application 2025 & 2033
- Figure 10: South America Anti Counterfeiting Service Revenue (undefined), by Type 2025 & 2033
- Figure 11: South America Anti Counterfeiting Service Revenue Share (%), by Type 2025 & 2033
- Figure 12: South America Anti Counterfeiting Service Revenue (undefined), by Country 2025 & 2033
- Figure 13: South America Anti Counterfeiting Service Revenue Share (%), by Country 2025 & 2033
- Figure 14: Europe Anti Counterfeiting Service Revenue (undefined), by Application 2025 & 2033
- Figure 15: Europe Anti Counterfeiting Service Revenue Share (%), by Application 2025 & 2033
- Figure 16: Europe Anti Counterfeiting Service Revenue (undefined), by Type 2025 & 2033
- Figure 17: Europe Anti Counterfeiting Service Revenue Share (%), by Type 2025 & 2033
- Figure 18: Europe Anti Counterfeiting Service Revenue (undefined), by Country 2025 & 2033
- Figure 19: Europe Anti Counterfeiting Service Revenue Share (%), by Country 2025 & 2033
- Figure 20: Middle East & Africa Anti Counterfeiting Service Revenue (undefined), by Application 2025 & 2033
- Figure 21: Middle East & Africa Anti Counterfeiting Service Revenue Share (%), by Application 2025 & 2033
- Figure 22: Middle East & Africa Anti Counterfeiting Service Revenue (undefined), by Type 2025 & 2033
- Figure 23: Middle East & Africa Anti Counterfeiting Service Revenue Share (%), by Type 2025 & 2033
- Figure 24: Middle East & Africa Anti Counterfeiting Service Revenue (undefined), by Country 2025 & 2033
- Figure 25: Middle East & Africa Anti Counterfeiting Service Revenue Share (%), by Country 2025 & 2033
- Figure 26: Asia Pacific Anti Counterfeiting Service Revenue (undefined), by Application 2025 & 2033
- Figure 27: Asia Pacific Anti Counterfeiting Service Revenue Share (%), by Application 2025 & 2033
- Figure 28: Asia Pacific Anti Counterfeiting Service Revenue (undefined), by Type 2025 & 2033
- Figure 29: Asia Pacific Anti Counterfeiting Service Revenue Share (%), by Type 2025 & 2033
- Figure 30: Asia Pacific Anti Counterfeiting Service Revenue (undefined), by Country 2025 & 2033
- Figure 31: Asia Pacific Anti Counterfeiting Service Revenue Share (%), by Country 2025 & 2033
List of Tables
- Table 1: Global Anti Counterfeiting Service Revenue undefined Forecast, by Application 2020 & 2033
- Table 2: Global Anti Counterfeiting Service Revenue undefined Forecast, by Type 2020 & 2033
- Table 3: Global Anti Counterfeiting Service Revenue undefined Forecast, by Region 2020 & 2033
- Table 4: Global Anti Counterfeiting Service Revenue undefined Forecast, by Application 2020 & 2033
- Table 5: Global Anti Counterfeiting Service Revenue undefined Forecast, by Type 2020 & 2033
- Table 6: Global Anti Counterfeiting Service Revenue undefined Forecast, by Country 2020 & 2033
- Table 7: United States Anti Counterfeiting Service Revenue (undefined) Forecast, by Application 2020 & 2033
- Table 8: Canada Anti Counterfeiting Service Revenue (undefined) Forecast, by Application 2020 & 2033
- Table 9: Mexico Anti Counterfeiting Service Revenue (undefined) Forecast, by Application 2020 & 2033
- Table 10: Global Anti Counterfeiting Service Revenue undefined Forecast, by Application 2020 & 2033
- Table 11: Global Anti Counterfeiting Service Revenue undefined Forecast, by Type 2020 & 2033
- Table 12: Global Anti Counterfeiting Service Revenue undefined Forecast, by Country 2020 & 2033
- Table 13: Brazil Anti Counterfeiting Service Revenue (undefined) Forecast, by Application 2020 & 2033
- Table 14: Argentina Anti Counterfeiting Service Revenue (undefined) Forecast, by Application 2020 & 2033
- Table 15: Rest of South America Anti Counterfeiting Service Revenue (undefined) Forecast, by Application 2020 & 2033
- Table 16: Global Anti Counterfeiting Service Revenue undefined Forecast, by Application 2020 & 2033
- Table 17: Global Anti Counterfeiting Service Revenue undefined Forecast, by Type 2020 & 2033
- Table 18: Global Anti Counterfeiting Service Revenue undefined Forecast, by Country 2020 & 2033
- Table 19: United Kingdom Anti Counterfeiting Service Revenue (undefined) Forecast, by Application 2020 & 2033
- Table 20: Germany Anti Counterfeiting Service Revenue (undefined) Forecast, by Application 2020 & 2033
- Table 21: France Anti Counterfeiting Service Revenue (undefined) Forecast, by Application 2020 & 2033
- Table 22: Italy Anti Counterfeiting Service Revenue (undefined) Forecast, by Application 2020 & 2033
- Table 23: Spain Anti Counterfeiting Service Revenue (undefined) Forecast, by Application 2020 & 2033
- Table 24: Russia Anti Counterfeiting Service Revenue (undefined) Forecast, by Application 2020 & 2033
- Table 25: Benelux Anti Counterfeiting Service Revenue (undefined) Forecast, by Application 2020 & 2033
- Table 26: Nordics Anti Counterfeiting Service Revenue (undefined) Forecast, by Application 2020 & 2033
- Table 27: Rest of Europe Anti Counterfeiting Service Revenue (undefined) Forecast, by Application 2020 & 2033
- Table 28: Global Anti Counterfeiting Service Revenue undefined Forecast, by Application 2020 & 2033
- Table 29: Global Anti Counterfeiting Service Revenue undefined Forecast, by Type 2020 & 2033
- Table 30: Global Anti Counterfeiting Service Revenue undefined Forecast, by Country 2020 & 2033
- Table 31: Turkey Anti Counterfeiting Service Revenue (undefined) Forecast, by Application 2020 & 2033
- Table 32: Israel Anti Counterfeiting Service Revenue (undefined) Forecast, by Application 2020 & 2033
- Table 33: GCC Anti Counterfeiting Service Revenue (undefined) Forecast, by Application 2020 & 2033
- Table 34: North Africa Anti Counterfeiting Service Revenue (undefined) Forecast, by Application 2020 & 2033
- Table 35: South Africa Anti Counterfeiting Service Revenue (undefined) Forecast, by Application 2020 & 2033
- Table 36: Rest of Middle East & Africa Anti Counterfeiting Service Revenue (undefined) Forecast, by Application 2020 & 2033
- Table 37: Global Anti Counterfeiting Service Revenue undefined Forecast, by Application 2020 & 2033
- Table 38: Global Anti Counterfeiting Service Revenue undefined Forecast, by Type 2020 & 2033
- Table 39: Global Anti Counterfeiting Service Revenue undefined Forecast, by Country 2020 & 2033
- Table 40: China Anti Counterfeiting Service Revenue (undefined) Forecast, by Application 2020 & 2033
- Table 41: India Anti Counterfeiting Service Revenue (undefined) Forecast, by Application 2020 & 2033
- Table 42: Japan Anti Counterfeiting Service Revenue (undefined) Forecast, by Application 2020 & 2033
- Table 43: South Korea Anti Counterfeiting Service Revenue (undefined) Forecast, by Application 2020 & 2033
- Table 44: ASEAN Anti Counterfeiting Service Revenue (undefined) Forecast, by Application 2020 & 2033
- Table 45: Oceania Anti Counterfeiting Service Revenue (undefined) Forecast, by Application 2020 & 2033
- Table 46: Rest of Asia Pacific Anti Counterfeiting Service Revenue (undefined) Forecast, by Application 2020 & 2033
Frequently Asked Questions
1. What is the projected Compound Annual Growth Rate (CAGR) of the Anti Counterfeiting Service?
The projected CAGR is approximately 12.77%.
2. Which companies are prominent players in the Anti Counterfeiting Service?
Key companies in the market include Dickinson Wright, Onsist, Klemchuk, Olnica, Corporation Service Company, Fieldfisher, Sterne Kessler, Corteva, Selinko, Dennemeyer, Ethosrisk, Greenberg.
3. What are the main segments of the Anti Counterfeiting Service?
The market segments include Application, Type.
4. Can you provide details about the market size?
The market size is estimated to be USD XXX N/A as of 2022.
5. What are some drivers contributing to market growth?
N/A
6. What are the notable trends driving market growth?
N/A
7. Are there any restraints impacting market growth?
N/A
8. Can you provide examples of recent developments in the market?
N/A
9. What pricing options are available for accessing the report?
Pricing options include single-user, multi-user, and enterprise licenses priced at USD 4250.00, USD 6375.00, and USD 8500.00 respectively.
10. Is the market size provided in terms of value or volume?
The market size is provided in terms of value, measured in N/A.
11. Are there any specific market keywords associated with the report?
Yes, the market keyword associated with the report is "Anti Counterfeiting Service," which aids in identifying and referencing the specific market segment covered.
12. How do I determine which pricing option suits my needs best?
The pricing options vary based on user requirements and access needs. Individual users may opt for single-user licenses, while businesses requiring broader access may choose multi-user or enterprise licenses for cost-effective access to the report.
13. Are there any additional resources or data provided in the Anti Counterfeiting Service report?
While the report offers comprehensive insights, it's advisable to review the specific contents or supplementary materials provided to ascertain if additional resources or data are available.
14. How can I stay updated on further developments or reports in the Anti Counterfeiting Service?
To stay informed about further developments, trends, and reports in the Anti Counterfeiting Service, consider subscribing to industry newsletters, following relevant companies and organizations, or regularly checking reputable industry news sources and publications.
Methodology
Step 1 - Identification of Relevant Samples Size from Population Database


Step 2 - Approaches for Defining Global Market Size (Value, Volume* & Price*)

Note*: In applicable scenarios
Step 3 - Data Sources
Primary Research
- Web Analytics
- Survey Reports
- Research Institute
- Latest Research Reports
- Opinion Leaders
Secondary Research
- Annual Reports
- White Paper
- Latest Press Release
- Industry Association
- Paid Database
- Investor Presentations

Step 4 - Data Triangulation
Involves using different sources of information in order to increase the validity of a study
These sources are likely to be stakeholders in a program - participants, other researchers, program staff, other community members, and so on.
Then we put all data in single framework & apply various statistical tools to find out the dynamic on the market.
During the analysis stage, feedback from the stakeholder groups would be compared to determine areas of agreement as well as areas of divergence