
Key Insights
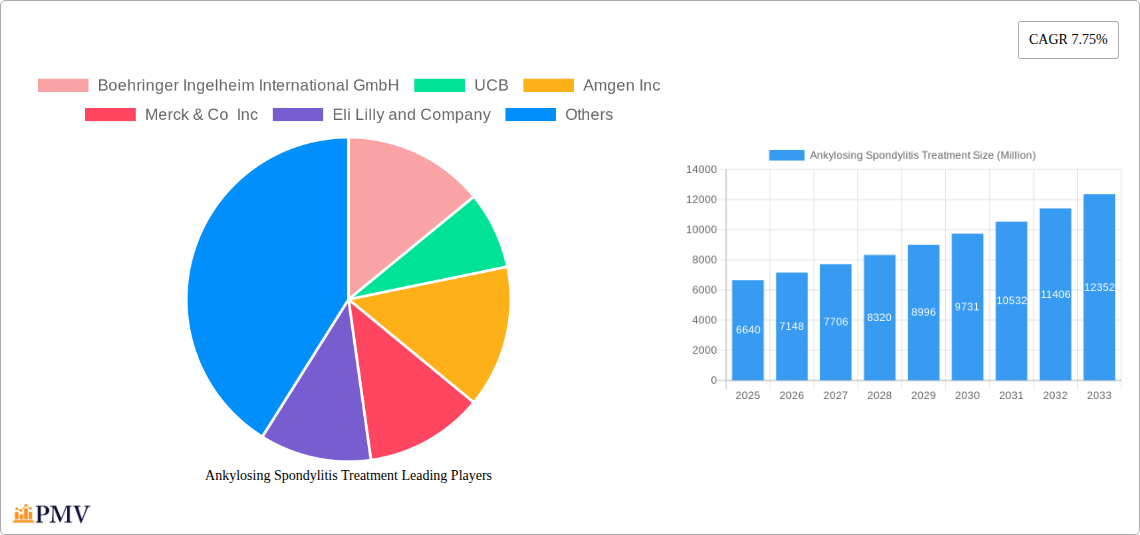
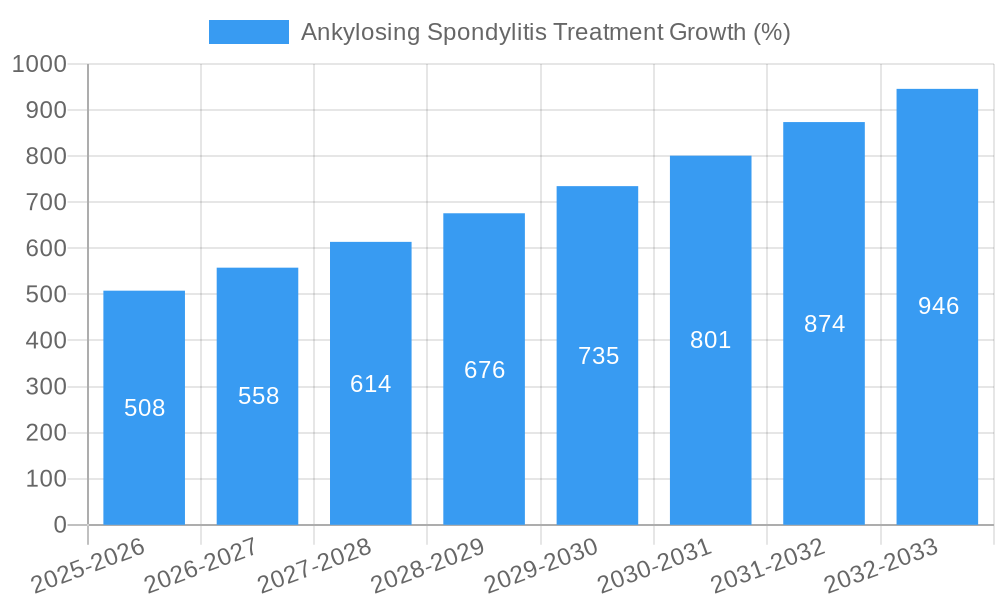
The Ankylosing Spondylitis (AS) treatment market, valued at $6.64 billion in 2025, exhibits robust growth potential, projected to expand at a Compound Annual Growth Rate (CAGR) of 7.75% from 2025 to 2033. This growth is fueled by several key factors. Increasing prevalence of AS, particularly in aging populations across North America and Europe, is a significant driver. Advancements in biologics and targeted therapies are offering more effective treatment options, improving patient outcomes and driving market expansion. Growing awareness of AS and improved diagnostic capabilities also contribute to the market's growth. While the market is dominated by medications (including biologics like TNF inhibitors and other targeted therapies), the segment encompassing therapies and surgery plays a crucial role, particularly in managing severe cases and complications. Competition among major pharmaceutical companies like Boehringer Ingelheim, UCB, Amgen, Merck, and others is intense, driving innovation and accessibility of newer treatments. However, high treatment costs and the need for long-term management remain significant challenges to broader market penetration. Regional variations in healthcare infrastructure and access to advanced therapies also influence market dynamics, with North America and Europe currently leading in terms of market share due to higher per capita healthcare expenditure and advanced healthcare systems.
The future of the AS treatment market looks promising, particularly with ongoing research focusing on developing novel therapies, including potential disease-modifying drugs targeting specific disease pathways. The focus is shifting towards personalized medicine, tailoring treatment approaches based on individual patient characteristics and genetic profiles. This personalization strategy aims to optimize treatment efficacy, minimize side effects, and enhance patient quality of life. Furthermore, the increasing adoption of digital health technologies, including remote patient monitoring and telehealth consultations, is poised to transform the landscape of AS management, improving access to care and streamlining treatment pathways. This will further boost the market by improving patient adherence and overall treatment outcomes. The expanding research and development pipeline, coupled with supportive regulatory frameworks, are expected to sustain the market's growth trajectory throughout the forecast period.
This comprehensive report provides an in-depth analysis of the Ankylosing Spondylitis (AS) treatment market, offering valuable insights for stakeholders across the pharmaceutical, healthcare, and investment sectors. With a focus on the period 2019-2033, this report utilizes a robust methodology incorporating historical data (2019-2024), a base year of 2025, and projections extending to 2033. The market is valued at $XX Million in 2025 and is projected to reach $XX Million by 2033, exhibiting a CAGR of XX%. The report segments the market by treatment types (Medication, Therapy, Surgery) and analyzes key players, industry trends, and future growth potential.
Ankylosing Spondylitis Treatment Market Structure & Competitive Dynamics
This section analyzes the competitive landscape of the Ankylosing Spondylitis treatment market, encompassing market concentration, innovation ecosystems, regulatory frameworks, and M&A activities. The market is characterized by a moderately concentrated structure with several major players holding significant market share. In 2025, the top five companies—AbbVie Inc, UCB, Amgen Inc, Boehringer Ingelheim International GmbH, and Eli Lilly and Company—are estimated to account for approximately XX% of the global market share. However, the presence of numerous smaller companies and emerging biosimilar manufacturers introduces significant competitive pressure. The market is heavily influenced by regulatory approvals, patent expirations, and the ongoing development of novel therapies. Recent M&A activity has been relatively low in terms of deal value, with a total estimated value of $XX Million recorded between 2019-2024, largely driven by smaller acquisitions and licensing agreements. Innovation ecosystems are increasingly focused on biosimilars and targeted therapies, driven by a need for more effective and affordable treatments. The regulatory environment is complex and varies across different regions, influencing market access and pricing strategies.
- Market Concentration: High, with top 5 players holding XX% market share (2025 estimate).
- M&A Activity (2019-2024): Total deal value estimated at $XX Million.
- Key Innovation Areas: Biosimilars, targeted therapies, and improved delivery systems.
- Regulatory Landscape: Complex and varies geographically, impacting market access.
Ankylosing Spondylitis Treatment Industry Trends & Insights
The Ankylosing Spondylitis treatment market is experiencing robust growth driven by several key factors. Rising prevalence of AS, increasing healthcare expenditure in key markets, and the launch of new and improved therapies are major contributors. Technological advancements, particularly in biosimilar development and targeted therapies, are transforming treatment paradigms. The market is witnessing a shift towards preference for more convenient and effective treatment options, such as oral medications and biologics with improved safety profiles. Consumer preferences are playing a significant role, influencing the demand for targeted therapies. The competitive landscape is dynamic, with ongoing innovation, market entry of new players, and the emergence of biosimilars leading to increased competition. The market's growth is further influenced by government initiatives and healthcare policies aimed at improving access to AS treatments. The global market is projected to experience robust growth, with a CAGR of XX% during the forecast period (2025-2033), indicating strong future prospects. Market penetration of biologics is expected to increase significantly over this period.
Dominant Markets & Segments in Ankylosing Spondylitis Treatment
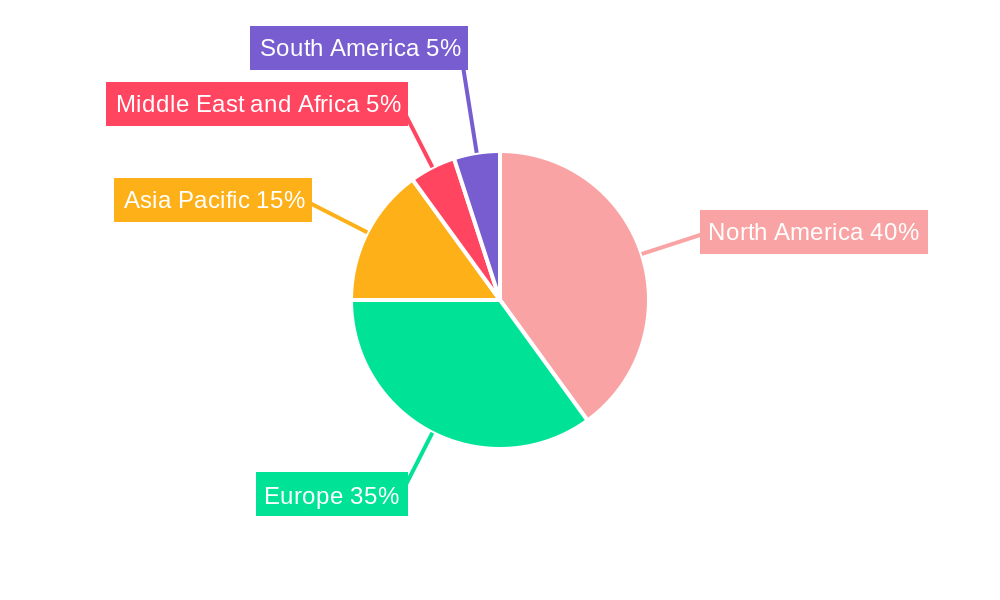
The North American market currently holds the largest share of the global Ankylosing Spondylitis treatment market, driven by high prevalence rates, strong healthcare infrastructure, and significant investments in research and development. European markets represent another significant segment, characterized by high healthcare spending and advanced healthcare systems. Within treatment types, Medication accounts for the largest segment, due to the widespread use of NSAIDs, DMARDs, and biologics. The Others segment (Therapy, Surgery) represents a smaller but growing segment, driven by an increased focus on non-pharmacological approaches such as physiotherapy and in certain cases, spinal surgery.
- Key Drivers for North American Dominance:
- High prevalence of AS
- Robust healthcare infrastructure
- High healthcare expenditure
- Favorable regulatory environment
- Key Drivers for Medication Segment Dominance:
- Widespread availability of effective medications
- Established treatment guidelines
- Relatively lower cost compared to biologics
Ankylosing Spondylitis Treatment Product Innovations
Recent years have witnessed significant advancements in Ankylosing Spondylitis treatment, with a focus on developing more targeted and effective therapies. The introduction of biosimilars offers cost-effective alternatives to established biologics, expanding treatment access. Several companies are actively engaged in developing novel therapies, including small molecule inhibitors and gene therapies. The focus is on improving patient outcomes through targeted mechanisms of action and reduced side effect profiles. These innovations aim to better address the specific needs of AS patients, leading to improvements in long-term disease management and quality of life.
Report Segmentation & Scope
This report segments the Ankylosing Spondylitis treatment market by treatment types:
Medication: This segment includes NSAIDs, DMARDs, and biologics. The market size for medication is estimated at $XX Million in 2025 and is projected to grow at a CAGR of XX% from 2025-2033. The segment is characterized by intense competition, driven by the presence of established biologics and emerging biosimilars.
Others (Therapy, Surgery): This segment includes non-pharmacological treatments such as physical therapy, exercise, and surgery. While smaller than the medication segment, it is expected to see moderate growth due to increasing awareness and improved access to therapies. The market size for this segment is estimated at $XX Million in 2025 and is projected to grow at a CAGR of XX% from 2025-2033. Competition is relatively less intense compared to the medication segment.
Key Drivers of Ankylosing Spondylitis Treatment Growth
Several factors contribute to the growth of the Ankylosing Spondylitis treatment market. Increased awareness of AS and improved diagnostic capabilities lead to earlier diagnosis and treatment initiation. The rising prevalence of AS globally, coupled with aging populations in developed countries, fuels market growth. Technological advancements, particularly in targeted therapies and biosimilars, drive innovation and improve treatment efficacy and accessibility. Favorable regulatory frameworks and supportive healthcare policies increase market access and adoption of newer therapies. Finally, increasing healthcare expenditure and improved insurance coverage enhance affordability and encourage wider treatment adoption.
Challenges in the Ankylosing Spondylitis Treatment Sector
Despite strong growth prospects, several challenges hinder market development. High treatment costs and limited insurance coverage pose significant barriers, especially in emerging markets. The complexity of AS and variable treatment responses necessitate personalized medicine approaches, presenting logistical and cost challenges. Regulatory hurdles and lengthy approval processes delay the introduction of innovative therapies. Supply chain disruptions and fluctuations in raw material prices can impact drug availability and affordability. Lastly, increasing competition from biosimilars necessitates robust intellectual property protection and differentiation strategies for originator brands.
Leading Players in the Ankylosing Spondylitis Treatment Market
- Boehringer Ingelheim International GmbH
- UCB
- Amgen Inc
- Merck & Co Inc
- Eli Lilly and Company
- Novartis AG (Sandoz)
- Celltrion Healthcare
- AbbVie Inc
- Reliance Life Sciences
- Johnson & Johnson Services Inc
- Pfizer Inc
- Gilead Sciences Inc
Key Developments in Ankylosing Spondylitis Treatment Sector
- August 2023: Simcere Pharmaceutical and Lynk Pharmaceuticals report positive Phase II clinical trial data for LNK01001.
- November 2022: Australia approves AVT02, a Humira biosimilar, for AS treatment.
- July 2022: European Commission approves RINVOQ (upadacitinib) for non-radiographic axial spondyloarthritis.
Strategic Ankylosing Spondylitis Treatment Market Outlook
The Ankylosing Spondylitis treatment market is poised for continued growth, driven by ongoing innovation, increasing prevalence, and expanding access to effective therapies. Strategic opportunities lie in developing personalized medicine approaches, focusing on early diagnosis and intervention, and leveraging digital health technologies to improve patient outcomes. Companies should invest in research and development of novel therapies, explore strategic partnerships and collaborations, and adopt robust commercialization strategies to navigate the competitive landscape effectively. The market offers significant potential for both established players and emerging companies to capitalize on unmet needs and drive further growth in the coming years.
Ankylosing Spondylitis Treatment Segmentation
-
1. Treatment Types
- 1.1. Medication
- 1.2. Therapy
- 1.3. Surgery
Ankylosing Spondylitis Treatment Segmentation By Geography
-
1. North America
- 1.1. United States
- 1.2. Canada
- 1.3. Mexico
-
2. Europe
- 2.1. Germany
- 2.2. United Kingdom
- 2.3. France
- 2.4. Italy
- 2.5. Spain
- 2.6. Rest of Europe
-
3. Asia Pacific
- 3.1. China
- 3.2. Japan
- 3.3. India
- 3.4. Australia
- 3.5. South Korea
- 3.6. Rest of Asia Pacific
-
4. Middle East and Africa
- 4.1. GCC
- 4.2. South Africa
- 4.3. Rest of Middle East and Africa
-
5. South America
- 5.1. Brazil
- 5.2. Argentina
- 5.3. Rest of South America
Ankylosing Spondylitis Treatment REPORT HIGHLIGHTS
| Aspects | Details |
|---|---|
| Study Period | 2019-2033 |
| Base Year | 2024 |
| Estimated Year | 2025 |
| Forecast Period | 2025-2033 |
| Historical Period | 2019-2024 |
| Growth Rate | CAGR of 7.75% from 2019-2033 |
| Segmentation |
|
Table of Contents
- 1. Introduction
- 1.1. Research Scope
- 1.2. Market Segmentation
- 1.3. Research Methodology
- 1.4. Definitions and Assumptions
- 2. Executive Summary
- 2.1. Introduction
- 3. Market Dynamics
- 3.1. Introduction
- 3.2. Market Drivers
- 3.2.1. Growing Burden of Target Diseases and Rising Reimbursements for the Treatment; Research and Development for Effective Treatment
- 3.3. Market Restrains
- 3.3.1. High Cost of Treatment
- 3.4. Market Trends
- 3.4.1. Nonsteroidal Anti-Inflammatory Drugs (NSAIDs) Segment is Expected to Hold a Significant Market Share Over the Forecast Period
- 4. Market Factor Analysis
- 4.1. Porters Five Forces
- 4.2. Supply/Value Chain
- 4.3. PESTEL analysis
- 4.4. Market Entropy
- 4.5. Patent/Trademark Analysis
- 5. Global Ankylosing Spondylitis Treatment Analysis, Insights and Forecast, 2019-2031
- 5.1. Market Analysis, Insights and Forecast - by Treatment Types
- 5.1.1. Medication
- 5.1.2. Therapy
- 5.1.3. Surgery
- 5.2. Market Analysis, Insights and Forecast - by Region
- 5.2.1. North America
- 5.2.2. Europe
- 5.2.3. Asia Pacific
- 5.2.4. Middle East and Africa
- 5.2.5. South America
- 5.1. Market Analysis, Insights and Forecast - by Treatment Types
- 6. North America Ankylosing Spondylitis Treatment Analysis, Insights and Forecast, 2019-2031
- 6.1. Market Analysis, Insights and Forecast - by Treatment Types
- 6.1.1. Medication
- 6.1.2. Therapy
- 6.1.3. Surgery
- 6.1. Market Analysis, Insights and Forecast - by Treatment Types
- 7. Europe Ankylosing Spondylitis Treatment Analysis, Insights and Forecast, 2019-2031
- 7.1. Market Analysis, Insights and Forecast - by Treatment Types
- 7.1.1. Medication
- 7.1.2. Therapy
- 7.1.3. Surgery
- 7.1. Market Analysis, Insights and Forecast - by Treatment Types
- 8. Asia Pacific Ankylosing Spondylitis Treatment Analysis, Insights and Forecast, 2019-2031
- 8.1. Market Analysis, Insights and Forecast - by Treatment Types
- 8.1.1. Medication
- 8.1.2. Therapy
- 8.1.3. Surgery
- 8.1. Market Analysis, Insights and Forecast - by Treatment Types
- 9. Middle East and Africa Ankylosing Spondylitis Treatment Analysis, Insights and Forecast, 2019-2031
- 9.1. Market Analysis, Insights and Forecast - by Treatment Types
- 9.1.1. Medication
- 9.1.2. Therapy
- 9.1.3. Surgery
- 9.1. Market Analysis, Insights and Forecast - by Treatment Types
- 10. South America Ankylosing Spondylitis Treatment Analysis, Insights and Forecast, 2019-2031
- 10.1. Market Analysis, Insights and Forecast - by Treatment Types
- 10.1.1. Medication
- 10.1.2. Therapy
- 10.1.3. Surgery
- 10.1. Market Analysis, Insights and Forecast - by Treatment Types
- 11. North America Ankylosing Spondylitis Treatment Analysis, Insights and Forecast, 2019-2031
- 11.1. Market Analysis, Insights and Forecast - By Country/Sub-region
- 11.1.1 United States
- 11.1.2 Canada
- 11.1.3 Mexico
- 12. Europe Ankylosing Spondylitis Treatment Analysis, Insights and Forecast, 2019-2031
- 12.1. Market Analysis, Insights and Forecast - By Country/Sub-region
- 12.1.1 Germany
- 12.1.2 United Kingdom
- 12.1.3 France
- 12.1.4 Italy
- 12.1.5 Spain
- 12.1.6 Rest of Europe
- 13. Asia Pacific Ankylosing Spondylitis Treatment Analysis, Insights and Forecast, 2019-2031
- 13.1. Market Analysis, Insights and Forecast - By Country/Sub-region
- 13.1.1 China
- 13.1.2 Japan
- 13.1.3 India
- 13.1.4 Australia
- 13.1.5 South Korea
- 13.1.6 Rest of Asia Pacific
- 14. Middle East and Africa Ankylosing Spondylitis Treatment Analysis, Insights and Forecast, 2019-2031
- 14.1. Market Analysis, Insights and Forecast - By Country/Sub-region
- 14.1.1 GCC
- 14.1.2 South Africa
- 14.1.3 Rest of Middle East and Africa
- 15. South America Ankylosing Spondylitis Treatment Analysis, Insights and Forecast, 2019-2031
- 15.1. Market Analysis, Insights and Forecast - By Country/Sub-region
- 15.1.1 Brazil
- 15.1.2 Argentina
- 15.1.3 Rest of South America
- 16. Competitive Analysis
- 16.1. Global Market Share Analysis 2024
- 16.2. Company Profiles
- 16.2.1 Boehringer Ingelheim International GmbH
- 16.2.1.1. Overview
- 16.2.1.2. Products
- 16.2.1.3. SWOT Analysis
- 16.2.1.4. Recent Developments
- 16.2.1.5. Financials (Based on Availability)
- 16.2.2 UCB
- 16.2.2.1. Overview
- 16.2.2.2. Products
- 16.2.2.3. SWOT Analysis
- 16.2.2.4. Recent Developments
- 16.2.2.5. Financials (Based on Availability)
- 16.2.3 Amgen Inc
- 16.2.3.1. Overview
- 16.2.3.2. Products
- 16.2.3.3. SWOT Analysis
- 16.2.3.4. Recent Developments
- 16.2.3.5. Financials (Based on Availability)
- 16.2.4 Merck & Co Inc
- 16.2.4.1. Overview
- 16.2.4.2. Products
- 16.2.4.3. SWOT Analysis
- 16.2.4.4. Recent Developments
- 16.2.4.5. Financials (Based on Availability)
- 16.2.5 Eli Lilly and Company
- 16.2.5.1. Overview
- 16.2.5.2. Products
- 16.2.5.3. SWOT Analysis
- 16.2.5.4. Recent Developments
- 16.2.5.5. Financials (Based on Availability)
- 16.2.6 Novartis AG (Sandoz)
- 16.2.6.1. Overview
- 16.2.6.2. Products
- 16.2.6.3. SWOT Analysis
- 16.2.6.4. Recent Developments
- 16.2.6.5. Financials (Based on Availability)
- 16.2.7 Celltrion Healthcare
- 16.2.7.1. Overview
- 16.2.7.2. Products
- 16.2.7.3. SWOT Analysis
- 16.2.7.4. Recent Developments
- 16.2.7.5. Financials (Based on Availability)
- 16.2.8 AbbVie Inc
- 16.2.8.1. Overview
- 16.2.8.2. Products
- 16.2.8.3. SWOT Analysis
- 16.2.8.4. Recent Developments
- 16.2.8.5. Financials (Based on Availability)
- 16.2.9 Reliance Life Sciences
- 16.2.9.1. Overview
- 16.2.9.2. Products
- 16.2.9.3. SWOT Analysis
- 16.2.9.4. Recent Developments
- 16.2.9.5. Financials (Based on Availability)
- 16.2.10 Johnson & Johnson Services Inc
- 16.2.10.1. Overview
- 16.2.10.2. Products
- 16.2.10.3. SWOT Analysis
- 16.2.10.4. Recent Developments
- 16.2.10.5. Financials (Based on Availability)
- 16.2.11 Pfizer Inc
- 16.2.11.1. Overview
- 16.2.11.2. Products
- 16.2.11.3. SWOT Analysis
- 16.2.11.4. Recent Developments
- 16.2.11.5. Financials (Based on Availability)
- 16.2.12 Gilead Sciences Inc
- 16.2.12.1. Overview
- 16.2.12.2. Products
- 16.2.12.3. SWOT Analysis
- 16.2.12.4. Recent Developments
- 16.2.12.5. Financials (Based on Availability)
- 16.2.1 Boehringer Ingelheim International GmbH
List of Figures
- Figure 1: Global Ankylosing Spondylitis Treatment Revenue Breakdown (Million, %) by Region 2024 & 2032
- Figure 2: Global Ankylosing Spondylitis Treatment Volume Breakdown (K Unit, %) by Region 2024 & 2032
- Figure 3: North America Ankylosing Spondylitis Treatment Revenue (Million), by Country 2024 & 2032
- Figure 4: North America Ankylosing Spondylitis Treatment Volume (K Unit), by Country 2024 & 2032
- Figure 5: North America Ankylosing Spondylitis Treatment Revenue Share (%), by Country 2024 & 2032
- Figure 6: North America Ankylosing Spondylitis Treatment Volume Share (%), by Country 2024 & 2032
- Figure 7: Europe Ankylosing Spondylitis Treatment Revenue (Million), by Country 2024 & 2032
- Figure 8: Europe Ankylosing Spondylitis Treatment Volume (K Unit), by Country 2024 & 2032
- Figure 9: Europe Ankylosing Spondylitis Treatment Revenue Share (%), by Country 2024 & 2032
- Figure 10: Europe Ankylosing Spondylitis Treatment Volume Share (%), by Country 2024 & 2032
- Figure 11: Asia Pacific Ankylosing Spondylitis Treatment Revenue (Million), by Country 2024 & 2032
- Figure 12: Asia Pacific Ankylosing Spondylitis Treatment Volume (K Unit), by Country 2024 & 2032
- Figure 13: Asia Pacific Ankylosing Spondylitis Treatment Revenue Share (%), by Country 2024 & 2032
- Figure 14: Asia Pacific Ankylosing Spondylitis Treatment Volume Share (%), by Country 2024 & 2032
- Figure 15: Middle East and Africa Ankylosing Spondylitis Treatment Revenue (Million), by Country 2024 & 2032
- Figure 16: Middle East and Africa Ankylosing Spondylitis Treatment Volume (K Unit), by Country 2024 & 2032
- Figure 17: Middle East and Africa Ankylosing Spondylitis Treatment Revenue Share (%), by Country 2024 & 2032
- Figure 18: Middle East and Africa Ankylosing Spondylitis Treatment Volume Share (%), by Country 2024 & 2032
- Figure 19: South America Ankylosing Spondylitis Treatment Revenue (Million), by Country 2024 & 2032
- Figure 20: South America Ankylosing Spondylitis Treatment Volume (K Unit), by Country 2024 & 2032
- Figure 21: South America Ankylosing Spondylitis Treatment Revenue Share (%), by Country 2024 & 2032
- Figure 22: South America Ankylosing Spondylitis Treatment Volume Share (%), by Country 2024 & 2032
- Figure 23: North America Ankylosing Spondylitis Treatment Revenue (Million), by Treatment Types 2024 & 2032
- Figure 24: North America Ankylosing Spondylitis Treatment Volume (K Unit), by Treatment Types 2024 & 2032
- Figure 25: North America Ankylosing Spondylitis Treatment Revenue Share (%), by Treatment Types 2024 & 2032
- Figure 26: North America Ankylosing Spondylitis Treatment Volume Share (%), by Treatment Types 2024 & 2032
- Figure 27: North America Ankylosing Spondylitis Treatment Revenue (Million), by Country 2024 & 2032
- Figure 28: North America Ankylosing Spondylitis Treatment Volume (K Unit), by Country 2024 & 2032
- Figure 29: North America Ankylosing Spondylitis Treatment Revenue Share (%), by Country 2024 & 2032
- Figure 30: North America Ankylosing Spondylitis Treatment Volume Share (%), by Country 2024 & 2032
- Figure 31: Europe Ankylosing Spondylitis Treatment Revenue (Million), by Treatment Types 2024 & 2032
- Figure 32: Europe Ankylosing Spondylitis Treatment Volume (K Unit), by Treatment Types 2024 & 2032
- Figure 33: Europe Ankylosing Spondylitis Treatment Revenue Share (%), by Treatment Types 2024 & 2032
- Figure 34: Europe Ankylosing Spondylitis Treatment Volume Share (%), by Treatment Types 2024 & 2032
- Figure 35: Europe Ankylosing Spondylitis Treatment Revenue (Million), by Country 2024 & 2032
- Figure 36: Europe Ankylosing Spondylitis Treatment Volume (K Unit), by Country 2024 & 2032
- Figure 37: Europe Ankylosing Spondylitis Treatment Revenue Share (%), by Country 2024 & 2032
- Figure 38: Europe Ankylosing Spondylitis Treatment Volume Share (%), by Country 2024 & 2032
- Figure 39: Asia Pacific Ankylosing Spondylitis Treatment Revenue (Million), by Treatment Types 2024 & 2032
- Figure 40: Asia Pacific Ankylosing Spondylitis Treatment Volume (K Unit), by Treatment Types 2024 & 2032
- Figure 41: Asia Pacific Ankylosing Spondylitis Treatment Revenue Share (%), by Treatment Types 2024 & 2032
- Figure 42: Asia Pacific Ankylosing Spondylitis Treatment Volume Share (%), by Treatment Types 2024 & 2032
- Figure 43: Asia Pacific Ankylosing Spondylitis Treatment Revenue (Million), by Country 2024 & 2032
- Figure 44: Asia Pacific Ankylosing Spondylitis Treatment Volume (K Unit), by Country 2024 & 2032
- Figure 45: Asia Pacific Ankylosing Spondylitis Treatment Revenue Share (%), by Country 2024 & 2032
- Figure 46: Asia Pacific Ankylosing Spondylitis Treatment Volume Share (%), by Country 2024 & 2032
- Figure 47: Middle East and Africa Ankylosing Spondylitis Treatment Revenue (Million), by Treatment Types 2024 & 2032
- Figure 48: Middle East and Africa Ankylosing Spondylitis Treatment Volume (K Unit), by Treatment Types 2024 & 2032
- Figure 49: Middle East and Africa Ankylosing Spondylitis Treatment Revenue Share (%), by Treatment Types 2024 & 2032
- Figure 50: Middle East and Africa Ankylosing Spondylitis Treatment Volume Share (%), by Treatment Types 2024 & 2032
- Figure 51: Middle East and Africa Ankylosing Spondylitis Treatment Revenue (Million), by Country 2024 & 2032
- Figure 52: Middle East and Africa Ankylosing Spondylitis Treatment Volume (K Unit), by Country 2024 & 2032
- Figure 53: Middle East and Africa Ankylosing Spondylitis Treatment Revenue Share (%), by Country 2024 & 2032
- Figure 54: Middle East and Africa Ankylosing Spondylitis Treatment Volume Share (%), by Country 2024 & 2032
- Figure 55: South America Ankylosing Spondylitis Treatment Revenue (Million), by Treatment Types 2024 & 2032
- Figure 56: South America Ankylosing Spondylitis Treatment Volume (K Unit), by Treatment Types 2024 & 2032
- Figure 57: South America Ankylosing Spondylitis Treatment Revenue Share (%), by Treatment Types 2024 & 2032
- Figure 58: South America Ankylosing Spondylitis Treatment Volume Share (%), by Treatment Types 2024 & 2032
- Figure 59: South America Ankylosing Spondylitis Treatment Revenue (Million), by Country 2024 & 2032
- Figure 60: South America Ankylosing Spondylitis Treatment Volume (K Unit), by Country 2024 & 2032
- Figure 61: South America Ankylosing Spondylitis Treatment Revenue Share (%), by Country 2024 & 2032
- Figure 62: South America Ankylosing Spondylitis Treatment Volume Share (%), by Country 2024 & 2032
List of Tables
- Table 1: Global Ankylosing Spondylitis Treatment Revenue Million Forecast, by Region 2019 & 2032
- Table 2: Global Ankylosing Spondylitis Treatment Volume K Unit Forecast, by Region 2019 & 2032
- Table 3: Global Ankylosing Spondylitis Treatment Revenue Million Forecast, by Treatment Types 2019 & 2032
- Table 4: Global Ankylosing Spondylitis Treatment Volume K Unit Forecast, by Treatment Types 2019 & 2032
- Table 5: Global Ankylosing Spondylitis Treatment Revenue Million Forecast, by Region 2019 & 2032
- Table 6: Global Ankylosing Spondylitis Treatment Volume K Unit Forecast, by Region 2019 & 2032
- Table 7: Global Ankylosing Spondylitis Treatment Revenue Million Forecast, by Country 2019 & 2032
- Table 8: Global Ankylosing Spondylitis Treatment Volume K Unit Forecast, by Country 2019 & 2032
- Table 9: United States Ankylosing Spondylitis Treatment Revenue (Million) Forecast, by Application 2019 & 2032
- Table 10: United States Ankylosing Spondylitis Treatment Volume (K Unit) Forecast, by Application 2019 & 2032
- Table 11: Canada Ankylosing Spondylitis Treatment Revenue (Million) Forecast, by Application 2019 & 2032
- Table 12: Canada Ankylosing Spondylitis Treatment Volume (K Unit) Forecast, by Application 2019 & 2032
- Table 13: Mexico Ankylosing Spondylitis Treatment Revenue (Million) Forecast, by Application 2019 & 2032
- Table 14: Mexico Ankylosing Spondylitis Treatment Volume (K Unit) Forecast, by Application 2019 & 2032
- Table 15: Global Ankylosing Spondylitis Treatment Revenue Million Forecast, by Country 2019 & 2032
- Table 16: Global Ankylosing Spondylitis Treatment Volume K Unit Forecast, by Country 2019 & 2032
- Table 17: Germany Ankylosing Spondylitis Treatment Revenue (Million) Forecast, by Application 2019 & 2032
- Table 18: Germany Ankylosing Spondylitis Treatment Volume (K Unit) Forecast, by Application 2019 & 2032
- Table 19: United Kingdom Ankylosing Spondylitis Treatment Revenue (Million) Forecast, by Application 2019 & 2032
- Table 20: United Kingdom Ankylosing Spondylitis Treatment Volume (K Unit) Forecast, by Application 2019 & 2032
- Table 21: France Ankylosing Spondylitis Treatment Revenue (Million) Forecast, by Application 2019 & 2032
- Table 22: France Ankylosing Spondylitis Treatment Volume (K Unit) Forecast, by Application 2019 & 2032
- Table 23: Italy Ankylosing Spondylitis Treatment Revenue (Million) Forecast, by Application 2019 & 2032
- Table 24: Italy Ankylosing Spondylitis Treatment Volume (K Unit) Forecast, by Application 2019 & 2032
- Table 25: Spain Ankylosing Spondylitis Treatment Revenue (Million) Forecast, by Application 2019 & 2032
- Table 26: Spain Ankylosing Spondylitis Treatment Volume (K Unit) Forecast, by Application 2019 & 2032
- Table 27: Rest of Europe Ankylosing Spondylitis Treatment Revenue (Million) Forecast, by Application 2019 & 2032
- Table 28: Rest of Europe Ankylosing Spondylitis Treatment Volume (K Unit) Forecast, by Application 2019 & 2032
- Table 29: Global Ankylosing Spondylitis Treatment Revenue Million Forecast, by Country 2019 & 2032
- Table 30: Global Ankylosing Spondylitis Treatment Volume K Unit Forecast, by Country 2019 & 2032
- Table 31: China Ankylosing Spondylitis Treatment Revenue (Million) Forecast, by Application 2019 & 2032
- Table 32: China Ankylosing Spondylitis Treatment Volume (K Unit) Forecast, by Application 2019 & 2032
- Table 33: Japan Ankylosing Spondylitis Treatment Revenue (Million) Forecast, by Application 2019 & 2032
- Table 34: Japan Ankylosing Spondylitis Treatment Volume (K Unit) Forecast, by Application 2019 & 2032
- Table 35: India Ankylosing Spondylitis Treatment Revenue (Million) Forecast, by Application 2019 & 2032
- Table 36: India Ankylosing Spondylitis Treatment Volume (K Unit) Forecast, by Application 2019 & 2032
- Table 37: Australia Ankylosing Spondylitis Treatment Revenue (Million) Forecast, by Application 2019 & 2032
- Table 38: Australia Ankylosing Spondylitis Treatment Volume (K Unit) Forecast, by Application 2019 & 2032
- Table 39: South Korea Ankylosing Spondylitis Treatment Revenue (Million) Forecast, by Application 2019 & 2032
- Table 40: South Korea Ankylosing Spondylitis Treatment Volume (K Unit) Forecast, by Application 2019 & 2032
- Table 41: Rest of Asia Pacific Ankylosing Spondylitis Treatment Revenue (Million) Forecast, by Application 2019 & 2032
- Table 42: Rest of Asia Pacific Ankylosing Spondylitis Treatment Volume (K Unit) Forecast, by Application 2019 & 2032
- Table 43: Global Ankylosing Spondylitis Treatment Revenue Million Forecast, by Country 2019 & 2032
- Table 44: Global Ankylosing Spondylitis Treatment Volume K Unit Forecast, by Country 2019 & 2032
- Table 45: GCC Ankylosing Spondylitis Treatment Revenue (Million) Forecast, by Application 2019 & 2032
- Table 46: GCC Ankylosing Spondylitis Treatment Volume (K Unit) Forecast, by Application 2019 & 2032
- Table 47: South Africa Ankylosing Spondylitis Treatment Revenue (Million) Forecast, by Application 2019 & 2032
- Table 48: South Africa Ankylosing Spondylitis Treatment Volume (K Unit) Forecast, by Application 2019 & 2032
- Table 49: Rest of Middle East and Africa Ankylosing Spondylitis Treatment Revenue (Million) Forecast, by Application 2019 & 2032
- Table 50: Rest of Middle East and Africa Ankylosing Spondylitis Treatment Volume (K Unit) Forecast, by Application 2019 & 2032
- Table 51: Global Ankylosing Spondylitis Treatment Revenue Million Forecast, by Country 2019 & 2032
- Table 52: Global Ankylosing Spondylitis Treatment Volume K Unit Forecast, by Country 2019 & 2032
- Table 53: Brazil Ankylosing Spondylitis Treatment Revenue (Million) Forecast, by Application 2019 & 2032
- Table 54: Brazil Ankylosing Spondylitis Treatment Volume (K Unit) Forecast, by Application 2019 & 2032
- Table 55: Argentina Ankylosing Spondylitis Treatment Revenue (Million) Forecast, by Application 2019 & 2032
- Table 56: Argentina Ankylosing Spondylitis Treatment Volume (K Unit) Forecast, by Application 2019 & 2032
- Table 57: Rest of South America Ankylosing Spondylitis Treatment Revenue (Million) Forecast, by Application 2019 & 2032
- Table 58: Rest of South America Ankylosing Spondylitis Treatment Volume (K Unit) Forecast, by Application 2019 & 2032
- Table 59: Global Ankylosing Spondylitis Treatment Revenue Million Forecast, by Treatment Types 2019 & 2032
- Table 60: Global Ankylosing Spondylitis Treatment Volume K Unit Forecast, by Treatment Types 2019 & 2032
- Table 61: Global Ankylosing Spondylitis Treatment Revenue Million Forecast, by Country 2019 & 2032
- Table 62: Global Ankylosing Spondylitis Treatment Volume K Unit Forecast, by Country 2019 & 2032
- Table 63: United States Ankylosing Spondylitis Treatment Revenue (Million) Forecast, by Application 2019 & 2032
- Table 64: United States Ankylosing Spondylitis Treatment Volume (K Unit) Forecast, by Application 2019 & 2032
- Table 65: Canada Ankylosing Spondylitis Treatment Revenue (Million) Forecast, by Application 2019 & 2032
- Table 66: Canada Ankylosing Spondylitis Treatment Volume (K Unit) Forecast, by Application 2019 & 2032
- Table 67: Mexico Ankylosing Spondylitis Treatment Revenue (Million) Forecast, by Application 2019 & 2032
- Table 68: Mexico Ankylosing Spondylitis Treatment Volume (K Unit) Forecast, by Application 2019 & 2032
- Table 69: Global Ankylosing Spondylitis Treatment Revenue Million Forecast, by Treatment Types 2019 & 2032
- Table 70: Global Ankylosing Spondylitis Treatment Volume K Unit Forecast, by Treatment Types 2019 & 2032
- Table 71: Global Ankylosing Spondylitis Treatment Revenue Million Forecast, by Country 2019 & 2032
- Table 72: Global Ankylosing Spondylitis Treatment Volume K Unit Forecast, by Country 2019 & 2032
- Table 73: Germany Ankylosing Spondylitis Treatment Revenue (Million) Forecast, by Application 2019 & 2032
- Table 74: Germany Ankylosing Spondylitis Treatment Volume (K Unit) Forecast, by Application 2019 & 2032
- Table 75: United Kingdom Ankylosing Spondylitis Treatment Revenue (Million) Forecast, by Application 2019 & 2032
- Table 76: United Kingdom Ankylosing Spondylitis Treatment Volume (K Unit) Forecast, by Application 2019 & 2032
- Table 77: France Ankylosing Spondylitis Treatment Revenue (Million) Forecast, by Application 2019 & 2032
- Table 78: France Ankylosing Spondylitis Treatment Volume (K Unit) Forecast, by Application 2019 & 2032
- Table 79: Italy Ankylosing Spondylitis Treatment Revenue (Million) Forecast, by Application 2019 & 2032
- Table 80: Italy Ankylosing Spondylitis Treatment Volume (K Unit) Forecast, by Application 2019 & 2032
- Table 81: Spain Ankylosing Spondylitis Treatment Revenue (Million) Forecast, by Application 2019 & 2032
- Table 82: Spain Ankylosing Spondylitis Treatment Volume (K Unit) Forecast, by Application 2019 & 2032
- Table 83: Rest of Europe Ankylosing Spondylitis Treatment Revenue (Million) Forecast, by Application 2019 & 2032
- Table 84: Rest of Europe Ankylosing Spondylitis Treatment Volume (K Unit) Forecast, by Application 2019 & 2032
- Table 85: Global Ankylosing Spondylitis Treatment Revenue Million Forecast, by Treatment Types 2019 & 2032
- Table 86: Global Ankylosing Spondylitis Treatment Volume K Unit Forecast, by Treatment Types 2019 & 2032
- Table 87: Global Ankylosing Spondylitis Treatment Revenue Million Forecast, by Country 2019 & 2032
- Table 88: Global Ankylosing Spondylitis Treatment Volume K Unit Forecast, by Country 2019 & 2032
- Table 89: China Ankylosing Spondylitis Treatment Revenue (Million) Forecast, by Application 2019 & 2032
- Table 90: China Ankylosing Spondylitis Treatment Volume (K Unit) Forecast, by Application 2019 & 2032
- Table 91: Japan Ankylosing Spondylitis Treatment Revenue (Million) Forecast, by Application 2019 & 2032
- Table 92: Japan Ankylosing Spondylitis Treatment Volume (K Unit) Forecast, by Application 2019 & 2032
- Table 93: India Ankylosing Spondylitis Treatment Revenue (Million) Forecast, by Application 2019 & 2032
- Table 94: India Ankylosing Spondylitis Treatment Volume (K Unit) Forecast, by Application 2019 & 2032
- Table 95: Australia Ankylosing Spondylitis Treatment Revenue (Million) Forecast, by Application 2019 & 2032
- Table 96: Australia Ankylosing Spondylitis Treatment Volume (K Unit) Forecast, by Application 2019 & 2032
- Table 97: South Korea Ankylosing Spondylitis Treatment Revenue (Million) Forecast, by Application 2019 & 2032
- Table 98: South Korea Ankylosing Spondylitis Treatment Volume (K Unit) Forecast, by Application 2019 & 2032
- Table 99: Rest of Asia Pacific Ankylosing Spondylitis Treatment Revenue (Million) Forecast, by Application 2019 & 2032
- Table 100: Rest of Asia Pacific Ankylosing Spondylitis Treatment Volume (K Unit) Forecast, by Application 2019 & 2032
- Table 101: Global Ankylosing Spondylitis Treatment Revenue Million Forecast, by Treatment Types 2019 & 2032
- Table 102: Global Ankylosing Spondylitis Treatment Volume K Unit Forecast, by Treatment Types 2019 & 2032
- Table 103: Global Ankylosing Spondylitis Treatment Revenue Million Forecast, by Country 2019 & 2032
- Table 104: Global Ankylosing Spondylitis Treatment Volume K Unit Forecast, by Country 2019 & 2032
- Table 105: GCC Ankylosing Spondylitis Treatment Revenue (Million) Forecast, by Application 2019 & 2032
- Table 106: GCC Ankylosing Spondylitis Treatment Volume (K Unit) Forecast, by Application 2019 & 2032
- Table 107: South Africa Ankylosing Spondylitis Treatment Revenue (Million) Forecast, by Application 2019 & 2032
- Table 108: South Africa Ankylosing Spondylitis Treatment Volume (K Unit) Forecast, by Application 2019 & 2032
- Table 109: Rest of Middle East and Africa Ankylosing Spondylitis Treatment Revenue (Million) Forecast, by Application 2019 & 2032
- Table 110: Rest of Middle East and Africa Ankylosing Spondylitis Treatment Volume (K Unit) Forecast, by Application 2019 & 2032
- Table 111: Global Ankylosing Spondylitis Treatment Revenue Million Forecast, by Treatment Types 2019 & 2032
- Table 112: Global Ankylosing Spondylitis Treatment Volume K Unit Forecast, by Treatment Types 2019 & 2032
- Table 113: Global Ankylosing Spondylitis Treatment Revenue Million Forecast, by Country 2019 & 2032
- Table 114: Global Ankylosing Spondylitis Treatment Volume K Unit Forecast, by Country 2019 & 2032
- Table 115: Brazil Ankylosing Spondylitis Treatment Revenue (Million) Forecast, by Application 2019 & 2032
- Table 116: Brazil Ankylosing Spondylitis Treatment Volume (K Unit) Forecast, by Application 2019 & 2032
- Table 117: Argentina Ankylosing Spondylitis Treatment Revenue (Million) Forecast, by Application 2019 & 2032
- Table 118: Argentina Ankylosing Spondylitis Treatment Volume (K Unit) Forecast, by Application 2019 & 2032
- Table 119: Rest of South America Ankylosing Spondylitis Treatment Revenue (Million) Forecast, by Application 2019 & 2032
- Table 120: Rest of South America Ankylosing Spondylitis Treatment Volume (K Unit) Forecast, by Application 2019 & 2032
Frequently Asked Questions
1. What is the projected Compound Annual Growth Rate (CAGR) of the Ankylosing Spondylitis Treatment?
The projected CAGR is approximately 7.75%.
2. Which companies are prominent players in the Ankylosing Spondylitis Treatment?
Key companies in the market include Boehringer Ingelheim International GmbH, UCB, Amgen Inc, Merck & Co Inc, Eli Lilly and Company, Novartis AG (Sandoz), Celltrion Healthcare, AbbVie Inc, Reliance Life Sciences, Johnson & Johnson Services Inc, Pfizer Inc, Gilead Sciences Inc.
3. What are the main segments of the Ankylosing Spondylitis Treatment?
The market segments include Treatment Types.
4. Can you provide details about the market size?
The market size is estimated to be USD 6.64 Million as of 2022.
5. What are some drivers contributing to market growth?
Growing Burden of Target Diseases and Rising Reimbursements for the Treatment; Research and Development for Effective Treatment.
6. What are the notable trends driving market growth?
Nonsteroidal Anti-Inflammatory Drugs (NSAIDs) Segment is Expected to Hold a Significant Market Share Over the Forecast Period.
7. Are there any restraints impacting market growth?
High Cost of Treatment.
8. Can you provide examples of recent developments in the market?
In August 2023, Simcere Pharmaceutical and Lynk Pharmaceuticals reported positive data from their Phase II clinical trial of LNK01001 for treating ankylosing spondylitis. Simcere and Lynk Pharmaceuticals jointly developed the LNK01001, and in March 2022, they signed a strategic agreement for the development and commercialization of LNK01001.
9. What pricing options are available for accessing the report?
Pricing options include single-user, multi-user, and enterprise licenses priced at USD 4750, USD 5250, and USD 8750 respectively.
10. Is the market size provided in terms of value or volume?
The market size is provided in terms of value, measured in Million and volume, measured in K Unit.
11. Are there any specific market keywords associated with the report?
Yes, the market keyword associated with the report is "Ankylosing Spondylitis Treatment," which aids in identifying and referencing the specific market segment covered.
12. How do I determine which pricing option suits my needs best?
The pricing options vary based on user requirements and access needs. Individual users may opt for single-user licenses, while businesses requiring broader access may choose multi-user or enterprise licenses for cost-effective access to the report.
13. Are there any additional resources or data provided in the Ankylosing Spondylitis Treatment report?
While the report offers comprehensive insights, it's advisable to review the specific contents or supplementary materials provided to ascertain if additional resources or data are available.
14. How can I stay updated on further developments or reports in the Ankylosing Spondylitis Treatment?
To stay informed about further developments, trends, and reports in the Ankylosing Spondylitis Treatment, consider subscribing to industry newsletters, following relevant companies and organizations, or regularly checking reputable industry news sources and publications.
Methodology
Step 1 - Identification of Relevant Samples Size from Population Database


Step 2 - Approaches for Defining Global Market Size (Value, Volume* & Price*)

Note*: In applicable scenarios
Step 3 - Data Sources
Primary Research
- Web Analytics
- Survey Reports
- Research Institute
- Latest Research Reports
- Opinion Leaders
Secondary Research
- Annual Reports
- White Paper
- Latest Press Release
- Industry Association
- Paid Database
- Investor Presentations

Step 4 - Data Triangulation
Involves using different sources of information in order to increase the validity of a study
These sources are likely to be stakeholders in a program - participants, other researchers, program staff, other community members, and so on.
Then we put all data in single framework & apply various statistical tools to find out the dynamic on the market.
During the analysis stage, feedback from the stakeholder groups would be compared to determine areas of agreement as well as areas of divergence


