

Key Insights
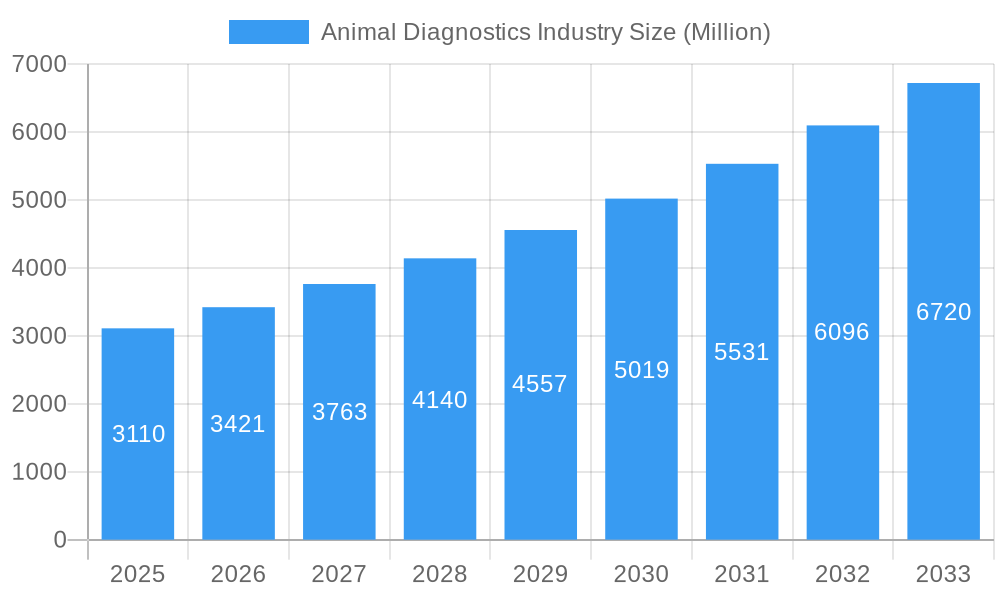
The global animal diagnostics market, valued at $3.11 billion in 2025, is poised for robust growth, projected to expand at a compound annual growth rate (CAGR) of 10% from 2025 to 2033. This expansion is driven by several key factors. Increasing pet ownership globally, coupled with rising pet humanization, fuels demand for advanced diagnostic tools to ensure animal health and well-being. Furthermore, the increasing prevalence of zoonotic diseases—diseases transmissible from animals to humans—is prompting greater investment in early detection and prevention strategies, thereby boosting the market. Technological advancements, such as the development of more sensitive and specific immunodiagnostic tests and molecular diagnostics, are also contributing significantly to market growth. The market is segmented by animal type (cats, dogs, other animals), application (bacteriology, parasitology, clinical pathology, other applications), and technology (immunodiagnostic tests, molecular diagnostics, diagnostic imaging, other diagnostics). The North American region currently holds a significant market share, driven by higher pet ownership rates and advanced veterinary infrastructure. However, the Asia-Pacific region is expected to exhibit substantial growth in the coming years, fueled by rising disposable incomes and increasing awareness of animal health.
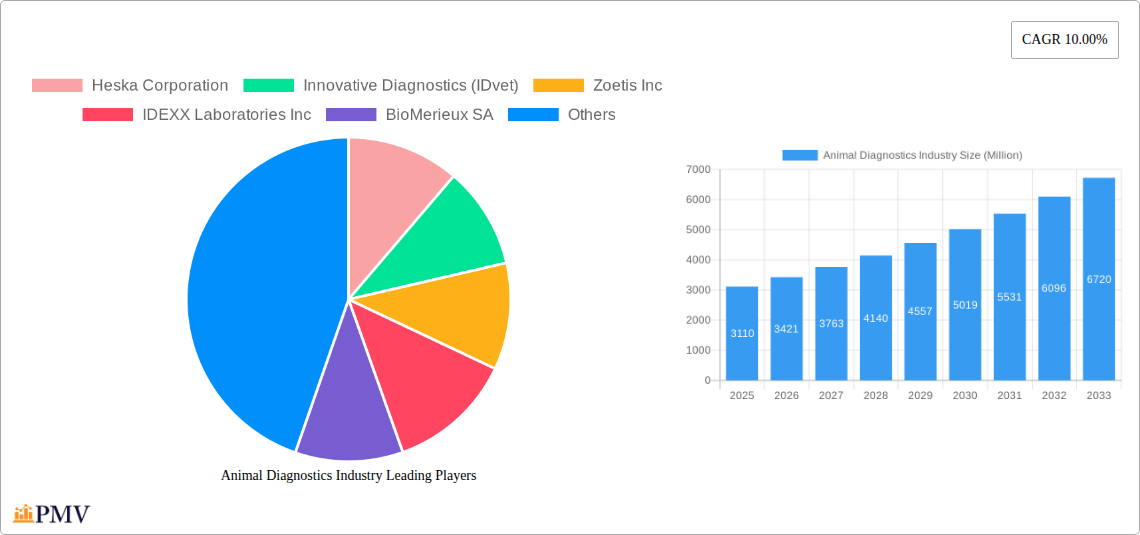
Animal Diagnostics Industry Market Size (In Billion)
Competition in the animal diagnostics market is intense, with major players including Heska Corporation, IDEXX Laboratories Inc., Zoetis Inc., and BioMérieux SA. These companies are continuously investing in research and development to enhance their product portfolios and expand their market presence. The market also includes a number of smaller, specialized companies focusing on niche applications or technologies. The growth trajectory is expected to be influenced by factors such as regulatory approvals for new diagnostic technologies, the increasing adoption of point-of-care testing, and the growing integration of data analytics in veterinary practices. Challenges remain, however, including the high cost of advanced diagnostic tests, particularly in developing countries, and the need for ongoing professional training to ensure effective utilization of these technologies. Despite these challenges, the long-term outlook for the animal diagnostics market remains positive, driven by the aforementioned factors and a global commitment to improving animal healthcare.
Animal Diagnostics Industry Company Market Share
Animal Diagnostics Industry Market Report: 2019-2033
This comprehensive report provides a detailed analysis of the Animal Diagnostics Industry, offering invaluable insights for stakeholders across the value chain. With a study period spanning 2019-2033, a base year of 2025, and a forecast period of 2025-2033, this report leverages historical data (2019-2024) and future projections to deliver a robust understanding of market dynamics. The total market size is projected to reach xx Million by 2033.
Animal Diagnostics Industry Market Structure & Competitive Dynamics
The animal diagnostics market exhibits a moderately consolidated structure, with key players like IDEXX Laboratories Inc., Zoetis Inc., and Heska Corporation holding significant market share. The market concentration is influenced by factors such as the high capital expenditure required for research and development, stringent regulatory approvals, and the need for established distribution networks. Innovation plays a crucial role, with companies continuously investing in developing advanced diagnostic technologies like molecular diagnostics and immunodiagnostic tests. The regulatory landscape varies across geographies, impacting market access and product approvals. Substitute products, such as traditional diagnostic methods, pose a competitive threat, although the trend is toward adoption of more precise and rapid diagnostic tools. End-user trends, particularly the increasing pet ownership and rising awareness of animal health, are driving market expansion. The industry witnesses considerable M&A activity, with larger companies acquiring smaller players to expand their product portfolios and geographic reach. Recent M&A deals have involved valuations ranging from xx Million to xx Million, reflecting the strategic importance of this sector. Market share data reveals that IDEXX Laboratories Inc. holds approximately xx% of the market share, followed by Zoetis Inc. with xx% and Heska Corporation with xx%.
Animal Diagnostics Industry Industry Trends & Insights
The animal diagnostics market is experiencing robust growth, driven by several key factors. The increasing prevalence of zoonotic diseases is prompting higher demand for diagnostic solutions. Technological advancements, particularly in molecular diagnostics and point-of-care testing, are enabling faster, more accurate, and efficient diagnostics. Consumer preferences are shifting towards personalized animal healthcare, leading to greater adoption of advanced diagnostic tools. The rise in pet ownership globally significantly fuels market expansion. Veterinary professionals are increasingly adopting advanced diagnostics to improve patient outcomes and enhance efficiency in their practices. Furthermore, favorable government regulations and increasing investment in research and development are contributing to the industry's growth. The market is projected to experience a CAGR of xx% during the forecast period (2025-2033). Market penetration of advanced technologies like molecular diagnostics is expected to increase from xx% in 2025 to xx% by 2033. Competitive dynamics are shaped by innovation, pricing strategies, and market penetration efforts by major players.
Dominant Markets & Segments in Animal Diagnostics Industry
The North American region currently dominates the animal diagnostics market, driven by factors such as high pet ownership rates, well-established veterinary infrastructure, and increased awareness of animal health. Within this region, the United States holds the largest market share. Among animal segments, dogs and cats account for a significant portion of the market due to their high prevalence as companion animals and greater access to veterinary care. Clinical pathology is a dominant application area, reflecting the importance of routine diagnostic testing in animal healthcare. Immunodiagnostic tests constitute the largest technology segment, due to their wide applicability and relatively lower cost compared to other technologies.
- Key Drivers for North American Dominance:
- High per capita income and disposable income enabling greater spending on pet care.
- Advanced veterinary infrastructure and skilled professionals.
- Strong regulatory support for the development and adoption of diagnostic technologies.
- High awareness among pet owners about preventive animal healthcare.
Other regions, including Europe and Asia-Pacific, are expected to witness significant growth, driven by rising pet ownership, increasing veterinary infrastructure, and rising government investments. The market for companion animals (dogs and cats) is growing rapidly across emerging economies. Bacteriology and parasitology segments are also experiencing growth, driven by the increasing incidence of infectious diseases. Molecular diagnostics is a rapidly expanding technology segment driven by the ability to offer more sensitive and specific diagnoses.
Animal Diagnostics Industry Product Innovations
Recent advancements in animal diagnostics include the development of rapid point-of-care tests, automated diagnostic systems, and improved molecular diagnostic platforms. These innovations enhance diagnostic accuracy, speed, and efficiency, while also reducing costs. Companies are focusing on developing integrated diagnostic platforms offering multiple tests, which aids workflow and optimizes resource utilization. The market is also witnessing the integration of advanced data analytics and telemedicine platforms with diagnostic systems to enhance decision-making. This trend focuses on delivering personalized and preventative care, further expanding the market's reach and application.
Report Segmentation & Scope
This report segments the animal diagnostics market across various parameters:
Animals: Cats, Dogs, Other Animals (horses, birds, livestock, etc.). The "other animals" segment is expected to experience significant growth due to rising concerns about livestock health and productivity.
Application: Bacteriology, Parasitology, Clinical Pathology (hematology, biochemistry, urinalysis), Other Applications (serology, endocrinology, etc.). Clinical Pathology is expected to have the largest market size throughout the forecast period, given the routine nature of the testing.
Technology: Immunodiagnostic Tests (ELISA, lateral flow assays), Molecular Diagnostics (PCR, next-generation sequencing), Diagnostic Imaging (radiography, ultrasound), Other Diagnostics (cytology, histology). Molecular diagnostics is expected to show the highest growth due to increasing demand for highly specific and sensitive tests.
Each segment's market size, growth projections, and competitive dynamics are analyzed in detail in the complete report.
Key Drivers of Animal Diagnostics Industry Growth
Several factors fuel the growth of the animal diagnostics industry. Technological advancements, such as the development of more sensitive and specific diagnostic tests and the integration of artificial intelligence, enhance accuracy and efficiency. Economic factors, including rising pet ownership, increased disposable incomes, and greater consumer awareness of preventative healthcare, significantly impact demand. Supportive regulatory frameworks and government initiatives that promote animal health also stimulate market growth. For example, the increasing number of veterinary clinics and the expanding veterinary profession provide increased demand.
Challenges in the Animal Diagnostics Industry Sector
The animal diagnostics sector faces several challenges. Stringent regulatory approvals and certifications can hinder market entry for new products. Supply chain disruptions and fluctuations in the prices of raw materials can impact production costs and profitability. Intense competition among established players and the emergence of new entrants creates price pressures. The varying regulatory landscapes across different countries present market access challenges. These factors, if not managed effectively, could restrict the overall market growth.
Leading Players in the Animal Diagnostics Industry Market
- Heska Corporation
- Innovative Diagnostics (IDvet)
- Zoetis Inc
- IDEXX Laboratories Inc
- BioMerieux SA
- Randox Laboratories Ltd
- Chembio Diagnostic Systems Inc
- Thermo Fisher Scientific Inc
- Indical Bioscience GmbH
- Creative Diagnostics
- Agrolabo SpA
- Virbac
- Neogen Corporation
Key Developments in Animal Diagnostics Industry Sector
- January 2022: IDEXX Laboratories, Inc. announced several product and service enhancements, including the IDEXX 4Dx Plus Test, VetConnectPLUS Mobile App, SediVue Dx Urine Sediment Analyzer, and the new Catalyst SDMA Test, improving veterinary practice efficiency. These improvements facilitated faster, more confident clinical decisions, thereby impacting market share positively.
- August 2022: PepiPets launched a mobile diagnostic testing service, offering at-home diagnostic testing for pets. This launch expanded market reach and access to diagnostics, particularly for pet owners in remote areas.
Strategic Animal Diagnostics Industry Market Outlook
The future of the animal diagnostics market appears promising, with considerable growth potential driven by continuous technological innovations, rising pet ownership, and increasing awareness of animal health. Strategic opportunities lie in developing advanced diagnostic tools, expanding into emerging markets, and forming strategic partnerships to enhance market penetration. Focus on personalized medicine, preventative care, and telemedicine integration will be key factors shaping market growth in the coming years. The market is primed for substantial expansion, particularly in emerging economies, as veterinary services and pet ownership continue to rise.
Animal Diagnostics Industry Segmentation
-
1. Animals
- 1.1. Cats
- 1.2. Dogs
- 1.3. Other Animals
-
2. Application
- 2.1. Bacteriology
- 2.2. Parasitology
- 2.3. Clinical Pathology
- 2.4. Other Applications
-
3. Technology
- 3.1. Immunodiagnostic Tests
- 3.2. Molecular Diagnostics
- 3.3. Diagnostic Imaging
- 3.4. Other Diagnostics
Animal Diagnostics Industry Segmentation By Geography
-
1. North America
- 1.1. United States
- 1.2. Canada
- 1.3. Mexico
-
2. Europe
- 2.1. Germany
- 2.2. United Kingdom
- 2.3. France
- 2.4. Italy
- 2.5. Spain
- 2.6. Rest of Europe
-
3. Asia Pacific
- 3.1. China
- 3.2. Japan
- 3.3. India
- 3.4. Australia
- 3.5. South Korea
- 3.6. Rest of Asia Pacific
-
4. Middle East and Africa
- 4.1. GCC
- 4.2. South Africa
- 4.3. Rest of Middle East and Africa
-
5. South America
- 5.1. Brazil
- 5.2. Argentina
- 5.3. Rest of South America
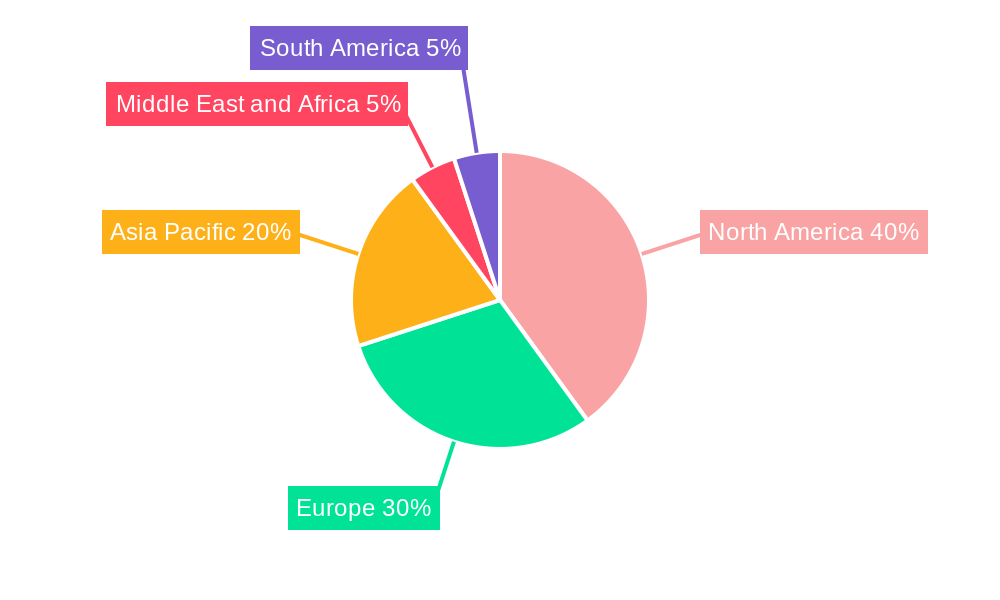
Animal Diagnostics Industry Regional Market Share
Geographic Coverage of Animal Diagnostics Industry
Animal Diagnostics Industry REPORT HIGHLIGHTS
| Aspects | Details |
|---|---|
| Study Period | 2020-2034 |
| Base Year | 2025 |
| Estimated Year | 2026 |
| Forecast Period | 2026-2034 |
| Historical Period | 2020-2025 |
| Growth Rate | CAGR of 10.00% from 2020-2034 |
| Segmentation |
|
Table of Contents
- 1. Introduction
- 1.1. Research Scope
- 1.2. Market Segmentation
- 1.3. Research Objective
- 1.4. Definitions and Assumptions
- 2. Executive Summary
- 2.1. Market Snapshot
- 3. Market Dynamics
- 3.1. Market Drivers
- 3.2. Market Restrains
- 3.3. Market Trends
- 3.4. Market Opportunities
- 4. Market Factor Analysis
- 4.1. Porters Five Forces
- 4.1.1. Bargaining Power of Suppliers
- 4.1.2. Bargaining Power of Buyers
- 4.1.3. Threat of New Entrants
- 4.1.4. Threat of Substitutes
- 4.1.5. Competitive Rivalry
- 4.2. PESTEL analysis
- 4.3. BCG Analysis
- 4.3.1. Stars (High Growth, High Market Share)
- 4.3.2. Cash Cows (Low Growth, High Market Share)
- 4.3.3. Question Mark (High Growth, Low Market Share)
- 4.3.4. Dogs (Low Growth, Low Market Share)
- 4.4. Ansoff Matrix Analysis
- 4.5. Supply Chain Analysis
- 4.6. Regulatory Landscape
- 4.7. Current Market Potential and Opportunity Assessment (TAM–SAM–SOM Framework)
- 4.8. PMV Analyst Note
- 4.1. Porters Five Forces
- 5. Market Analysis, Insights and Forecast 2021-2033
- 5.1. Market Analysis, Insights and Forecast - by Animals
- 5.1.1. Cats
- 5.1.2. Dogs
- 5.1.3. Other Animals
- 5.2. Market Analysis, Insights and Forecast - by Application
- 5.2.1. Bacteriology
- 5.2.2. Parasitology
- 5.2.3. Clinical Pathology
- 5.2.4. Other Applications
- 5.3. Market Analysis, Insights and Forecast - by Technology
- 5.3.1. Immunodiagnostic Tests
- 5.3.2. Molecular Diagnostics
- 5.3.3. Diagnostic Imaging
- 5.3.4. Other Diagnostics
- 5.4. Market Analysis, Insights and Forecast - by Region
- 5.4.1. North America
- 5.4.2. Europe
- 5.4.3. Asia Pacific
- 5.4.4. Middle East and Africa
- 5.4.5. South America
- 5.1. Market Analysis, Insights and Forecast - by Animals
- 6. Global Animal Diagnostics Industry Analysis, Insights and Forecast, 2021-2033
- 6.1. Market Analysis, Insights and Forecast - by Animals
- 6.1.1. Cats
- 6.1.2. Dogs
- 6.1.3. Other Animals
- 6.2. Market Analysis, Insights and Forecast - by Application
- 6.2.1. Bacteriology
- 6.2.2. Parasitology
- 6.2.3. Clinical Pathology
- 6.2.4. Other Applications
- 6.3. Market Analysis, Insights and Forecast - by Technology
- 6.3.1. Immunodiagnostic Tests
- 6.3.2. Molecular Diagnostics
- 6.3.3. Diagnostic Imaging
- 6.3.4. Other Diagnostics
- 6.1. Market Analysis, Insights and Forecast - by Animals
- 7. North America Animal Diagnostics Industry Analysis, Insights and Forecast, 2020-2032
- 7.1. Market Analysis, Insights and Forecast - by Animals
- 7.1.1. Cats
- 7.1.2. Dogs
- 7.1.3. Other Animals
- 7.2. Market Analysis, Insights and Forecast - by Application
- 7.2.1. Bacteriology
- 7.2.2. Parasitology
- 7.2.3. Clinical Pathology
- 7.2.4. Other Applications
- 7.3. Market Analysis, Insights and Forecast - by Technology
- 7.3.1. Immunodiagnostic Tests
- 7.3.2. Molecular Diagnostics
- 7.3.3. Diagnostic Imaging
- 7.3.4. Other Diagnostics
- 7.1. Market Analysis, Insights and Forecast - by Animals
- 8. Europe Animal Diagnostics Industry Analysis, Insights and Forecast, 2020-2032
- 8.1. Market Analysis, Insights and Forecast - by Animals
- 8.1.1. Cats
- 8.1.2. Dogs
- 8.1.3. Other Animals
- 8.2. Market Analysis, Insights and Forecast - by Application
- 8.2.1. Bacteriology
- 8.2.2. Parasitology
- 8.2.3. Clinical Pathology
- 8.2.4. Other Applications
- 8.3. Market Analysis, Insights and Forecast - by Technology
- 8.3.1. Immunodiagnostic Tests
- 8.3.2. Molecular Diagnostics
- 8.3.3. Diagnostic Imaging
- 8.3.4. Other Diagnostics
- 8.1. Market Analysis, Insights and Forecast - by Animals
- 9. Asia Pacific Animal Diagnostics Industry Analysis, Insights and Forecast, 2020-2032
- 9.1. Market Analysis, Insights and Forecast - by Animals
- 9.1.1. Cats
- 9.1.2. Dogs
- 9.1.3. Other Animals
- 9.2. Market Analysis, Insights and Forecast - by Application
- 9.2.1. Bacteriology
- 9.2.2. Parasitology
- 9.2.3. Clinical Pathology
- 9.2.4. Other Applications
- 9.3. Market Analysis, Insights and Forecast - by Technology
- 9.3.1. Immunodiagnostic Tests
- 9.3.2. Molecular Diagnostics
- 9.3.3. Diagnostic Imaging
- 9.3.4. Other Diagnostics
- 9.1. Market Analysis, Insights and Forecast - by Animals
- 10. Middle East and Africa Animal Diagnostics Industry Analysis, Insights and Forecast, 2020-2032
- 10.1. Market Analysis, Insights and Forecast - by Animals
- 10.1.1. Cats
- 10.1.2. Dogs
- 10.1.3. Other Animals
- 10.2. Market Analysis, Insights and Forecast - by Application
- 10.2.1. Bacteriology
- 10.2.2. Parasitology
- 10.2.3. Clinical Pathology
- 10.2.4. Other Applications
- 10.3. Market Analysis, Insights and Forecast - by Technology
- 10.3.1. Immunodiagnostic Tests
- 10.3.2. Molecular Diagnostics
- 10.3.3. Diagnostic Imaging
- 10.3.4. Other Diagnostics
- 10.1. Market Analysis, Insights and Forecast - by Animals
- 11. South America Animal Diagnostics Industry Analysis, Insights and Forecast, 2020-2032
- 11.1. Market Analysis, Insights and Forecast - by Animals
- 11.1.1. Cats
- 11.1.2. Dogs
- 11.1.3. Other Animals
- 11.2. Market Analysis, Insights and Forecast - by Application
- 11.2.1. Bacteriology
- 11.2.2. Parasitology
- 11.2.3. Clinical Pathology
- 11.2.4. Other Applications
- 11.3. Market Analysis, Insights and Forecast - by Technology
- 11.3.1. Immunodiagnostic Tests
- 11.3.2. Molecular Diagnostics
- 11.3.3. Diagnostic Imaging
- 11.3.4. Other Diagnostics
- 11.1. Market Analysis, Insights and Forecast - by Animals
- 12. Competitive Analysis
- 12.1. Company Profiles
- 12.1.1 Heska Corporation
- 12.1.1.1. Company Overview
- 12.1.1.2. Products
- 12.1.1.3. Company Financials
- 12.1.1.4. SWOT Analysis
- 12.1.2 Innovative Diagnostics (IDvet)
- 12.1.2.1. Company Overview
- 12.1.2.2. Products
- 12.1.2.3. Company Financials
- 12.1.2.4. SWOT Analysis
- 12.1.3 Zoetis Inc
- 12.1.3.1. Company Overview
- 12.1.3.2. Products
- 12.1.3.3. Company Financials
- 12.1.3.4. SWOT Analysis
- 12.1.4 IDEXX Laboratories Inc
- 12.1.4.1. Company Overview
- 12.1.4.2. Products
- 12.1.4.3. Company Financials
- 12.1.4.4. SWOT Analysis
- 12.1.5 BioMerieux SA
- 12.1.5.1. Company Overview
- 12.1.5.2. Products
- 12.1.5.3. Company Financials
- 12.1.5.4. SWOT Analysis
- 12.1.6 Randox Laboratories Ltd
- 12.1.6.1. Company Overview
- 12.1.6.2. Products
- 12.1.6.3. Company Financials
- 12.1.6.4. SWOT Analysis
- 12.1.7 Chembio Diagnostic Systems Inc
- 12.1.7.1. Company Overview
- 12.1.7.2. Products
- 12.1.7.3. Company Financials
- 12.1.7.4. SWOT Analysis
- 12.1.8 Thermo Fisher Scientific Inc
- 12.1.8.1. Company Overview
- 12.1.8.2. Products
- 12.1.8.3. Company Financials
- 12.1.8.4. SWOT Analysis
- 12.1.9 Indical Bioscience GmbH
- 12.1.9.1. Company Overview
- 12.1.9.2. Products
- 12.1.9.3. Company Financials
- 12.1.9.4. SWOT Analysis
- 12.1.10 Creative Diagnostics
- 12.1.10.1. Company Overview
- 12.1.10.2. Products
- 12.1.10.3. Company Financials
- 12.1.10.4. SWOT Analysis
- 12.1.11 Agrolabo SpA
- 12.1.11.1. Company Overview
- 12.1.11.2. Products
- 12.1.11.3. Company Financials
- 12.1.11.4. SWOT Analysis
- 12.1.12 Virbac
- 12.1.12.1. Company Overview
- 12.1.12.2. Products
- 12.1.12.3. Company Financials
- 12.1.12.4. SWOT Analysis
- 12.1.13 Neogen Corporation
- 12.1.13.1. Company Overview
- 12.1.13.2. Products
- 12.1.13.3. Company Financials
- 12.1.13.4. SWOT Analysis
- 12.1.1 Heska Corporation
- 12.2. Market Entropy
- 12.2.1 Company's Key Areas Served
- 12.2.2 Recent Developments
- 12.3. Company Market Share Analysis 2025
- 12.3.1 Top 5 Companies Market Share Analysis
- 12.3.2 Top 3 Companies Market Share Analysis
- 12.4. List of Potential Customers
- 13. Research Methodology
List of Figures
- Figure 1: Global Animal Diagnostics Industry Revenue Breakdown (Million, %) by Region 2025 & 2033
- Figure 2: Global Animal Diagnostics Industry Volume Breakdown (K Unit, %) by Region 2025 & 2033
- Figure 3: North America Animal Diagnostics Industry Revenue (Million), by Animals 2025 & 2033
- Figure 4: North America Animal Diagnostics Industry Volume (K Unit), by Animals 2025 & 2033
- Figure 5: North America Animal Diagnostics Industry Revenue Share (%), by Animals 2025 & 2033
- Figure 6: North America Animal Diagnostics Industry Volume Share (%), by Animals 2025 & 2033
- Figure 7: North America Animal Diagnostics Industry Revenue (Million), by Application 2025 & 2033
- Figure 8: North America Animal Diagnostics Industry Volume (K Unit), by Application 2025 & 2033
- Figure 9: North America Animal Diagnostics Industry Revenue Share (%), by Application 2025 & 2033
- Figure 10: North America Animal Diagnostics Industry Volume Share (%), by Application 2025 & 2033
- Figure 11: North America Animal Diagnostics Industry Revenue (Million), by Technology 2025 & 2033
- Figure 12: North America Animal Diagnostics Industry Volume (K Unit), by Technology 2025 & 2033
- Figure 13: North America Animal Diagnostics Industry Revenue Share (%), by Technology 2025 & 2033
- Figure 14: North America Animal Diagnostics Industry Volume Share (%), by Technology 2025 & 2033
- Figure 15: North America Animal Diagnostics Industry Revenue (Million), by Country 2025 & 2033
- Figure 16: North America Animal Diagnostics Industry Volume (K Unit), by Country 2025 & 2033
- Figure 17: North America Animal Diagnostics Industry Revenue Share (%), by Country 2025 & 2033
- Figure 18: North America Animal Diagnostics Industry Volume Share (%), by Country 2025 & 2033
- Figure 19: Europe Animal Diagnostics Industry Revenue (Million), by Animals 2025 & 2033
- Figure 20: Europe Animal Diagnostics Industry Volume (K Unit), by Animals 2025 & 2033
- Figure 21: Europe Animal Diagnostics Industry Revenue Share (%), by Animals 2025 & 2033
- Figure 22: Europe Animal Diagnostics Industry Volume Share (%), by Animals 2025 & 2033
- Figure 23: Europe Animal Diagnostics Industry Revenue (Million), by Application 2025 & 2033
- Figure 24: Europe Animal Diagnostics Industry Volume (K Unit), by Application 2025 & 2033
- Figure 25: Europe Animal Diagnostics Industry Revenue Share (%), by Application 2025 & 2033
- Figure 26: Europe Animal Diagnostics Industry Volume Share (%), by Application 2025 & 2033
- Figure 27: Europe Animal Diagnostics Industry Revenue (Million), by Technology 2025 & 2033
- Figure 28: Europe Animal Diagnostics Industry Volume (K Unit), by Technology 2025 & 2033
- Figure 29: Europe Animal Diagnostics Industry Revenue Share (%), by Technology 2025 & 2033
- Figure 30: Europe Animal Diagnostics Industry Volume Share (%), by Technology 2025 & 2033
- Figure 31: Europe Animal Diagnostics Industry Revenue (Million), by Country 2025 & 2033
- Figure 32: Europe Animal Diagnostics Industry Volume (K Unit), by Country 2025 & 2033
- Figure 33: Europe Animal Diagnostics Industry Revenue Share (%), by Country 2025 & 2033
- Figure 34: Europe Animal Diagnostics Industry Volume Share (%), by Country 2025 & 2033
- Figure 35: Asia Pacific Animal Diagnostics Industry Revenue (Million), by Animals 2025 & 2033
- Figure 36: Asia Pacific Animal Diagnostics Industry Volume (K Unit), by Animals 2025 & 2033
- Figure 37: Asia Pacific Animal Diagnostics Industry Revenue Share (%), by Animals 2025 & 2033
- Figure 38: Asia Pacific Animal Diagnostics Industry Volume Share (%), by Animals 2025 & 2033
- Figure 39: Asia Pacific Animal Diagnostics Industry Revenue (Million), by Application 2025 & 2033
- Figure 40: Asia Pacific Animal Diagnostics Industry Volume (K Unit), by Application 2025 & 2033
- Figure 41: Asia Pacific Animal Diagnostics Industry Revenue Share (%), by Application 2025 & 2033
- Figure 42: Asia Pacific Animal Diagnostics Industry Volume Share (%), by Application 2025 & 2033
- Figure 43: Asia Pacific Animal Diagnostics Industry Revenue (Million), by Technology 2025 & 2033
- Figure 44: Asia Pacific Animal Diagnostics Industry Volume (K Unit), by Technology 2025 & 2033
- Figure 45: Asia Pacific Animal Diagnostics Industry Revenue Share (%), by Technology 2025 & 2033
- Figure 46: Asia Pacific Animal Diagnostics Industry Volume Share (%), by Technology 2025 & 2033
- Figure 47: Asia Pacific Animal Diagnostics Industry Revenue (Million), by Country 2025 & 2033
- Figure 48: Asia Pacific Animal Diagnostics Industry Volume (K Unit), by Country 2025 & 2033
- Figure 49: Asia Pacific Animal Diagnostics Industry Revenue Share (%), by Country 2025 & 2033
- Figure 50: Asia Pacific Animal Diagnostics Industry Volume Share (%), by Country 2025 & 2033
- Figure 51: Middle East and Africa Animal Diagnostics Industry Revenue (Million), by Animals 2025 & 2033
- Figure 52: Middle East and Africa Animal Diagnostics Industry Volume (K Unit), by Animals 2025 & 2033
- Figure 53: Middle East and Africa Animal Diagnostics Industry Revenue Share (%), by Animals 2025 & 2033
- Figure 54: Middle East and Africa Animal Diagnostics Industry Volume Share (%), by Animals 2025 & 2033
- Figure 55: Middle East and Africa Animal Diagnostics Industry Revenue (Million), by Application 2025 & 2033
- Figure 56: Middle East and Africa Animal Diagnostics Industry Volume (K Unit), by Application 2025 & 2033
- Figure 57: Middle East and Africa Animal Diagnostics Industry Revenue Share (%), by Application 2025 & 2033
- Figure 58: Middle East and Africa Animal Diagnostics Industry Volume Share (%), by Application 2025 & 2033
- Figure 59: Middle East and Africa Animal Diagnostics Industry Revenue (Million), by Technology 2025 & 2033
- Figure 60: Middle East and Africa Animal Diagnostics Industry Volume (K Unit), by Technology 2025 & 2033
- Figure 61: Middle East and Africa Animal Diagnostics Industry Revenue Share (%), by Technology 2025 & 2033
- Figure 62: Middle East and Africa Animal Diagnostics Industry Volume Share (%), by Technology 2025 & 2033
- Figure 63: Middle East and Africa Animal Diagnostics Industry Revenue (Million), by Country 2025 & 2033
- Figure 64: Middle East and Africa Animal Diagnostics Industry Volume (K Unit), by Country 2025 & 2033
- Figure 65: Middle East and Africa Animal Diagnostics Industry Revenue Share (%), by Country 2025 & 2033
- Figure 66: Middle East and Africa Animal Diagnostics Industry Volume Share (%), by Country 2025 & 2033
- Figure 67: South America Animal Diagnostics Industry Revenue (Million), by Animals 2025 & 2033
- Figure 68: South America Animal Diagnostics Industry Volume (K Unit), by Animals 2025 & 2033
- Figure 69: South America Animal Diagnostics Industry Revenue Share (%), by Animals 2025 & 2033
- Figure 70: South America Animal Diagnostics Industry Volume Share (%), by Animals 2025 & 2033
- Figure 71: South America Animal Diagnostics Industry Revenue (Million), by Application 2025 & 2033
- Figure 72: South America Animal Diagnostics Industry Volume (K Unit), by Application 2025 & 2033
- Figure 73: South America Animal Diagnostics Industry Revenue Share (%), by Application 2025 & 2033
- Figure 74: South America Animal Diagnostics Industry Volume Share (%), by Application 2025 & 2033
- Figure 75: South America Animal Diagnostics Industry Revenue (Million), by Technology 2025 & 2033
- Figure 76: South America Animal Diagnostics Industry Volume (K Unit), by Technology 2025 & 2033
- Figure 77: South America Animal Diagnostics Industry Revenue Share (%), by Technology 2025 & 2033
- Figure 78: South America Animal Diagnostics Industry Volume Share (%), by Technology 2025 & 2033
- Figure 79: South America Animal Diagnostics Industry Revenue (Million), by Country 2025 & 2033
- Figure 80: South America Animal Diagnostics Industry Volume (K Unit), by Country 2025 & 2033
- Figure 81: South America Animal Diagnostics Industry Revenue Share (%), by Country 2025 & 2033
- Figure 82: South America Animal Diagnostics Industry Volume Share (%), by Country 2025 & 2033
List of Tables
- Table 1: Global Animal Diagnostics Industry Revenue Million Forecast, by Animals 2020 & 2033
- Table 2: Global Animal Diagnostics Industry Volume K Unit Forecast, by Animals 2020 & 2033
- Table 3: Global Animal Diagnostics Industry Revenue Million Forecast, by Application 2020 & 2033
- Table 4: Global Animal Diagnostics Industry Volume K Unit Forecast, by Application 2020 & 2033
- Table 5: Global Animal Diagnostics Industry Revenue Million Forecast, by Technology 2020 & 2033
- Table 6: Global Animal Diagnostics Industry Volume K Unit Forecast, by Technology 2020 & 2033
- Table 7: Global Animal Diagnostics Industry Revenue Million Forecast, by Region 2020 & 2033
- Table 8: Global Animal Diagnostics Industry Volume K Unit Forecast, by Region 2020 & 2033
- Table 9: Global Animal Diagnostics Industry Revenue Million Forecast, by Animals 2020 & 2033
- Table 10: Global Animal Diagnostics Industry Volume K Unit Forecast, by Animals 2020 & 2033
- Table 11: Global Animal Diagnostics Industry Revenue Million Forecast, by Application 2020 & 2033
- Table 12: Global Animal Diagnostics Industry Volume K Unit Forecast, by Application 2020 & 2033
- Table 13: Global Animal Diagnostics Industry Revenue Million Forecast, by Technology 2020 & 2033
- Table 14: Global Animal Diagnostics Industry Volume K Unit Forecast, by Technology 2020 & 2033
- Table 15: Global Animal Diagnostics Industry Revenue Million Forecast, by Country 2020 & 2033
- Table 16: Global Animal Diagnostics Industry Volume K Unit Forecast, by Country 2020 & 2033
- Table 17: United States Animal Diagnostics Industry Revenue (Million) Forecast, by Application 2020 & 2033
- Table 18: United States Animal Diagnostics Industry Volume (K Unit) Forecast, by Application 2020 & 2033
- Table 19: Canada Animal Diagnostics Industry Revenue (Million) Forecast, by Application 2020 & 2033
- Table 20: Canada Animal Diagnostics Industry Volume (K Unit) Forecast, by Application 2020 & 2033
- Table 21: Mexico Animal Diagnostics Industry Revenue (Million) Forecast, by Application 2020 & 2033
- Table 22: Mexico Animal Diagnostics Industry Volume (K Unit) Forecast, by Application 2020 & 2033
- Table 23: Global Animal Diagnostics Industry Revenue Million Forecast, by Animals 2020 & 2033
- Table 24: Global Animal Diagnostics Industry Volume K Unit Forecast, by Animals 2020 & 2033
- Table 25: Global Animal Diagnostics Industry Revenue Million Forecast, by Application 2020 & 2033
- Table 26: Global Animal Diagnostics Industry Volume K Unit Forecast, by Application 2020 & 2033
- Table 27: Global Animal Diagnostics Industry Revenue Million Forecast, by Technology 2020 & 2033
- Table 28: Global Animal Diagnostics Industry Volume K Unit Forecast, by Technology 2020 & 2033
- Table 29: Global Animal Diagnostics Industry Revenue Million Forecast, by Country 2020 & 2033
- Table 30: Global Animal Diagnostics Industry Volume K Unit Forecast, by Country 2020 & 2033
- Table 31: Germany Animal Diagnostics Industry Revenue (Million) Forecast, by Application 2020 & 2033
- Table 32: Germany Animal Diagnostics Industry Volume (K Unit) Forecast, by Application 2020 & 2033
- Table 33: United Kingdom Animal Diagnostics Industry Revenue (Million) Forecast, by Application 2020 & 2033
- Table 34: United Kingdom Animal Diagnostics Industry Volume (K Unit) Forecast, by Application 2020 & 2033
- Table 35: France Animal Diagnostics Industry Revenue (Million) Forecast, by Application 2020 & 2033
- Table 36: France Animal Diagnostics Industry Volume (K Unit) Forecast, by Application 2020 & 2033
- Table 37: Italy Animal Diagnostics Industry Revenue (Million) Forecast, by Application 2020 & 2033
- Table 38: Italy Animal Diagnostics Industry Volume (K Unit) Forecast, by Application 2020 & 2033
- Table 39: Spain Animal Diagnostics Industry Revenue (Million) Forecast, by Application 2020 & 2033
- Table 40: Spain Animal Diagnostics Industry Volume (K Unit) Forecast, by Application 2020 & 2033
- Table 41: Rest of Europe Animal Diagnostics Industry Revenue (Million) Forecast, by Application 2020 & 2033
- Table 42: Rest of Europe Animal Diagnostics Industry Volume (K Unit) Forecast, by Application 2020 & 2033
- Table 43: Global Animal Diagnostics Industry Revenue Million Forecast, by Animals 2020 & 2033
- Table 44: Global Animal Diagnostics Industry Volume K Unit Forecast, by Animals 2020 & 2033
- Table 45: Global Animal Diagnostics Industry Revenue Million Forecast, by Application 2020 & 2033
- Table 46: Global Animal Diagnostics Industry Volume K Unit Forecast, by Application 2020 & 2033
- Table 47: Global Animal Diagnostics Industry Revenue Million Forecast, by Technology 2020 & 2033
- Table 48: Global Animal Diagnostics Industry Volume K Unit Forecast, by Technology 2020 & 2033
- Table 49: Global Animal Diagnostics Industry Revenue Million Forecast, by Country 2020 & 2033
- Table 50: Global Animal Diagnostics Industry Volume K Unit Forecast, by Country 2020 & 2033
- Table 51: China Animal Diagnostics Industry Revenue (Million) Forecast, by Application 2020 & 2033
- Table 52: China Animal Diagnostics Industry Volume (K Unit) Forecast, by Application 2020 & 2033
- Table 53: Japan Animal Diagnostics Industry Revenue (Million) Forecast, by Application 2020 & 2033
- Table 54: Japan Animal Diagnostics Industry Volume (K Unit) Forecast, by Application 2020 & 2033
- Table 55: India Animal Diagnostics Industry Revenue (Million) Forecast, by Application 2020 & 2033
- Table 56: India Animal Diagnostics Industry Volume (K Unit) Forecast, by Application 2020 & 2033
- Table 57: Australia Animal Diagnostics Industry Revenue (Million) Forecast, by Application 2020 & 2033
- Table 58: Australia Animal Diagnostics Industry Volume (K Unit) Forecast, by Application 2020 & 2033
- Table 59: South Korea Animal Diagnostics Industry Revenue (Million) Forecast, by Application 2020 & 2033
- Table 60: South Korea Animal Diagnostics Industry Volume (K Unit) Forecast, by Application 2020 & 2033
- Table 61: Rest of Asia Pacific Animal Diagnostics Industry Revenue (Million) Forecast, by Application 2020 & 2033
- Table 62: Rest of Asia Pacific Animal Diagnostics Industry Volume (K Unit) Forecast, by Application 2020 & 2033
- Table 63: Global Animal Diagnostics Industry Revenue Million Forecast, by Animals 2020 & 2033
- Table 64: Global Animal Diagnostics Industry Volume K Unit Forecast, by Animals 2020 & 2033
- Table 65: Global Animal Diagnostics Industry Revenue Million Forecast, by Application 2020 & 2033
- Table 66: Global Animal Diagnostics Industry Volume K Unit Forecast, by Application 2020 & 2033
- Table 67: Global Animal Diagnostics Industry Revenue Million Forecast, by Technology 2020 & 2033
- Table 68: Global Animal Diagnostics Industry Volume K Unit Forecast, by Technology 2020 & 2033
- Table 69: Global Animal Diagnostics Industry Revenue Million Forecast, by Country 2020 & 2033
- Table 70: Global Animal Diagnostics Industry Volume K Unit Forecast, by Country 2020 & 2033
- Table 71: GCC Animal Diagnostics Industry Revenue (Million) Forecast, by Application 2020 & 2033
- Table 72: GCC Animal Diagnostics Industry Volume (K Unit) Forecast, by Application 2020 & 2033
- Table 73: South Africa Animal Diagnostics Industry Revenue (Million) Forecast, by Application 2020 & 2033
- Table 74: South Africa Animal Diagnostics Industry Volume (K Unit) Forecast, by Application 2020 & 2033
- Table 75: Rest of Middle East and Africa Animal Diagnostics Industry Revenue (Million) Forecast, by Application 2020 & 2033
- Table 76: Rest of Middle East and Africa Animal Diagnostics Industry Volume (K Unit) Forecast, by Application 2020 & 2033
- Table 77: Global Animal Diagnostics Industry Revenue Million Forecast, by Animals 2020 & 2033
- Table 78: Global Animal Diagnostics Industry Volume K Unit Forecast, by Animals 2020 & 2033
- Table 79: Global Animal Diagnostics Industry Revenue Million Forecast, by Application 2020 & 2033
- Table 80: Global Animal Diagnostics Industry Volume K Unit Forecast, by Application 2020 & 2033
- Table 81: Global Animal Diagnostics Industry Revenue Million Forecast, by Technology 2020 & 2033
- Table 82: Global Animal Diagnostics Industry Volume K Unit Forecast, by Technology 2020 & 2033
- Table 83: Global Animal Diagnostics Industry Revenue Million Forecast, by Country 2020 & 2033
- Table 84: Global Animal Diagnostics Industry Volume K Unit Forecast, by Country 2020 & 2033
- Table 85: Brazil Animal Diagnostics Industry Revenue (Million) Forecast, by Application 2020 & 2033
- Table 86: Brazil Animal Diagnostics Industry Volume (K Unit) Forecast, by Application 2020 & 2033
- Table 87: Argentina Animal Diagnostics Industry Revenue (Million) Forecast, by Application 2020 & 2033
- Table 88: Argentina Animal Diagnostics Industry Volume (K Unit) Forecast, by Application 2020 & 2033
- Table 89: Rest of South America Animal Diagnostics Industry Revenue (Million) Forecast, by Application 2020 & 2033
- Table 90: Rest of South America Animal Diagnostics Industry Volume (K Unit) Forecast, by Application 2020 & 2033
Frequently Asked Questions
1. What is the projected Compound Annual Growth Rate (CAGR) of the Animal Diagnostics Industry?
The projected CAGR is approximately 10.00%.
2. Which companies are prominent players in the Animal Diagnostics Industry?
Key companies in the market include Heska Corporation, Innovative Diagnostics (IDvet), Zoetis Inc , IDEXX Laboratories Inc, BioMerieux SA, Randox Laboratories Ltd, Chembio Diagnostic Systems Inc, Thermo Fisher Scientific Inc, Indical Bioscience GmbH, Creative Diagnostics, Agrolabo SpA, Virbac, Neogen Corporation.
3. What are the main segments of the Animal Diagnostics Industry?
The market segments include Animals, Application, Technology.
4. Can you provide details about the market size?
The market size is estimated to be USD 3.11 Million as of 2022.
5. What are some drivers contributing to market growth?
Rising Demand for Pet Insurance; Growth in the Companion Animal Population; Increasing Number of Veterinary Practitioners in Developed Economies.
6. What are the notable trends driving market growth?
Molecular Diagnostics is Expected to Witness Growth Over the Forecast Period.
7. Are there any restraints impacting market growth?
Rising Burden of the Pet Care Cost.
8. Can you provide examples of recent developments in the market?
August 2022: PepiPets launched a new mobile diagnostic testing service allowing clients to receive diagnostic testing at home for their pets.
9. What pricing options are available for accessing the report?
Pricing options include single-user, multi-user, and enterprise licenses priced at USD 4750, USD 5250, and USD 8750 respectively.
10. Is the market size provided in terms of value or volume?
The market size is provided in terms of value, measured in Million and volume, measured in K Unit.
11. Are there any specific market keywords associated with the report?
Yes, the market keyword associated with the report is "Animal Diagnostics Industry," which aids in identifying and referencing the specific market segment covered.
12. How do I determine which pricing option suits my needs best?
The pricing options vary based on user requirements and access needs. Individual users may opt for single-user licenses, while businesses requiring broader access may choose multi-user or enterprise licenses for cost-effective access to the report.
13. Are there any additional resources or data provided in the Animal Diagnostics Industry report?
While the report offers comprehensive insights, it's advisable to review the specific contents or supplementary materials provided to ascertain if additional resources or data are available.
14. How can I stay updated on further developments or reports in the Animal Diagnostics Industry?
To stay informed about further developments, trends, and reports in the Animal Diagnostics Industry, consider subscribing to industry newsletters, following relevant companies and organizations, or regularly checking reputable industry news sources and publications.
Methodology
Step 1 - Identification of Relevant Samples Size from Population Database


Step 2 - Approaches for Defining Global Market Size (Value, Volume* & Price*)

Note*: In applicable scenarios
Step 3 - Data Sources
Primary Research
- Web Analytics
- Survey Reports
- Research Institute
- Latest Research Reports
- Opinion Leaders
Secondary Research
- Annual Reports
- White Paper
- Latest Press Release
- Industry Association
- Paid Database
- Investor Presentations

Step 4 - Data Triangulation
Involves using different sources of information in order to increase the validity of a study
These sources are likely to be stakeholders in a program - participants, other researchers, program staff, other community members, and so on.
Then we put all data in single framework & apply various statistical tools to find out the dynamic on the market.
During the analysis stage, feedback from the stakeholder groups would be compared to determine areas of agreement as well as areas of divergence