
Key Insights
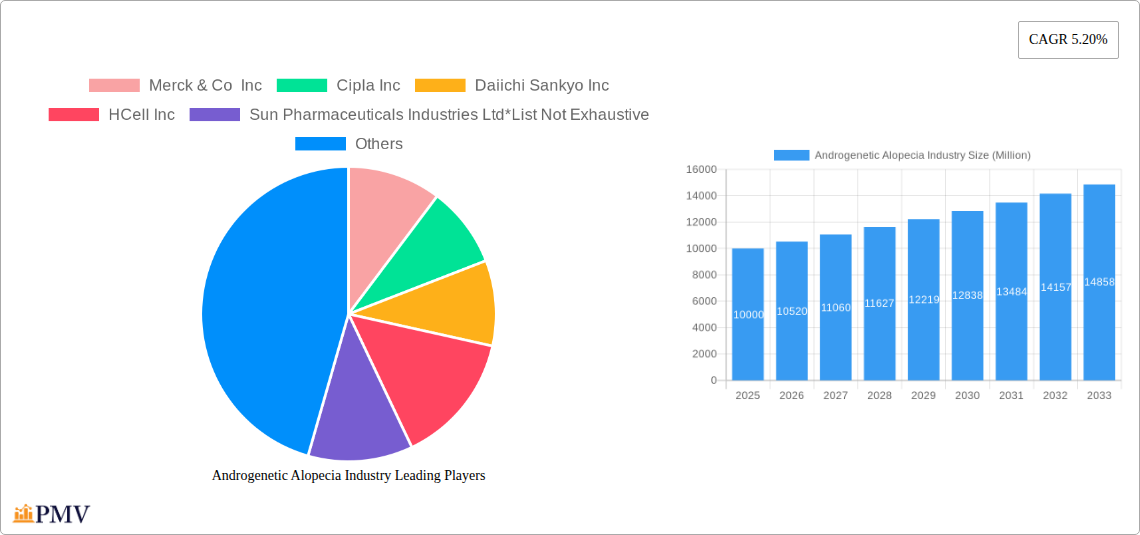
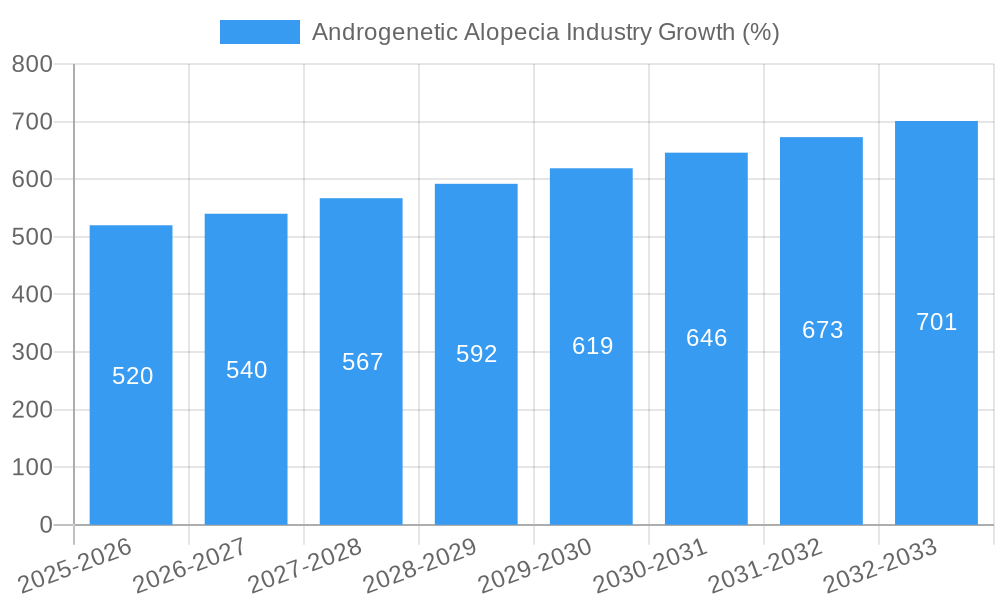
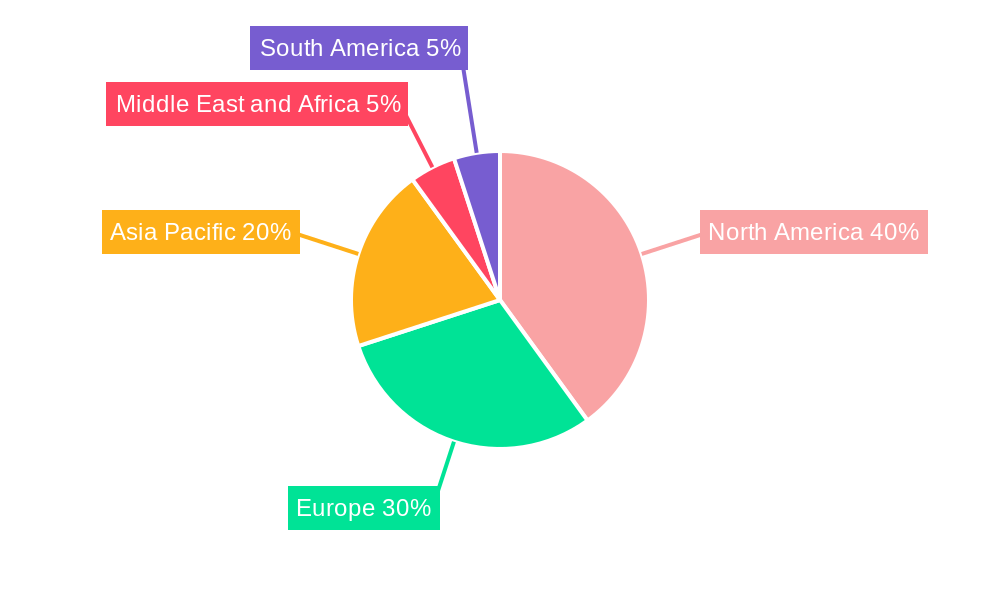
The global androgenetic alopecia (AGA) market, characterized by a steady 5.20% CAGR from 2019 to 2024, is poised for continued growth through 2033. Driven by increasing awareness of hair loss solutions and a rising prevalence of AGA, particularly among younger populations, the market is experiencing significant expansion across various segments. The oral route of administration currently dominates, but topical and injectable treatments are gaining traction due to their convenience and improved efficacy profiles. North America and Europe hold the largest market shares, reflecting higher healthcare spending and adoption of advanced therapies. However, Asia Pacific is expected to witness the fastest growth due to increasing disposable incomes and a growing awareness of aesthetic treatments. The market is segmented by disease type (androgenic alopecia, alopecia areata, etc.), gender (male, female), route of administration (oral, topical, injectable), and distribution channel (hospitals, pharmacies, online channels). Major players like Merck & Co Inc, Cipla Inc, and Johnson & Johnson are actively involved in research and development, contributing to the introduction of innovative therapies and shaping market competition. While the overall market is robust, factors such as high treatment costs and potential side effects of some medications pose certain restraints to growth.
The competitive landscape is dynamic, with established pharmaceutical companies and emerging biotech firms vying for market share. Strategic partnerships, mergers and acquisitions, and a continuous focus on product innovation are shaping the market dynamics. The future growth of the AGA market will depend heavily on technological advancements in drug delivery systems, the development of more effective treatments with fewer side effects, and increased accessibility to healthcare services globally. The increasing availability of telehealth platforms and online pharmacies is anticipated to further accelerate market growth, especially in regions with limited access to traditional healthcare settings. The market's future trajectory suggests a positive outlook, driven by a combination of scientific advancements, shifting consumer preferences, and evolving healthcare infrastructure.
Androgenetic Alopecia Industry Market Report: 2019-2033
This comprehensive report provides an in-depth analysis of the Androgenetic Alopecia industry, offering invaluable insights for stakeholders seeking to navigate this dynamic market. Covering the period 2019-2033, with a base year of 2025 and a forecast period of 2025-2033, this report leverages extensive market research to provide actionable strategies for growth and investment. The global market size is estimated at xx Million in 2025 and is projected to reach xx Million by 2033, exhibiting a CAGR of xx%.
Androgenetic Alopecia Industry Market Structure & Competitive Dynamics
The Androgenetic Alopecia market is characterized by a moderately consolidated structure, with a few key players holding significant market share. Merck & Co Inc, Johnson & Johnson, and GlaxoSmithKline PLC represent some of the established players, while smaller companies like Concert Pharmaceuticals Inc and Aclaris Therapeutics Inc are driving innovation. Market concentration is measured by the xx% share held by the top 5 players in 2025. The industry is influenced by a complex interplay of factors including stringent regulatory frameworks (e.g., FDA approvals in the US), the availability of product substitutes (e.g., hair transplantation, wigs), and evolving end-user preferences (e.g., increased demand for non-invasive treatments).
The innovation ecosystem thrives on continuous R&D efforts focused on developing novel therapeutic approaches and formulations. The level of innovation is high, with new drug candidates and delivery mechanisms entering clinical trials and regulatory processes each year. Significant M&A activity has been observed in recent years, reflecting the industry's desire for consolidation and expansion. Deal values have ranged from xx Million to xx Million for smaller acquisitions, while larger deals have exceeded xx Million. These transactions often involve the acquisition of promising pipeline assets or companies with established market presence.
Androgenetic Alopecia Industry Industry Trends & Insights
The Androgenetic Alopecia market is experiencing substantial growth, driven by several key factors. Rising awareness about hair loss and its impact on self-esteem is fueling demand for effective treatment options. Technological advancements, such as the development of more targeted and effective therapies (e.g., JAK inhibitors), and improved drug delivery systems (e.g., topical nanoformulations) are further accelerating market expansion. Consumer preferences are shifting towards minimally invasive, convenient, and efficacious treatments, leading to increased demand for topical solutions and oral medications over surgical interventions. The competitive landscape is characterized by intense rivalry amongst established pharmaceutical giants and emerging biotech companies, fueling innovation and driving down prices. Market penetration rates of currently available treatments vary considerably, with higher penetration in developed economies compared to developing nations.
Dominant Markets & Segments in Androgenetic Alopecia Industry
- By Disease Type: Androgenic alopecia constitutes the largest segment, owing to its high prevalence. Alopecia areata and other forms like cicatricial alopecia, traction alopecia, and alopecia totalis represent smaller but significant market segments. Growth in these segments is driven by factors such as increasing awareness, improved diagnosis, and the development of novel treatments.
- By Gender: The male segment currently dominates the market, but the female segment is expected to grow at a faster rate during the forecast period, fueled by increased awareness and acceptance of hair loss in women.
- By Route of Administration: Topical treatments currently hold the largest market share due to their convenience and relatively lower side effect profile, though oral medications and injectables are gaining traction. The market shares for each segment are constantly evolving depending on the success of new drugs.
- By Distribution Channel: Retail pharmacies remain the primary distribution channel, but online pharmacies are witnessing rapid growth, driven by e-commerce expansion and convenience. Hospitals also play a significant role, particularly for more complex cases requiring specialized treatment.
The North American region presently holds the largest market share, driven by high per capita healthcare expenditure, improved healthcare infrastructure, and high awareness levels, though Asian markets such as China and India show robust growth potential.
Androgenetic Alopecia Industry Product Innovations
The Androgenetic Alopecia market is witnessing significant product innovation, focusing primarily on developing more efficacious and safer treatments. This includes the development of novel drug candidates targeting specific pathways involved in hair loss, such as JAK inhibitors and other molecules targeting inflammation and hair follicle regeneration. Moreover, innovative drug delivery systems, including topical nanoformulations and advanced injectable therapies, are gaining traction, enhancing treatment efficacy and patient compliance. The focus is shifting toward personalized medicine and development of treatments catering to various genetic and demographic profiles.
Report Segmentation & Scope
This report segments the Androgenetic Alopecia market across several key parameters: disease type (androgenic alopecia, alopecia areata, cicatricial alopecia, traction alopecia, alopecia totalis), gender (male, female), route of administration (oral, topical, injectable), and distribution channel (hospitals, retail pharmacies, online pharmacies). Each segment is analyzed in detail, providing a comprehensive understanding of its market size, growth projections, and competitive dynamics. Growth forecasts for each segment are provided based on ongoing research and market dynamics, projecting varying rates of expansion.
Key Drivers of Androgenetic Alopecia Industry Growth
Several factors fuel the growth of the Androgenetic Alopecia industry. These include the increasing prevalence of hair loss, rising awareness among consumers regarding treatment options, ongoing R&D leading to the development of new and improved therapies, and favorable regulatory environments in many regions. Furthermore, the growing acceptance of hair loss as a treatable condition and increasing disposable incomes in developing countries contribute to the market expansion.
Challenges in the Androgenetic Alopecia Industry Sector
The Androgenetic Alopecia market faces several challenges. Stringent regulatory requirements for drug approvals pose a significant hurdle for companies seeking to launch new products. High R&D costs and long clinical trial periods can hinder the development of new therapies. The competitive landscape, with both established pharmaceutical companies and emerging biotech companies vying for market share, exerts substantial competitive pressure. Supply chain disruptions and potential manufacturing bottlenecks could also negatively impact market growth. Finally, the high cost of treatment is a barrier to access for a significant portion of the population.
Leading Players in the Androgenetic Alopecia Industry Market
- Merck & Co Inc
- Cipla Inc
- Daiichi Sankyo Inc
- HCell Inc
- Sun Pharmaceuticals Industries Ltd
- Concert Pharmaceuticals Inc
- Johnson & Johnson
- Aclaris Therapeutics Inc
- GlaxoSmithKline PLC
Key Developments in Androgenetic Alopecia Industry Sector
- 2023: Approval of new topical treatment by FDA. Significant impact on market share of existing topical treatments.
- 2022: Launch of a new oral medication with improved efficacy and safety profile. Increased competition in the oral medication segment.
- 2021: Major pharmaceutical company acquires a smaller biotech company specializing in hair loss treatments. Consolidation in the industry leads to more concentrated market share.
- 2020: Several clinical trials for novel therapies show promising results. Increased investment in R&D drives innovation.
Strategic Androgenetic Alopecia Industry Market Outlook
The Androgenetic Alopecia industry exhibits strong growth potential driven by factors such as an expanding patient population, rising awareness, and continuous innovation in treatment options. Strategic opportunities abound for companies focusing on developing novel therapeutic approaches, improving drug delivery systems, and catering to unmet patient needs. The market is likely to experience further consolidation through mergers and acquisitions, with larger companies acquiring smaller players with innovative pipeline assets. Companies focusing on personalized medicine and targeted therapies will be well-positioned for future success.
Androgenetic Alopecia Industry Segmentation
-
1. Route of Administration
- 1.1. Oral
- 1.2. Topical
- 1.3. Injectable
-
2. Distribution Channel
- 2.1. Hospitals
- 2.2. Retail Pharmacies
- 2.3. Online Pharmacies
Androgenetic Alopecia Industry Segmentation By Geography
-
1. North America
- 1.1. United States
- 1.2. Canada
- 1.3. Mexico
-
2. Europe
- 2.1. Germany
- 2.2. United Kingdom
- 2.3. France
- 2.4. Italy
- 2.5. Spain
- 2.6. Rest of Europe
-
3. Asia Pacific
- 3.1. China
- 3.2. Japan
- 3.3. India
- 3.4. Australia
- 3.5. South Korea
- 3.6. Rest of Asia Pacific
-
4. Middle East and Africa
- 4.1. GCC
- 4.2. South Africa
- 4.3. Rest of Middle East and Africa
-
5. South America
- 5.1. Brazil
- 5.2. Argentina
- 5.3. Rest of South America
Androgenetic Alopecia Industry REPORT HIGHLIGHTS
| Aspects | Details |
|---|---|
| Study Period | 2019-2033 |
| Base Year | 2024 |
| Estimated Year | 2025 |
| Forecast Period | 2025-2033 |
| Historical Period | 2019-2024 |
| Growth Rate | CAGR of 5.20% from 2019-2033 |
| Segmentation |
|
Table of Contents
- 1. Introduction
- 1.1. Research Scope
- 1.2. Market Segmentation
- 1.3. Research Methodology
- 1.4. Definitions and Assumptions
- 2. Executive Summary
- 2.1. Introduction
- 3. Market Dynamics
- 3.1. Introduction
- 3.2. Market Drivers
- 3.2.1. ; Increasing Prevalence of Alopecia; Increasing R&D Initiatives and New Product Launches and Approvals
- 3.3. Market Restrains
- 3.3.1. ; Patent Expiry of Many Blockbuster Drugs; Side Effects Associated with the Available Hair Loss Treatment Therapies
- 3.4. Market Trends
- 3.4.1. Female is Expected to Hold Largest Share Over the forecast period
- 4. Market Factor Analysis
- 4.1. Porters Five Forces
- 4.2. Supply/Value Chain
- 4.3. PESTEL analysis
- 4.4. Market Entropy
- 4.5. Patent/Trademark Analysis
- 5. Global Androgenetic Alopecia Industry Analysis, Insights and Forecast, 2019-2031
- 5.1. Market Analysis, Insights and Forecast - by Route of Administration
- 5.1.1. Oral
- 5.1.2. Topical
- 5.1.3. Injectable
- 5.2. Market Analysis, Insights and Forecast - by Distribution Channel
- 5.2.1. Hospitals
- 5.2.2. Retail Pharmacies
- 5.2.3. Online Pharmacies
- 5.3. Market Analysis, Insights and Forecast - by Region
- 5.3.1. North America
- 5.3.2. Europe
- 5.3.3. Asia Pacific
- 5.3.4. Middle East and Africa
- 5.3.5. South America
- 5.1. Market Analysis, Insights and Forecast - by Route of Administration
- 6. North America Androgenetic Alopecia Industry Analysis, Insights and Forecast, 2019-2031
- 6.1. Market Analysis, Insights and Forecast - by Route of Administration
- 6.1.1. Oral
- 6.1.2. Topical
- 6.1.3. Injectable
- 6.2. Market Analysis, Insights and Forecast - by Distribution Channel
- 6.2.1. Hospitals
- 6.2.2. Retail Pharmacies
- 6.2.3. Online Pharmacies
- 6.1. Market Analysis, Insights and Forecast - by Route of Administration
- 7. Europe Androgenetic Alopecia Industry Analysis, Insights and Forecast, 2019-2031
- 7.1. Market Analysis, Insights and Forecast - by Route of Administration
- 7.1.1. Oral
- 7.1.2. Topical
- 7.1.3. Injectable
- 7.2. Market Analysis, Insights and Forecast - by Distribution Channel
- 7.2.1. Hospitals
- 7.2.2. Retail Pharmacies
- 7.2.3. Online Pharmacies
- 7.1. Market Analysis, Insights and Forecast - by Route of Administration
- 8. Asia Pacific Androgenetic Alopecia Industry Analysis, Insights and Forecast, 2019-2031
- 8.1. Market Analysis, Insights and Forecast - by Route of Administration
- 8.1.1. Oral
- 8.1.2. Topical
- 8.1.3. Injectable
- 8.2. Market Analysis, Insights and Forecast - by Distribution Channel
- 8.2.1. Hospitals
- 8.2.2. Retail Pharmacies
- 8.2.3. Online Pharmacies
- 8.1. Market Analysis, Insights and Forecast - by Route of Administration
- 9. Middle East and Africa Androgenetic Alopecia Industry Analysis, Insights and Forecast, 2019-2031
- 9.1. Market Analysis, Insights and Forecast - by Route of Administration
- 9.1.1. Oral
- 9.1.2. Topical
- 9.1.3. Injectable
- 9.2. Market Analysis, Insights and Forecast - by Distribution Channel
- 9.2.1. Hospitals
- 9.2.2. Retail Pharmacies
- 9.2.3. Online Pharmacies
- 9.1. Market Analysis, Insights and Forecast - by Route of Administration
- 10. South America Androgenetic Alopecia Industry Analysis, Insights and Forecast, 2019-2031
- 10.1. Market Analysis, Insights and Forecast - by Route of Administration
- 10.1.1. Oral
- 10.1.2. Topical
- 10.1.3. Injectable
- 10.2. Market Analysis, Insights and Forecast - by Distribution Channel
- 10.2.1. Hospitals
- 10.2.2. Retail Pharmacies
- 10.2.3. Online Pharmacies
- 10.1. Market Analysis, Insights and Forecast - by Route of Administration
- 11. North America Androgenetic Alopecia Industry Analysis, Insights and Forecast, 2019-2031
- 11.1. Market Analysis, Insights and Forecast - By Country/Sub-region
- 11.1.1 United States
- 11.1.2 Canada
- 11.1.3 Mexico
- 12. Europe Androgenetic Alopecia Industry Analysis, Insights and Forecast, 2019-2031
- 12.1. Market Analysis, Insights and Forecast - By Country/Sub-region
- 12.1.1 Germany
- 12.1.2 United Kingdom
- 12.1.3 France
- 12.1.4 Italy
- 12.1.5 Spain
- 12.1.6 Rest of Europe
- 13. Asia Pacific Androgenetic Alopecia Industry Analysis, Insights and Forecast, 2019-2031
- 13.1. Market Analysis, Insights and Forecast - By Country/Sub-region
- 13.1.1 China
- 13.1.2 Japan
- 13.1.3 India
- 13.1.4 Australia
- 13.1.5 South Korea
- 13.1.6 Rest of Asia Pacific
- 14. Middle East and Africa Androgenetic Alopecia Industry Analysis, Insights and Forecast, 2019-2031
- 14.1. Market Analysis, Insights and Forecast - By Country/Sub-region
- 14.1.1 GCC
- 14.1.2 South Africa
- 14.1.3 Rest of Middle East and Africa
- 15. South America Androgenetic Alopecia Industry Analysis, Insights and Forecast, 2019-2031
- 15.1. Market Analysis, Insights and Forecast - By Country/Sub-region
- 15.1.1 Brazil
- 15.1.2 Argentina
- 15.1.3 Rest of South America
- 16. Competitive Analysis
- 16.1. Global Market Share Analysis 2024
- 16.2. Company Profiles
- 16.2.1 Merck & Co Inc
- 16.2.1.1. Overview
- 16.2.1.2. Products
- 16.2.1.3. SWOT Analysis
- 16.2.1.4. Recent Developments
- 16.2.1.5. Financials (Based on Availability)
- 16.2.2 Cipla Inc
- 16.2.2.1. Overview
- 16.2.2.2. Products
- 16.2.2.3. SWOT Analysis
- 16.2.2.4. Recent Developments
- 16.2.2.5. Financials (Based on Availability)
- 16.2.3 Daiichi Sankyo Inc
- 16.2.3.1. Overview
- 16.2.3.2. Products
- 16.2.3.3. SWOT Analysis
- 16.2.3.4. Recent Developments
- 16.2.3.5. Financials (Based on Availability)
- 16.2.4 HCell Inc
- 16.2.4.1. Overview
- 16.2.4.2. Products
- 16.2.4.3. SWOT Analysis
- 16.2.4.4. Recent Developments
- 16.2.4.5. Financials (Based on Availability)
- 16.2.5 Sun Pharmaceuticals Industries Ltd*List Not Exhaustive
- 16.2.5.1. Overview
- 16.2.5.2. Products
- 16.2.5.3. SWOT Analysis
- 16.2.5.4. Recent Developments
- 16.2.5.5. Financials (Based on Availability)
- 16.2.6 Concert Pharmaceuticals Inc
- 16.2.6.1. Overview
- 16.2.6.2. Products
- 16.2.6.3. SWOT Analysis
- 16.2.6.4. Recent Developments
- 16.2.6.5. Financials (Based on Availability)
- 16.2.7 Johnson & Johnson
- 16.2.7.1. Overview
- 16.2.7.2. Products
- 16.2.7.3. SWOT Analysis
- 16.2.7.4. Recent Developments
- 16.2.7.5. Financials (Based on Availability)
- 16.2.8 Aclaris Therapeutics Inc
- 16.2.8.1. Overview
- 16.2.8.2. Products
- 16.2.8.3. SWOT Analysis
- 16.2.8.4. Recent Developments
- 16.2.8.5. Financials (Based on Availability)
- 16.2.9 GlaxoSmithKline PLC
- 16.2.9.1. Overview
- 16.2.9.2. Products
- 16.2.9.3. SWOT Analysis
- 16.2.9.4. Recent Developments
- 16.2.9.5. Financials (Based on Availability)
- 16.2.1 Merck & Co Inc
List of Figures
- Figure 1: Global Androgenetic Alopecia Industry Revenue Breakdown (Million, %) by Region 2024 & 2032
- Figure 2: North America Androgenetic Alopecia Industry Revenue (Million), by Country 2024 & 2032
- Figure 3: North America Androgenetic Alopecia Industry Revenue Share (%), by Country 2024 & 2032
- Figure 4: Europe Androgenetic Alopecia Industry Revenue (Million), by Country 2024 & 2032
- Figure 5: Europe Androgenetic Alopecia Industry Revenue Share (%), by Country 2024 & 2032
- Figure 6: Asia Pacific Androgenetic Alopecia Industry Revenue (Million), by Country 2024 & 2032
- Figure 7: Asia Pacific Androgenetic Alopecia Industry Revenue Share (%), by Country 2024 & 2032
- Figure 8: Middle East and Africa Androgenetic Alopecia Industry Revenue (Million), by Country 2024 & 2032
- Figure 9: Middle East and Africa Androgenetic Alopecia Industry Revenue Share (%), by Country 2024 & 2032
- Figure 10: South America Androgenetic Alopecia Industry Revenue (Million), by Country 2024 & 2032
- Figure 11: South America Androgenetic Alopecia Industry Revenue Share (%), by Country 2024 & 2032
- Figure 12: North America Androgenetic Alopecia Industry Revenue (Million), by Route of Administration 2024 & 2032
- Figure 13: North America Androgenetic Alopecia Industry Revenue Share (%), by Route of Administration 2024 & 2032
- Figure 14: North America Androgenetic Alopecia Industry Revenue (Million), by Distribution Channel 2024 & 2032
- Figure 15: North America Androgenetic Alopecia Industry Revenue Share (%), by Distribution Channel 2024 & 2032
- Figure 16: North America Androgenetic Alopecia Industry Revenue (Million), by Country 2024 & 2032
- Figure 17: North America Androgenetic Alopecia Industry Revenue Share (%), by Country 2024 & 2032
- Figure 18: Europe Androgenetic Alopecia Industry Revenue (Million), by Route of Administration 2024 & 2032
- Figure 19: Europe Androgenetic Alopecia Industry Revenue Share (%), by Route of Administration 2024 & 2032
- Figure 20: Europe Androgenetic Alopecia Industry Revenue (Million), by Distribution Channel 2024 & 2032
- Figure 21: Europe Androgenetic Alopecia Industry Revenue Share (%), by Distribution Channel 2024 & 2032
- Figure 22: Europe Androgenetic Alopecia Industry Revenue (Million), by Country 2024 & 2032
- Figure 23: Europe Androgenetic Alopecia Industry Revenue Share (%), by Country 2024 & 2032
- Figure 24: Asia Pacific Androgenetic Alopecia Industry Revenue (Million), by Route of Administration 2024 & 2032
- Figure 25: Asia Pacific Androgenetic Alopecia Industry Revenue Share (%), by Route of Administration 2024 & 2032
- Figure 26: Asia Pacific Androgenetic Alopecia Industry Revenue (Million), by Distribution Channel 2024 & 2032
- Figure 27: Asia Pacific Androgenetic Alopecia Industry Revenue Share (%), by Distribution Channel 2024 & 2032
- Figure 28: Asia Pacific Androgenetic Alopecia Industry Revenue (Million), by Country 2024 & 2032
- Figure 29: Asia Pacific Androgenetic Alopecia Industry Revenue Share (%), by Country 2024 & 2032
- Figure 30: Middle East and Africa Androgenetic Alopecia Industry Revenue (Million), by Route of Administration 2024 & 2032
- Figure 31: Middle East and Africa Androgenetic Alopecia Industry Revenue Share (%), by Route of Administration 2024 & 2032
- Figure 32: Middle East and Africa Androgenetic Alopecia Industry Revenue (Million), by Distribution Channel 2024 & 2032
- Figure 33: Middle East and Africa Androgenetic Alopecia Industry Revenue Share (%), by Distribution Channel 2024 & 2032
- Figure 34: Middle East and Africa Androgenetic Alopecia Industry Revenue (Million), by Country 2024 & 2032
- Figure 35: Middle East and Africa Androgenetic Alopecia Industry Revenue Share (%), by Country 2024 & 2032
- Figure 36: South America Androgenetic Alopecia Industry Revenue (Million), by Route of Administration 2024 & 2032
- Figure 37: South America Androgenetic Alopecia Industry Revenue Share (%), by Route of Administration 2024 & 2032
- Figure 38: South America Androgenetic Alopecia Industry Revenue (Million), by Distribution Channel 2024 & 2032
- Figure 39: South America Androgenetic Alopecia Industry Revenue Share (%), by Distribution Channel 2024 & 2032
- Figure 40: South America Androgenetic Alopecia Industry Revenue (Million), by Country 2024 & 2032
- Figure 41: South America Androgenetic Alopecia Industry Revenue Share (%), by Country 2024 & 2032
List of Tables
- Table 1: Global Androgenetic Alopecia Industry Revenue Million Forecast, by Region 2019 & 2032
- Table 2: Global Androgenetic Alopecia Industry Revenue Million Forecast, by Route of Administration 2019 & 2032
- Table 3: Global Androgenetic Alopecia Industry Revenue Million Forecast, by Distribution Channel 2019 & 2032
- Table 4: Global Androgenetic Alopecia Industry Revenue Million Forecast, by Region 2019 & 2032
- Table 5: Global Androgenetic Alopecia Industry Revenue Million Forecast, by Country 2019 & 2032
- Table 6: United States Androgenetic Alopecia Industry Revenue (Million) Forecast, by Application 2019 & 2032
- Table 7: Canada Androgenetic Alopecia Industry Revenue (Million) Forecast, by Application 2019 & 2032
- Table 8: Mexico Androgenetic Alopecia Industry Revenue (Million) Forecast, by Application 2019 & 2032
- Table 9: Global Androgenetic Alopecia Industry Revenue Million Forecast, by Country 2019 & 2032
- Table 10: Germany Androgenetic Alopecia Industry Revenue (Million) Forecast, by Application 2019 & 2032
- Table 11: United Kingdom Androgenetic Alopecia Industry Revenue (Million) Forecast, by Application 2019 & 2032
- Table 12: France Androgenetic Alopecia Industry Revenue (Million) Forecast, by Application 2019 & 2032
- Table 13: Italy Androgenetic Alopecia Industry Revenue (Million) Forecast, by Application 2019 & 2032
- Table 14: Spain Androgenetic Alopecia Industry Revenue (Million) Forecast, by Application 2019 & 2032
- Table 15: Rest of Europe Androgenetic Alopecia Industry Revenue (Million) Forecast, by Application 2019 & 2032
- Table 16: Global Androgenetic Alopecia Industry Revenue Million Forecast, by Country 2019 & 2032
- Table 17: China Androgenetic Alopecia Industry Revenue (Million) Forecast, by Application 2019 & 2032
- Table 18: Japan Androgenetic Alopecia Industry Revenue (Million) Forecast, by Application 2019 & 2032
- Table 19: India Androgenetic Alopecia Industry Revenue (Million) Forecast, by Application 2019 & 2032
- Table 20: Australia Androgenetic Alopecia Industry Revenue (Million) Forecast, by Application 2019 & 2032
- Table 21: South Korea Androgenetic Alopecia Industry Revenue (Million) Forecast, by Application 2019 & 2032
- Table 22: Rest of Asia Pacific Androgenetic Alopecia Industry Revenue (Million) Forecast, by Application 2019 & 2032
- Table 23: Global Androgenetic Alopecia Industry Revenue Million Forecast, by Country 2019 & 2032
- Table 24: GCC Androgenetic Alopecia Industry Revenue (Million) Forecast, by Application 2019 & 2032
- Table 25: South Africa Androgenetic Alopecia Industry Revenue (Million) Forecast, by Application 2019 & 2032
- Table 26: Rest of Middle East and Africa Androgenetic Alopecia Industry Revenue (Million) Forecast, by Application 2019 & 2032
- Table 27: Global Androgenetic Alopecia Industry Revenue Million Forecast, by Country 2019 & 2032
- Table 28: Brazil Androgenetic Alopecia Industry Revenue (Million) Forecast, by Application 2019 & 2032
- Table 29: Argentina Androgenetic Alopecia Industry Revenue (Million) Forecast, by Application 2019 & 2032
- Table 30: Rest of South America Androgenetic Alopecia Industry Revenue (Million) Forecast, by Application 2019 & 2032
- Table 31: Global Androgenetic Alopecia Industry Revenue Million Forecast, by Route of Administration 2019 & 2032
- Table 32: Global Androgenetic Alopecia Industry Revenue Million Forecast, by Distribution Channel 2019 & 2032
- Table 33: Global Androgenetic Alopecia Industry Revenue Million Forecast, by Country 2019 & 2032
- Table 34: United States Androgenetic Alopecia Industry Revenue (Million) Forecast, by Application 2019 & 2032
- Table 35: Canada Androgenetic Alopecia Industry Revenue (Million) Forecast, by Application 2019 & 2032
- Table 36: Mexico Androgenetic Alopecia Industry Revenue (Million) Forecast, by Application 2019 & 2032
- Table 37: Global Androgenetic Alopecia Industry Revenue Million Forecast, by Route of Administration 2019 & 2032
- Table 38: Global Androgenetic Alopecia Industry Revenue Million Forecast, by Distribution Channel 2019 & 2032
- Table 39: Global Androgenetic Alopecia Industry Revenue Million Forecast, by Country 2019 & 2032
- Table 40: Germany Androgenetic Alopecia Industry Revenue (Million) Forecast, by Application 2019 & 2032
- Table 41: United Kingdom Androgenetic Alopecia Industry Revenue (Million) Forecast, by Application 2019 & 2032
- Table 42: France Androgenetic Alopecia Industry Revenue (Million) Forecast, by Application 2019 & 2032
- Table 43: Italy Androgenetic Alopecia Industry Revenue (Million) Forecast, by Application 2019 & 2032
- Table 44: Spain Androgenetic Alopecia Industry Revenue (Million) Forecast, by Application 2019 & 2032
- Table 45: Rest of Europe Androgenetic Alopecia Industry Revenue (Million) Forecast, by Application 2019 & 2032
- Table 46: Global Androgenetic Alopecia Industry Revenue Million Forecast, by Route of Administration 2019 & 2032
- Table 47: Global Androgenetic Alopecia Industry Revenue Million Forecast, by Distribution Channel 2019 & 2032
- Table 48: Global Androgenetic Alopecia Industry Revenue Million Forecast, by Country 2019 & 2032
- Table 49: China Androgenetic Alopecia Industry Revenue (Million) Forecast, by Application 2019 & 2032
- Table 50: Japan Androgenetic Alopecia Industry Revenue (Million) Forecast, by Application 2019 & 2032
- Table 51: India Androgenetic Alopecia Industry Revenue (Million) Forecast, by Application 2019 & 2032
- Table 52: Australia Androgenetic Alopecia Industry Revenue (Million) Forecast, by Application 2019 & 2032
- Table 53: South Korea Androgenetic Alopecia Industry Revenue (Million) Forecast, by Application 2019 & 2032
- Table 54: Rest of Asia Pacific Androgenetic Alopecia Industry Revenue (Million) Forecast, by Application 2019 & 2032
- Table 55: Global Androgenetic Alopecia Industry Revenue Million Forecast, by Route of Administration 2019 & 2032
- Table 56: Global Androgenetic Alopecia Industry Revenue Million Forecast, by Distribution Channel 2019 & 2032
- Table 57: Global Androgenetic Alopecia Industry Revenue Million Forecast, by Country 2019 & 2032
- Table 58: GCC Androgenetic Alopecia Industry Revenue (Million) Forecast, by Application 2019 & 2032
- Table 59: South Africa Androgenetic Alopecia Industry Revenue (Million) Forecast, by Application 2019 & 2032
- Table 60: Rest of Middle East and Africa Androgenetic Alopecia Industry Revenue (Million) Forecast, by Application 2019 & 2032
- Table 61: Global Androgenetic Alopecia Industry Revenue Million Forecast, by Route of Administration 2019 & 2032
- Table 62: Global Androgenetic Alopecia Industry Revenue Million Forecast, by Distribution Channel 2019 & 2032
- Table 63: Global Androgenetic Alopecia Industry Revenue Million Forecast, by Country 2019 & 2032
- Table 64: Brazil Androgenetic Alopecia Industry Revenue (Million) Forecast, by Application 2019 & 2032
- Table 65: Argentina Androgenetic Alopecia Industry Revenue (Million) Forecast, by Application 2019 & 2032
- Table 66: Rest of South America Androgenetic Alopecia Industry Revenue (Million) Forecast, by Application 2019 & 2032
Frequently Asked Questions
1. What is the projected Compound Annual Growth Rate (CAGR) of the Androgenetic Alopecia Industry?
The projected CAGR is approximately 5.20%.
2. Which companies are prominent players in the Androgenetic Alopecia Industry?
Key companies in the market include Merck & Co Inc, Cipla Inc, Daiichi Sankyo Inc, HCell Inc, Sun Pharmaceuticals Industries Ltd*List Not Exhaustive, Concert Pharmaceuticals Inc, Johnson & Johnson, Aclaris Therapeutics Inc, GlaxoSmithKline PLC.
3. What are the main segments of the Androgenetic Alopecia Industry?
The market segments include Route of Administration, Distribution Channel.
4. Can you provide details about the market size?
The market size is estimated to be USD XX Million as of 2022.
5. What are some drivers contributing to market growth?
; Increasing Prevalence of Alopecia; Increasing R&D Initiatives and New Product Launches and Approvals.
6. What are the notable trends driving market growth?
Female is Expected to Hold Largest Share Over the forecast period.
7. Are there any restraints impacting market growth?
; Patent Expiry of Many Blockbuster Drugs; Side Effects Associated with the Available Hair Loss Treatment Therapies.
8. Can you provide examples of recent developments in the market?
N/A
9. What pricing options are available for accessing the report?
Pricing options include single-user, multi-user, and enterprise licenses priced at USD 4750, USD 5250, and USD 8750 respectively.
10. Is the market size provided in terms of value or volume?
The market size is provided in terms of value, measured in Million.
11. Are there any specific market keywords associated with the report?
Yes, the market keyword associated with the report is "Androgenetic Alopecia Industry," which aids in identifying and referencing the specific market segment covered.
12. How do I determine which pricing option suits my needs best?
The pricing options vary based on user requirements and access needs. Individual users may opt for single-user licenses, while businesses requiring broader access may choose multi-user or enterprise licenses for cost-effective access to the report.
13. Are there any additional resources or data provided in the Androgenetic Alopecia Industry report?
While the report offers comprehensive insights, it's advisable to review the specific contents or supplementary materials provided to ascertain if additional resources or data are available.
14. How can I stay updated on further developments or reports in the Androgenetic Alopecia Industry?
To stay informed about further developments, trends, and reports in the Androgenetic Alopecia Industry, consider subscribing to industry newsletters, following relevant companies and organizations, or regularly checking reputable industry news sources and publications.
Methodology
Step 1 - Identification of Relevant Samples Size from Population Database


Step 2 - Approaches for Defining Global Market Size (Value, Volume* & Price*)

Note*: In applicable scenarios
Step 3 - Data Sources
Primary Research
- Web Analytics
- Survey Reports
- Research Institute
- Latest Research Reports
- Opinion Leaders
Secondary Research
- Annual Reports
- White Paper
- Latest Press Release
- Industry Association
- Paid Database
- Investor Presentations

Step 4 - Data Triangulation
Involves using different sources of information in order to increase the validity of a study
These sources are likely to be stakeholders in a program - participants, other researchers, program staff, other community members, and so on.
Then we put all data in single framework & apply various statistical tools to find out the dynamic on the market.
During the analysis stage, feedback from the stakeholder groups would be compared to determine areas of agreement as well as areas of divergence


