
Key Insights
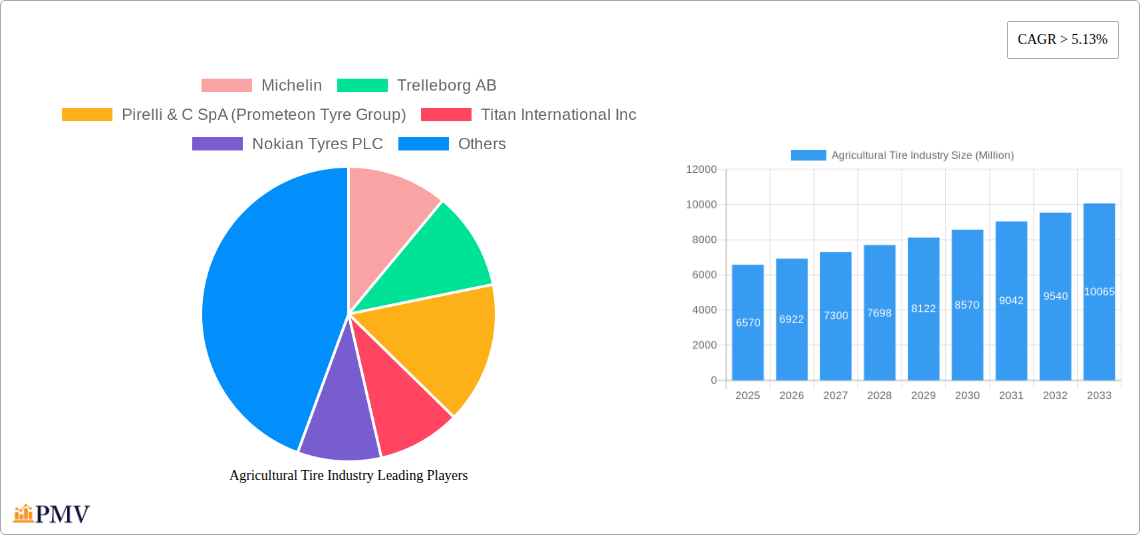
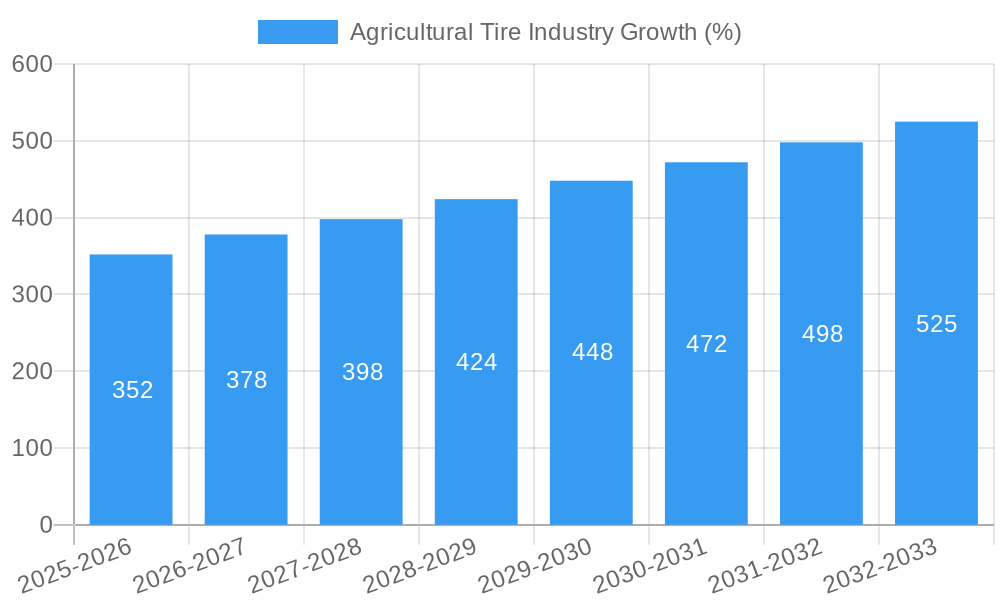
The global agricultural tire market, valued at $6.57 billion in 2025, is projected to experience robust growth, driven by a Compound Annual Growth Rate (CAGR) exceeding 5.13% from 2025 to 2033. This expansion is fueled by several key factors. Increased mechanization in agriculture, particularly in developing economies, is boosting demand for high-performance agricultural tires. The rising adoption of precision farming techniques and the growing need for efficient and durable tires to maximize yields are also significant drivers. Furthermore, favorable government policies promoting agricultural modernization in several regions are stimulating market growth. The market segmentation reveals a strong demand for radial tires, which offer superior performance compared to bias tires, driving their increasing adoption. The replacement/aftermarket segment is also experiencing considerable growth, driven by the need for tire replacements due to wear and tear, and the increasing demand for upgrades to enhance efficiency and performance. Tractors remain the largest application segment, reflecting the widespread use of tractors in various agricultural operations. However, the demand for tires across other application types, such as combine harvesters and sprayers, is also significant and growing, contributing to the overall market expansion. Competitive pressures are evident within the market, with major players such as Michelin, Trelleborg, and Pirelli vying for market share through innovation, strategic partnerships, and expansion into new markets.
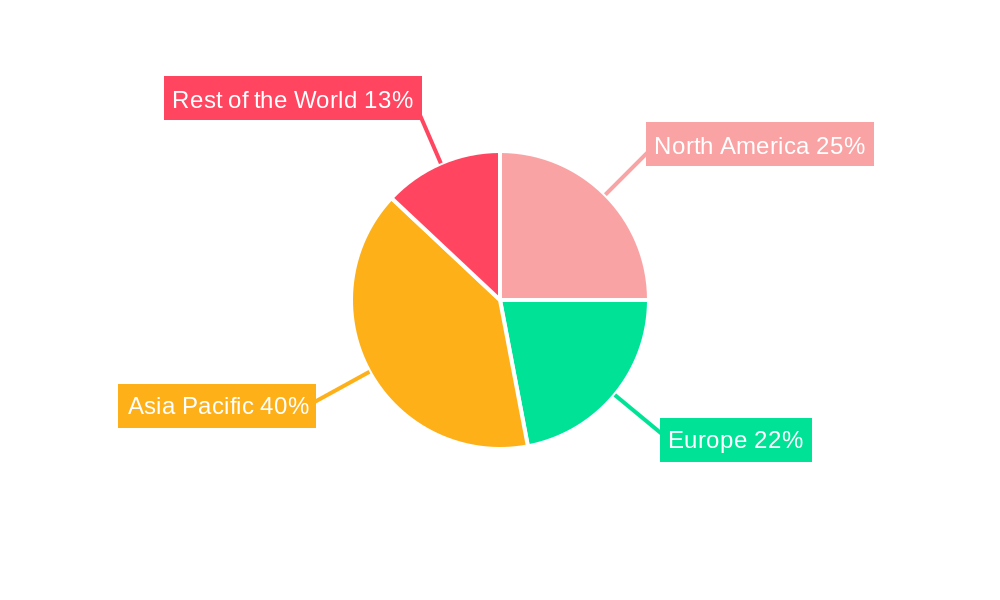
Despite these positive trends, challenges remain for the agricultural tire industry. Fluctuations in raw material prices, particularly natural rubber, can impact production costs and profitability. Also, stringent environmental regulations regarding tire disposal and the impact on the environment are requiring manufacturers to innovate sustainable tire technologies and recycling practices. Regional variations in market growth are expected, with developing economies in Asia-Pacific experiencing relatively faster growth compared to mature markets in North America and Europe. This is driven by factors like the increasing arable land under cultivation and rising investments in agricultural infrastructure. Overall, the agricultural tire market presents a lucrative opportunity for established players and new entrants alike, provided they effectively address the challenges and capitalize on the significant growth potential.
Agricultural Tire Industry Market Report: 2019-2033
This comprehensive report provides a detailed analysis of the global agricultural tire industry, encompassing market size, competitive dynamics, segment-wise growth, and future outlook. The study period covers 2019-2033, with 2025 as the base and estimated year. The report offers actionable insights for industry stakeholders, including manufacturers, suppliers, distributors, and investors. The market is valued at xx Million in 2025 and is projected to reach xx Million by 2033, exhibiting a CAGR of xx% during the forecast period (2025-2033).
Agricultural Tire Industry Market Structure & Competitive Dynamics
The agricultural tire market is moderately concentrated, with several major players holding significant market share. Michelin, Bridgestone Corp, Continental AG, and Trelleborg AB are among the leading companies, collectively accounting for approximately xx% of the global market share in 2025. The industry exhibits a dynamic competitive landscape characterized by intense rivalry, driven by factors such as product innovation, technological advancements, and strategic mergers and acquisitions (M&A).
The innovation ecosystem is robust, with continuous R&D efforts focused on enhancing tire performance, durability, and fuel efficiency. Stringent regulatory frameworks related to environmental sustainability and safety standards also significantly influence market dynamics. Product substitutes, such as alternative traction solutions, pose a limited threat currently, but their future impact warrants monitoring. End-user preferences are evolving towards tires with enhanced features like reduced soil compaction and improved traction.
M&A activities are playing a crucial role in shaping the market structure. For instance, Magna Tyres' acquisition of Industra Ltd in January 2022 significantly strengthened its presence in the Polish market. The total value of M&A deals in the agricultural tire industry during the historical period (2019-2024) is estimated to be xx Million. This highlights the strategic importance of consolidating market share and expanding geographic reach.
- Market Concentration: Moderately concentrated, with top 4 players controlling xx% of the market.
- M&A Activity: Significant M&A deals totaling xx Million during 2019-2024, reflecting strategic consolidation.
- Key Players' Market Share: Michelin (xx%), Bridgestone Corp (xx%), Continental AG (xx%), Trelleborg AB (xx%).
- Innovation Focus: Enhanced tire performance, durability, fuel efficiency, and reduced soil compaction.
Agricultural Tire Industry Industry Trends & Insights
The agricultural tire industry is experiencing robust growth, driven by several key factors. The global rise in agricultural production to meet growing food demands is a primary driver, stimulating the need for high-performance agricultural tires. Technological advancements, such as the development of radial tires with improved traction and load-carrying capacity, are further fueling market expansion. Furthermore, increasing mechanization in agriculture, particularly in developed economies, is significantly boosting demand. The adoption of precision farming techniques also contributes to the increased need for specialized agricultural tires.
Consumer preferences are shifting towards tires that offer enhanced fuel efficiency, reduced soil compaction, and extended lifespan. This trend is compelling manufacturers to invest heavily in R&D to develop innovative tire designs and materials. The competitive landscape is characterized by intense rivalry among major players, leading to continuous product improvements and price adjustments. The market is witnessing a shift towards premium-quality tires, with farmers increasingly prioritizing performance and longevity over price. The CAGR for the agricultural tire market from 2019 to 2024 was xx%, reflecting robust growth during this period. Market penetration of radial tires is steadily increasing, currently estimated at xx% in 2025, reflecting a shift from bias tires.
Dominant Markets & Segments in Agricultural Tire Industry
The North American and European regions currently dominate the global agricultural tire market. These regions benefit from high levels of agricultural mechanization, advanced farming techniques, and a strong economic base supporting investments in agricultural equipment. Within these regions, the tractor segment holds the largest market share in terms of application type, followed by combine harvesters and sprayers. The replacement/aftermarket sales channel holds a larger market share compared to the OEM channel, indicating a significant demand for tire replacements. Radial tires constitute a larger share of the overall market compared to bias tires.
- Leading Regions: North America and Europe.
- Key Drivers (North America): High agricultural mechanization, advanced farming practices, and strong economic conditions.
- Key Drivers (Europe): Similar to North America, with the addition of favorable government policies supporting sustainable agriculture.
- Dominant Application Type: Tractors.
- Dominant Sales Channel: Replacement/Aftermarket.
- Dominant Tire Type: Radial Tires.
Agricultural Tire Industry Product Innovations
Recent years have witnessed significant advancements in agricultural tire technology. Manufacturers are focusing on developing tires with enhanced load-carrying capacity, improved traction, and reduced soil compaction. The introduction of radial tires with advanced tread designs and materials has significantly improved tire performance and longevity. These innovations aim to address the evolving needs of modern agriculture, allowing farmers to achieve increased efficiency and productivity. The market is also witnessing the emergence of smart tires, incorporating technology to monitor tire pressure and condition, leading to improved maintenance and reduced downtime.
Report Segmentation & Scope
This report segments the agricultural tire market based on several key parameters:
Sales Channel Type: OEM and Replacement/Aftermarket. The replacement market is projected to experience faster growth due to the continuous need for tire replacements. Competitive dynamics in this segment are characterized by intense price competition and a focus on building strong distribution networks.
Application Type: Tractors, Combine Harvesters, Sprayers, Trailers, Loaders, and Other Application Types. The tractor segment constitutes the largest market share due to its high volume and diverse needs. Other application types are anticipated to show promising growth driven by increasing diversification within the agricultural sector.
Tire Type: Bias Tires and Radial Tires. Radial tires are experiencing robust growth due to their superior performance characteristics, leading to gradual market share erosion for bias tires. Technological advancements are focused on improving radial tire designs and materials to meet increasingly demanding operational requirements.
Key Drivers of Agricultural Tire Industry Growth
The growth of the agricultural tire industry is propelled by several factors: increasing global food demand, resulting in greater agricultural production; technological advancements in tire design and materials leading to enhanced performance and durability; increasing mechanization in farming; and government support for sustainable agricultural practices. Further, the rise in precision farming technologies is necessitating specialized tires to optimize farming efficiency.
Challenges in the Agricultural Tire Industry Sector
The agricultural tire industry faces several challenges, including fluctuations in raw material prices impacting production costs; volatile demand due to seasonal agricultural cycles; stringent environmental regulations requiring the use of sustainable materials and manufacturing processes; and intense competition from established and emerging players. Supply chain disruptions, particularly concerning raw materials and logistics, can also pose significant challenges to manufacturers.
Leading Players in the Agricultural Tire Industry Market
- Michelin
- Trelleborg AB
- Pirelli & C SpA (Prometeon Tyre Group)
- Titan International Inc
- Nokian Tyres PLC
- Continental AG
- Alliance Tire Group
- Magna Tyres
- Bridgestone Corp
- Balakrishna Industries Limited
- Apollo Tyres
Key Developments in Agricultural Tire Industry Sector
- February 2023: Continental introduced its largest-ever tractor tire, enhancing load capacity, traction, and reducing soil compaction. This significantly impacts the high-horsepower tractor segment.
- May 2022: Apollo Tyres launched a new range of agricultural tires for tractors, improving traction, fuel efficiency, and load-carrying capacity while reducing soil compaction. This improves their competitive positioning.
- January 2022: Magna Tyres acquired Industra Ltd, expanding its global reach, particularly in the Polish market. This strengthens Magna's market share and distribution network.
Strategic Agricultural Tire Industry Market Outlook
The agricultural tire market is poised for sustained growth, driven by increasing agricultural production, technological advancements, and rising demand for high-performance tires. Strategic opportunities lie in developing innovative tire designs that address specific needs, such as reduced soil compaction and improved fuel efficiency. Expansion into emerging markets with significant agricultural potential offers significant growth prospects. Focusing on sustainability and adhering to environmental regulations will also be key to long-term success.
Agricultural Tire Industry Segmentation
-
1. Sales Channel Type
- 1.1. OEM
- 1.2. Replacement/Aftermarket
-
2. Application Type
- 2.1. Tractors
- 2.2. Combine Harvesters
- 2.3. Sprayers
- 2.4. Trailers
- 2.5. Loaders
- 2.6. Other Application Types
-
3. Tire Type
- 3.1. Bias Tires
- 3.2. Radial Tires
Agricultural Tire Industry Segmentation By Geography
-
1. North America
- 1.1. United States
- 1.2. Canada
- 1.3. Rest of North America
-
2. Europe
- 2.1. Germany
- 2.2. United Kingdom
- 2.3. France
- 2.4. Spain
- 2.5. Italy
- 2.6. Rest of Europe
-
3. Asia Pacific
- 3.1. China
- 3.2. Japan
- 3.3. India
- 3.4. South Korea
- 3.5. Rest of Asia Pacific
-
4. Rest of the World
- 4.1. South America
- 4.2. Middle East and Africa
Agricultural Tire Industry REPORT HIGHLIGHTS
| Aspects | Details |
|---|---|
| Study Period | 2019-2033 |
| Base Year | 2024 |
| Estimated Year | 2025 |
| Forecast Period | 2025-2033 |
| Historical Period | 2019-2024 |
| Growth Rate | CAGR of > 5.13% from 2019-2033 |
| Segmentation |
|
Table of Contents
- 1. Introduction
- 1.1. Research Scope
- 1.2. Market Segmentation
- 1.3. Research Methodology
- 1.4. Definitions and Assumptions
- 2. Executive Summary
- 2.1. Introduction
- 3. Market Dynamics
- 3.1. Introduction
- 3.2. Market Drivers
- 3.2.1. Growing Global Population; Others
- 3.3. Market Restrains
- 3.3.1. Fluctuating Commodity Prices; Others
- 3.4. Market Trends
- 3.4.1. The Increasing Demand for Tractors is Driving the Market
- 4. Market Factor Analysis
- 4.1. Porters Five Forces
- 4.2. Supply/Value Chain
- 4.3. PESTEL analysis
- 4.4. Market Entropy
- 4.5. Patent/Trademark Analysis
- 5. Global Agricultural Tire Industry Analysis, Insights and Forecast, 2019-2031
- 5.1. Market Analysis, Insights and Forecast - by Sales Channel Type
- 5.1.1. OEM
- 5.1.2. Replacement/Aftermarket
- 5.2. Market Analysis, Insights and Forecast - by Application Type
- 5.2.1. Tractors
- 5.2.2. Combine Harvesters
- 5.2.3. Sprayers
- 5.2.4. Trailers
- 5.2.5. Loaders
- 5.2.6. Other Application Types
- 5.3. Market Analysis, Insights and Forecast - by Tire Type
- 5.3.1. Bias Tires
- 5.3.2. Radial Tires
- 5.4. Market Analysis, Insights and Forecast - by Region
- 5.4.1. North America
- 5.4.2. Europe
- 5.4.3. Asia Pacific
- 5.4.4. Rest of the World
- 5.1. Market Analysis, Insights and Forecast - by Sales Channel Type
- 6. North America Agricultural Tire Industry Analysis, Insights and Forecast, 2019-2031
- 6.1. Market Analysis, Insights and Forecast - by Sales Channel Type
- 6.1.1. OEM
- 6.1.2. Replacement/Aftermarket
- 6.2. Market Analysis, Insights and Forecast - by Application Type
- 6.2.1. Tractors
- 6.2.2. Combine Harvesters
- 6.2.3. Sprayers
- 6.2.4. Trailers
- 6.2.5. Loaders
- 6.2.6. Other Application Types
- 6.3. Market Analysis, Insights and Forecast - by Tire Type
- 6.3.1. Bias Tires
- 6.3.2. Radial Tires
- 6.1. Market Analysis, Insights and Forecast - by Sales Channel Type
- 7. Europe Agricultural Tire Industry Analysis, Insights and Forecast, 2019-2031
- 7.1. Market Analysis, Insights and Forecast - by Sales Channel Type
- 7.1.1. OEM
- 7.1.2. Replacement/Aftermarket
- 7.2. Market Analysis, Insights and Forecast - by Application Type
- 7.2.1. Tractors
- 7.2.2. Combine Harvesters
- 7.2.3. Sprayers
- 7.2.4. Trailers
- 7.2.5. Loaders
- 7.2.6. Other Application Types
- 7.3. Market Analysis, Insights and Forecast - by Tire Type
- 7.3.1. Bias Tires
- 7.3.2. Radial Tires
- 7.1. Market Analysis, Insights and Forecast - by Sales Channel Type
- 8. Asia Pacific Agricultural Tire Industry Analysis, Insights and Forecast, 2019-2031
- 8.1. Market Analysis, Insights and Forecast - by Sales Channel Type
- 8.1.1. OEM
- 8.1.2. Replacement/Aftermarket
- 8.2. Market Analysis, Insights and Forecast - by Application Type
- 8.2.1. Tractors
- 8.2.2. Combine Harvesters
- 8.2.3. Sprayers
- 8.2.4. Trailers
- 8.2.5. Loaders
- 8.2.6. Other Application Types
- 8.3. Market Analysis, Insights and Forecast - by Tire Type
- 8.3.1. Bias Tires
- 8.3.2. Radial Tires
- 8.1. Market Analysis, Insights and Forecast - by Sales Channel Type
- 9. Rest of the World Agricultural Tire Industry Analysis, Insights and Forecast, 2019-2031
- 9.1. Market Analysis, Insights and Forecast - by Sales Channel Type
- 9.1.1. OEM
- 9.1.2. Replacement/Aftermarket
- 9.2. Market Analysis, Insights and Forecast - by Application Type
- 9.2.1. Tractors
- 9.2.2. Combine Harvesters
- 9.2.3. Sprayers
- 9.2.4. Trailers
- 9.2.5. Loaders
- 9.2.6. Other Application Types
- 9.3. Market Analysis, Insights and Forecast - by Tire Type
- 9.3.1. Bias Tires
- 9.3.2. Radial Tires
- 9.1. Market Analysis, Insights and Forecast - by Sales Channel Type
- 10. North America Agricultural Tire Industry Analysis, Insights and Forecast, 2019-2031
- 10.1. Market Analysis, Insights and Forecast - By Country/Sub-region
- 10.1.1 United States
- 10.1.2 Canada
- 10.1.3 Rest of North America
- 11. Europe Agricultural Tire Industry Analysis, Insights and Forecast, 2019-2031
- 11.1. Market Analysis, Insights and Forecast - By Country/Sub-region
- 11.1.1 Germany
- 11.1.2 United Kingdom
- 11.1.3 France
- 11.1.4 Spain
- 11.1.5 Italy
- 11.1.6 Rest of Europe
- 12. Asia Pacific Agricultural Tire Industry Analysis, Insights and Forecast, 2019-2031
- 12.1. Market Analysis, Insights and Forecast - By Country/Sub-region
- 12.1.1 China
- 12.1.2 Japan
- 12.1.3 India
- 12.1.4 South Korea
- 12.1.5 Rest of Asia Pacific
- 13. Rest of the World Agricultural Tire Industry Analysis, Insights and Forecast, 2019-2031
- 13.1. Market Analysis, Insights and Forecast - By Country/Sub-region
- 13.1.1 South America
- 13.1.2 Middle East and Africa
- 14. Competitive Analysis
- 14.1. Global Market Share Analysis 2024
- 14.2. Company Profiles
- 14.2.1 Michelin
- 14.2.1.1. Overview
- 14.2.1.2. Products
- 14.2.1.3. SWOT Analysis
- 14.2.1.4. Recent Developments
- 14.2.1.5. Financials (Based on Availability)
- 14.2.2 Trelleborg AB
- 14.2.2.1. Overview
- 14.2.2.2. Products
- 14.2.2.3. SWOT Analysis
- 14.2.2.4. Recent Developments
- 14.2.2.5. Financials (Based on Availability)
- 14.2.3 Pirelli & C SpA (Prometeon Tyre Group)
- 14.2.3.1. Overview
- 14.2.3.2. Products
- 14.2.3.3. SWOT Analysis
- 14.2.3.4. Recent Developments
- 14.2.3.5. Financials (Based on Availability)
- 14.2.4 Titan International Inc
- 14.2.4.1. Overview
- 14.2.4.2. Products
- 14.2.4.3. SWOT Analysis
- 14.2.4.4. Recent Developments
- 14.2.4.5. Financials (Based on Availability)
- 14.2.5 Nokian Tyres PLC
- 14.2.5.1. Overview
- 14.2.5.2. Products
- 14.2.5.3. SWOT Analysis
- 14.2.5.4. Recent Developments
- 14.2.5.5. Financials (Based on Availability)
- 14.2.6 Continental AG
- 14.2.6.1. Overview
- 14.2.6.2. Products
- 14.2.6.3. SWOT Analysis
- 14.2.6.4. Recent Developments
- 14.2.6.5. Financials (Based on Availability)
- 14.2.7 Alliance Tire Group
- 14.2.7.1. Overview
- 14.2.7.2. Products
- 14.2.7.3. SWOT Analysis
- 14.2.7.4. Recent Developments
- 14.2.7.5. Financials (Based on Availability)
- 14.2.8 Magna Tyres
- 14.2.8.1. Overview
- 14.2.8.2. Products
- 14.2.8.3. SWOT Analysis
- 14.2.8.4. Recent Developments
- 14.2.8.5. Financials (Based on Availability)
- 14.2.9 Bridgestone Corp
- 14.2.9.1. Overview
- 14.2.9.2. Products
- 14.2.9.3. SWOT Analysis
- 14.2.9.4. Recent Developments
- 14.2.9.5. Financials (Based on Availability)
- 14.2.10 Balakrishna Industries Limited
- 14.2.10.1. Overview
- 14.2.10.2. Products
- 14.2.10.3. SWOT Analysis
- 14.2.10.4. Recent Developments
- 14.2.10.5. Financials (Based on Availability)
- 14.2.11 Apollo Tyres
- 14.2.11.1. Overview
- 14.2.11.2. Products
- 14.2.11.3. SWOT Analysis
- 14.2.11.4. Recent Developments
- 14.2.11.5. Financials (Based on Availability)
- 14.2.1 Michelin
List of Figures
- Figure 1: Global Agricultural Tire Industry Revenue Breakdown (Million, %) by Region 2024 & 2032
- Figure 2: North America Agricultural Tire Industry Revenue (Million), by Country 2024 & 2032
- Figure 3: North America Agricultural Tire Industry Revenue Share (%), by Country 2024 & 2032
- Figure 4: Europe Agricultural Tire Industry Revenue (Million), by Country 2024 & 2032
- Figure 5: Europe Agricultural Tire Industry Revenue Share (%), by Country 2024 & 2032
- Figure 6: Asia Pacific Agricultural Tire Industry Revenue (Million), by Country 2024 & 2032
- Figure 7: Asia Pacific Agricultural Tire Industry Revenue Share (%), by Country 2024 & 2032
- Figure 8: Rest of the World Agricultural Tire Industry Revenue (Million), by Country 2024 & 2032
- Figure 9: Rest of the World Agricultural Tire Industry Revenue Share (%), by Country 2024 & 2032
- Figure 10: North America Agricultural Tire Industry Revenue (Million), by Sales Channel Type 2024 & 2032
- Figure 11: North America Agricultural Tire Industry Revenue Share (%), by Sales Channel Type 2024 & 2032
- Figure 12: North America Agricultural Tire Industry Revenue (Million), by Application Type 2024 & 2032
- Figure 13: North America Agricultural Tire Industry Revenue Share (%), by Application Type 2024 & 2032
- Figure 14: North America Agricultural Tire Industry Revenue (Million), by Tire Type 2024 & 2032
- Figure 15: North America Agricultural Tire Industry Revenue Share (%), by Tire Type 2024 & 2032
- Figure 16: North America Agricultural Tire Industry Revenue (Million), by Country 2024 & 2032
- Figure 17: North America Agricultural Tire Industry Revenue Share (%), by Country 2024 & 2032
- Figure 18: Europe Agricultural Tire Industry Revenue (Million), by Sales Channel Type 2024 & 2032
- Figure 19: Europe Agricultural Tire Industry Revenue Share (%), by Sales Channel Type 2024 & 2032
- Figure 20: Europe Agricultural Tire Industry Revenue (Million), by Application Type 2024 & 2032
- Figure 21: Europe Agricultural Tire Industry Revenue Share (%), by Application Type 2024 & 2032
- Figure 22: Europe Agricultural Tire Industry Revenue (Million), by Tire Type 2024 & 2032
- Figure 23: Europe Agricultural Tire Industry Revenue Share (%), by Tire Type 2024 & 2032
- Figure 24: Europe Agricultural Tire Industry Revenue (Million), by Country 2024 & 2032
- Figure 25: Europe Agricultural Tire Industry Revenue Share (%), by Country 2024 & 2032
- Figure 26: Asia Pacific Agricultural Tire Industry Revenue (Million), by Sales Channel Type 2024 & 2032
- Figure 27: Asia Pacific Agricultural Tire Industry Revenue Share (%), by Sales Channel Type 2024 & 2032
- Figure 28: Asia Pacific Agricultural Tire Industry Revenue (Million), by Application Type 2024 & 2032
- Figure 29: Asia Pacific Agricultural Tire Industry Revenue Share (%), by Application Type 2024 & 2032
- Figure 30: Asia Pacific Agricultural Tire Industry Revenue (Million), by Tire Type 2024 & 2032
- Figure 31: Asia Pacific Agricultural Tire Industry Revenue Share (%), by Tire Type 2024 & 2032
- Figure 32: Asia Pacific Agricultural Tire Industry Revenue (Million), by Country 2024 & 2032
- Figure 33: Asia Pacific Agricultural Tire Industry Revenue Share (%), by Country 2024 & 2032
- Figure 34: Rest of the World Agricultural Tire Industry Revenue (Million), by Sales Channel Type 2024 & 2032
- Figure 35: Rest of the World Agricultural Tire Industry Revenue Share (%), by Sales Channel Type 2024 & 2032
- Figure 36: Rest of the World Agricultural Tire Industry Revenue (Million), by Application Type 2024 & 2032
- Figure 37: Rest of the World Agricultural Tire Industry Revenue Share (%), by Application Type 2024 & 2032
- Figure 38: Rest of the World Agricultural Tire Industry Revenue (Million), by Tire Type 2024 & 2032
- Figure 39: Rest of the World Agricultural Tire Industry Revenue Share (%), by Tire Type 2024 & 2032
- Figure 40: Rest of the World Agricultural Tire Industry Revenue (Million), by Country 2024 & 2032
- Figure 41: Rest of the World Agricultural Tire Industry Revenue Share (%), by Country 2024 & 2032
List of Tables
- Table 1: Global Agricultural Tire Industry Revenue Million Forecast, by Region 2019 & 2032
- Table 2: Global Agricultural Tire Industry Revenue Million Forecast, by Sales Channel Type 2019 & 2032
- Table 3: Global Agricultural Tire Industry Revenue Million Forecast, by Application Type 2019 & 2032
- Table 4: Global Agricultural Tire Industry Revenue Million Forecast, by Tire Type 2019 & 2032
- Table 5: Global Agricultural Tire Industry Revenue Million Forecast, by Region 2019 & 2032
- Table 6: Global Agricultural Tire Industry Revenue Million Forecast, by Country 2019 & 2032
- Table 7: United States Agricultural Tire Industry Revenue (Million) Forecast, by Application 2019 & 2032
- Table 8: Canada Agricultural Tire Industry Revenue (Million) Forecast, by Application 2019 & 2032
- Table 9: Rest of North America Agricultural Tire Industry Revenue (Million) Forecast, by Application 2019 & 2032
- Table 10: Global Agricultural Tire Industry Revenue Million Forecast, by Country 2019 & 2032
- Table 11: Germany Agricultural Tire Industry Revenue (Million) Forecast, by Application 2019 & 2032
- Table 12: United Kingdom Agricultural Tire Industry Revenue (Million) Forecast, by Application 2019 & 2032
- Table 13: France Agricultural Tire Industry Revenue (Million) Forecast, by Application 2019 & 2032
- Table 14: Spain Agricultural Tire Industry Revenue (Million) Forecast, by Application 2019 & 2032
- Table 15: Italy Agricultural Tire Industry Revenue (Million) Forecast, by Application 2019 & 2032
- Table 16: Rest of Europe Agricultural Tire Industry Revenue (Million) Forecast, by Application 2019 & 2032
- Table 17: Global Agricultural Tire Industry Revenue Million Forecast, by Country 2019 & 2032
- Table 18: China Agricultural Tire Industry Revenue (Million) Forecast, by Application 2019 & 2032
- Table 19: Japan Agricultural Tire Industry Revenue (Million) Forecast, by Application 2019 & 2032
- Table 20: India Agricultural Tire Industry Revenue (Million) Forecast, by Application 2019 & 2032
- Table 21: South Korea Agricultural Tire Industry Revenue (Million) Forecast, by Application 2019 & 2032
- Table 22: Rest of Asia Pacific Agricultural Tire Industry Revenue (Million) Forecast, by Application 2019 & 2032
- Table 23: Global Agricultural Tire Industry Revenue Million Forecast, by Country 2019 & 2032
- Table 24: South America Agricultural Tire Industry Revenue (Million) Forecast, by Application 2019 & 2032
- Table 25: Middle East and Africa Agricultural Tire Industry Revenue (Million) Forecast, by Application 2019 & 2032
- Table 26: Global Agricultural Tire Industry Revenue Million Forecast, by Sales Channel Type 2019 & 2032
- Table 27: Global Agricultural Tire Industry Revenue Million Forecast, by Application Type 2019 & 2032
- Table 28: Global Agricultural Tire Industry Revenue Million Forecast, by Tire Type 2019 & 2032
- Table 29: Global Agricultural Tire Industry Revenue Million Forecast, by Country 2019 & 2032
- Table 30: United States Agricultural Tire Industry Revenue (Million) Forecast, by Application 2019 & 2032
- Table 31: Canada Agricultural Tire Industry Revenue (Million) Forecast, by Application 2019 & 2032
- Table 32: Rest of North America Agricultural Tire Industry Revenue (Million) Forecast, by Application 2019 & 2032
- Table 33: Global Agricultural Tire Industry Revenue Million Forecast, by Sales Channel Type 2019 & 2032
- Table 34: Global Agricultural Tire Industry Revenue Million Forecast, by Application Type 2019 & 2032
- Table 35: Global Agricultural Tire Industry Revenue Million Forecast, by Tire Type 2019 & 2032
- Table 36: Global Agricultural Tire Industry Revenue Million Forecast, by Country 2019 & 2032
- Table 37: Germany Agricultural Tire Industry Revenue (Million) Forecast, by Application 2019 & 2032
- Table 38: United Kingdom Agricultural Tire Industry Revenue (Million) Forecast, by Application 2019 & 2032
- Table 39: France Agricultural Tire Industry Revenue (Million) Forecast, by Application 2019 & 2032
- Table 40: Spain Agricultural Tire Industry Revenue (Million) Forecast, by Application 2019 & 2032
- Table 41: Italy Agricultural Tire Industry Revenue (Million) Forecast, by Application 2019 & 2032
- Table 42: Rest of Europe Agricultural Tire Industry Revenue (Million) Forecast, by Application 2019 & 2032
- Table 43: Global Agricultural Tire Industry Revenue Million Forecast, by Sales Channel Type 2019 & 2032
- Table 44: Global Agricultural Tire Industry Revenue Million Forecast, by Application Type 2019 & 2032
- Table 45: Global Agricultural Tire Industry Revenue Million Forecast, by Tire Type 2019 & 2032
- Table 46: Global Agricultural Tire Industry Revenue Million Forecast, by Country 2019 & 2032
- Table 47: China Agricultural Tire Industry Revenue (Million) Forecast, by Application 2019 & 2032
- Table 48: Japan Agricultural Tire Industry Revenue (Million) Forecast, by Application 2019 & 2032
- Table 49: India Agricultural Tire Industry Revenue (Million) Forecast, by Application 2019 & 2032
- Table 50: South Korea Agricultural Tire Industry Revenue (Million) Forecast, by Application 2019 & 2032
- Table 51: Rest of Asia Pacific Agricultural Tire Industry Revenue (Million) Forecast, by Application 2019 & 2032
- Table 52: Global Agricultural Tire Industry Revenue Million Forecast, by Sales Channel Type 2019 & 2032
- Table 53: Global Agricultural Tire Industry Revenue Million Forecast, by Application Type 2019 & 2032
- Table 54: Global Agricultural Tire Industry Revenue Million Forecast, by Tire Type 2019 & 2032
- Table 55: Global Agricultural Tire Industry Revenue Million Forecast, by Country 2019 & 2032
- Table 56: South America Agricultural Tire Industry Revenue (Million) Forecast, by Application 2019 & 2032
- Table 57: Middle East and Africa Agricultural Tire Industry Revenue (Million) Forecast, by Application 2019 & 2032
Frequently Asked Questions
1. What is the projected Compound Annual Growth Rate (CAGR) of the Agricultural Tire Industry?
The projected CAGR is approximately > 5.13%.
2. Which companies are prominent players in the Agricultural Tire Industry?
Key companies in the market include Michelin, Trelleborg AB, Pirelli & C SpA (Prometeon Tyre Group), Titan International Inc, Nokian Tyres PLC, Continental AG, Alliance Tire Group, Magna Tyres, Bridgestone Corp, Balakrishna Industries Limited, Apollo Tyres.
3. What are the main segments of the Agricultural Tire Industry?
The market segments include Sales Channel Type, Application Type, Tire Type.
4. Can you provide details about the market size?
The market size is estimated to be USD 6.57 Million as of 2022.
5. What are some drivers contributing to market growth?
Growing Global Population; Others.
6. What are the notable trends driving market growth?
The Increasing Demand for Tractors is Driving the Market.
7. Are there any restraints impacting market growth?
Fluctuating Commodity Prices; Others.
8. Can you provide examples of recent developments in the market?
February 2023: Continental introduced its largest-ever tractor tire designed for high-horsepower tractors, offering enhanced load-carrying capacity, improved traction, and reduced soil compaction. With its robust construction and advanced tread design, the tire aims to meet the demands of modern agriculture, providing increased efficiency and productivity in the field.
9. What pricing options are available for accessing the report?
Pricing options include single-user, multi-user, and enterprise licenses priced at USD 4750, USD 5250, and USD 8750 respectively.
10. Is the market size provided in terms of value or volume?
The market size is provided in terms of value, measured in Million.
11. Are there any specific market keywords associated with the report?
Yes, the market keyword associated with the report is "Agricultural Tire Industry," which aids in identifying and referencing the specific market segment covered.
12. How do I determine which pricing option suits my needs best?
The pricing options vary based on user requirements and access needs. Individual users may opt for single-user licenses, while businesses requiring broader access may choose multi-user or enterprise licenses for cost-effective access to the report.
13. Are there any additional resources or data provided in the Agricultural Tire Industry report?
While the report offers comprehensive insights, it's advisable to review the specific contents or supplementary materials provided to ascertain if additional resources or data are available.
14. How can I stay updated on further developments or reports in the Agricultural Tire Industry?
To stay informed about further developments, trends, and reports in the Agricultural Tire Industry, consider subscribing to industry newsletters, following relevant companies and organizations, or regularly checking reputable industry news sources and publications.
Methodology
Step 1 - Identification of Relevant Samples Size from Population Database


Step 2 - Approaches for Defining Global Market Size (Value, Volume* & Price*)

Note*: In applicable scenarios
Step 3 - Data Sources
Primary Research
- Web Analytics
- Survey Reports
- Research Institute
- Latest Research Reports
- Opinion Leaders
Secondary Research
- Annual Reports
- White Paper
- Latest Press Release
- Industry Association
- Paid Database
- Investor Presentations

Step 4 - Data Triangulation
Involves using different sources of information in order to increase the validity of a study
These sources are likely to be stakeholders in a program - participants, other researchers, program staff, other community members, and so on.
Then we put all data in single framework & apply various statistical tools to find out the dynamic on the market.
During the analysis stage, feedback from the stakeholder groups would be compared to determine areas of agreement as well as areas of divergence


