Key Insights
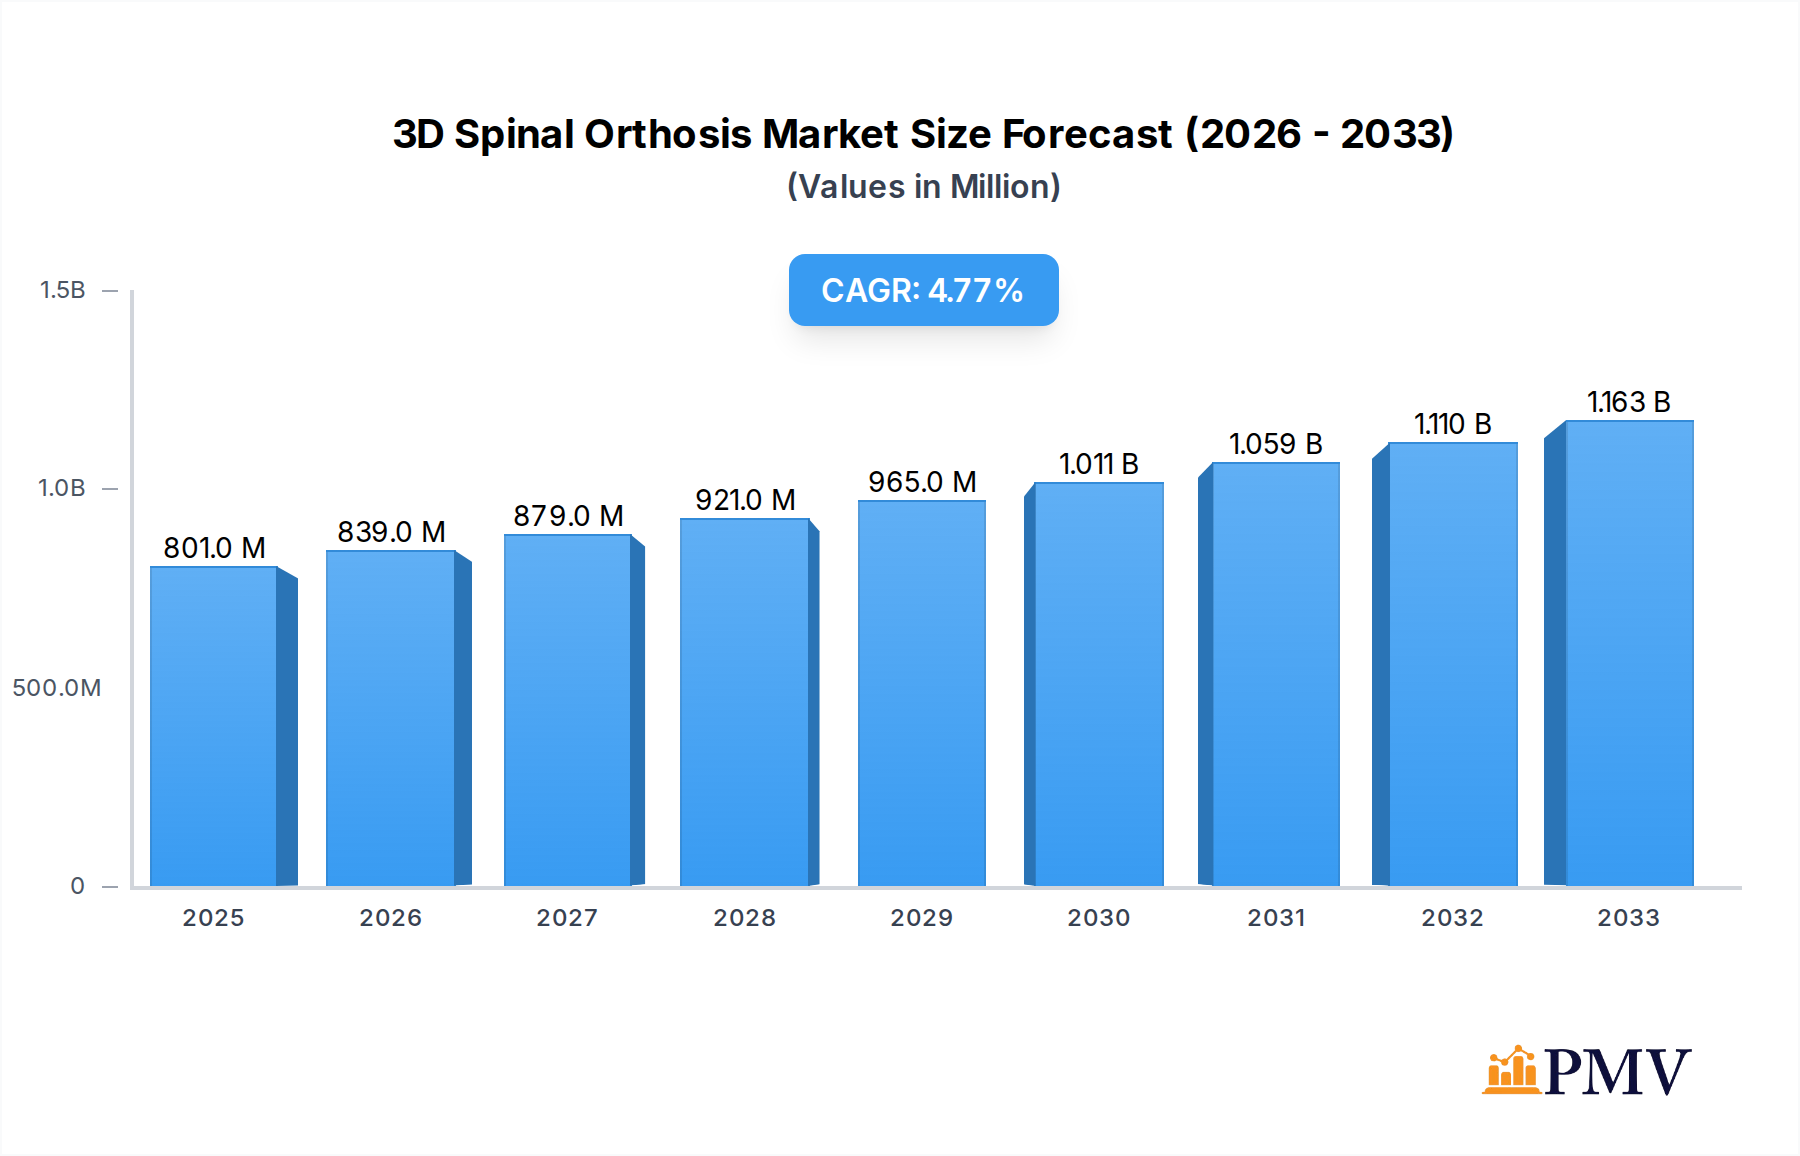
The global 3D Spinal Orthosis market is projected to reach an impressive $801 million by 2025, demonstrating robust growth with a projected Compound Annual Growth Rate (CAGR) of 4.8% during the forecast period of 2025-2033. This significant expansion is primarily fueled by the increasing prevalence of spinal deformities such as scoliosis, coupled with a growing awareness and acceptance of advanced orthotic solutions. The development and adoption of 3D printing technology have revolutionized the manufacturing of spinal orthoses, enabling the creation of highly customized, comfortable, and effective braces. This personalization not only enhances patient compliance but also leads to improved treatment outcomes. The expanding healthcare infrastructure, particularly in emerging economies, and the rising disposable incomes are further contributing to the market's upward trajectory. Key applications for these orthoses are predominantly in hospitals and clinics, addressing a wide range of conditions.

3D Spinal Orthosis Market Size (In Million)
The market is segmented by type into Scoliosis Braces, Thoracolumbosacral Orthosis (TLSO) Braces, Cervicothoracolumbosacral Orthosis (CTLO) Braces, and Lumbosacral Orthosis (LSO) Braces. The increasing incidence of scoliosis, especially among adolescents, is a major driver for the Scoliosis Brace segment. Technological advancements are continuously improving the design and functionality of TLSO and CTLO braces, catering to more complex spinal conditions. While the market shows strong growth potential, certain restraints such as the high cost of advanced orthotic devices and the need for skilled professionals for fitting and management can pose challenges. However, ongoing research and development, aimed at reducing manufacturing costs and improving accessibility, are expected to mitigate these concerns. Leading companies in this sector are investing heavily in innovation and strategic partnerships to expand their market reach and capitalize on the growing demand for specialized spinal orthotic solutions.
3D Spinal Orthosis Company Market Share
This in-depth report provides a thorough examination of the global 3D spinal orthosis market, encompassing market structure, competitive dynamics, industry trends, dominant segments, product innovations, growth drivers, challenges, and future outlook. Leveraging advanced 3D scanning and printing technologies, 3D spinal orthoses offer personalized solutions for a range of spinal conditions. The study period spans from 2019 to 2033, with a base year of 2025 and a forecast period from 2025 to 2033.
3D Spinal Orthosis Market Structure & Competitive Dynamics
The 3D spinal orthosis market is characterized by a dynamic and evolving competitive landscape. While some degree of market concentration exists among established players, the advent of additive manufacturing technologies has fostered innovation and opened doors for new entrants. The market's innovation ecosystem is driven by advancements in material science, biomechanics, and digital design software, enabling the creation of highly customized and effective orthotic solutions. Regulatory frameworks, primarily focused on medical device safety and efficacy, play a crucial role in shaping market entry and product development strategies. Product substitutes, such as traditional custom-made orthoses and surgical interventions, continue to be present, but the personalized fit and advanced functionality of 3D printed solutions are increasingly differentiating them. End-user trends highlight a growing demand for comfort, aesthetics, and improved patient outcomes, pushing manufacturers to invest in user-centric designs. Mergers and acquisitions (M&A) activities are observed as companies seek to expand their technological capabilities, geographical reach, and product portfolios. For instance, key M&A deals in recent years have seen values ranging from XX million to XX million, indicating strategic consolidation. The market share distribution is influenced by the ability of companies to integrate 3D printing technologies into their existing manufacturing processes and distribution networks.
3D Spinal Orthosis Industry Trends & Insights
The 3D spinal orthosis industry is experiencing robust growth, fueled by a confluence of technological advancements, increasing prevalence of spinal deformities, and a growing awareness of personalized healthcare solutions. The estimated Compound Annual Growth Rate (CAGR) for the 3D spinal orthosis market is projected to be in the range of XX% during the forecast period. Key growth drivers include the expanding application of 3D printing in orthopedics, which allows for the creation of highly accurate and patient-specific orthoses that significantly improve comfort and treatment efficacy. This technological disruption is transforming the traditional orthotics manufacturing paradigm, moving towards on-demand, digital fabrication. Consumer preferences are increasingly leaning towards lightweight, breathable, and aesthetically pleasing orthoses, which 3D printing readily facilitates. The rising incidence of spinal conditions such as scoliosis and kyphosis, particularly in pediatric and geriatric populations, further bolsters market demand. Moreover, favorable reimbursement policies and increasing healthcare expenditure in developing economies are contributing to market penetration. The competitive dynamics are shaped by companies that can effectively integrate advanced CAD/CAM software with sophisticated 3D printing technologies, offering a seamless design-to-production workflow. The market penetration of 3D spinal orthoses is expected to rise from approximately XX% in the base year to XX% by the end of the forecast period.
Dominant Markets & Segments in 3D Spinal Orthosis
The 3D spinal orthosis market exhibits distinct dominance across various regions and segments. In terms of geography, North America currently holds a significant market share, driven by advanced healthcare infrastructure, high disposable incomes, and early adoption of innovative medical technologies. The United States leads this region due to substantial investment in research and development for orthopedic devices and a high prevalence of spinal disorders. Key drivers for this dominance include strong government support for medical innovation, a well-established network of specialized clinics and hospitals, and a patient population that actively seeks advanced treatment options.
Within the Application segment, Clinics represent a dominant force, as they are often the primary point of care for patients requiring spinal orthoses. The personalized assessment, fitting, and adjustment services offered by specialized clinics are crucial for optimizing the effectiveness of these devices. Growth in this segment is propelled by the increasing number of orthopedic clinics specializing in scoliosis and spinal rehabilitation.
Analyzing the Types of 3D spinal orthoses, the Scoliosis Brace segment is a major contributor to market revenue. The high prevalence of adolescent idiopathic scoliosis and the growing acceptance of conservative treatment methods like bracing, especially with the enhanced comfort and customization offered by 3D printing, are key factors. The development of dynamic and dynamic progressive scoliosis braces through 3D printing is further enhancing treatment outcomes.
The Thoracolumbosacral Orthosis Brace (TLSO) also holds substantial market presence, catering to a broad range of conditions affecting the thoracic and lumbar spine, including fractures, instabilities, and post-surgical stabilization. The ability of 3D printing to create complex, anatomically precise TLSOs for intricate spinal deformities contributes to its dominance.
The Cervicothoracolumbosacral Orthosis Brace (CTLSO), while representing a smaller segment, is experiencing significant growth due to its application in severe spinal deformities and trauma requiring extensive spinal immobilization. Advancements in lightweight and breathable materials for CTLSOs are enhancing patient compliance.
The Lumbosacral Orthosis Brace (LSO) segment, focusing on the lower back, is also a strong performer, driven by the widespread incidence of lower back pain and degenerative spinal conditions. The personalized fit offered by 3D printed LSOs provides superior comfort and support compared to traditional mass-produced braces.
3D Spinal Orthosis Product Innovations
Product innovation in the 3D spinal orthosis market is primarily centered on enhancing patient comfort, treatment efficacy, and manufacturing efficiency. Manufacturers are leveraging advanced 3D scanning techniques to capture precise patient anatomy, enabling the design of orthoses with superior fit and reduced pressure points. The application of novel biocompatible and lightweight materials, such as flexible filaments and carbon fiber composites, is leading to the development of more comfortable and aesthetically appealing orthoses. These innovations provide a competitive advantage by offering improved patient compliance and better clinical outcomes. The integration of sensor technology into some 3D spinal orthoses also allows for real-time monitoring of patient adherence and spinal alignment, further optimizing treatment.
Report Segmentation & Scope
This comprehensive report segments the 3D spinal orthosis market across key areas for detailed analysis. The Application segment is divided into Hospital and Clinic settings, each offering unique insights into adoption rates and treatment protocols. Hospital settings are analyzed for their role in acute care and post-operative rehabilitation, with an estimated market size of XX million in 2025 and a projected CAGR of XX%. Clinic settings, as primary care providers, are expected to reach XX million by 2025 with a projected CAGR of XX%.
The Types segment is further categorized into Scoliosis Brace, Thoracolumbosacral Orthosis Brace (TLSO), Cervicothoracolumbosacral Orthosis Brace (CTLSO), and Lumbosacral Orthosis Brace (LSO). The Scoliosis Brace segment is estimated at XX million in 2025, with a projected CAGR of XX%. The TLSO segment is valued at XX million in 2025, with a projected CAGR of XX%. The CTLSO segment is anticipated to reach XX million in 2025 with a projected CAGR of XX%. The LSO segment is forecast to be worth XX million in 2025 with a projected CAGR of XX%. This detailed segmentation allows for a granular understanding of market dynamics and growth trajectories within each sub-sector.
Key Drivers of 3D Spinal Orthosis Growth
The growth of the 3D spinal orthosis market is propelled by several interconnected factors. Technological Advancements in 3D scanning, modeling, and printing technologies are at the forefront, enabling the creation of highly precise and personalized orthotic solutions. The development of advanced materials that are lightweight, durable, and biocompatible further enhances product offerings. Increasing Prevalence of Spinal Disorders, including scoliosis, kyphosis, and degenerative disc diseases, creates a sustained demand for effective treatment options. Growing Awareness and Acceptance of 3D Printed Medical Devices among healthcare professionals and patients, coupled with the demonstrated benefits of personalized orthotics in improving comfort and efficacy, are significant drivers. Furthermore, Favorable Reimbursement Policies for custom orthopedic devices in developed economies and a rising trend towards value-based healthcare are contributing to market expansion.
Challenges in the 3D Spinal Orthosis Sector
Despite its promising growth, the 3D spinal orthosis sector faces several challenges. High Initial Investment Costs associated with acquiring advanced 3D printing equipment and sophisticated design software can be a barrier to entry for smaller manufacturers. Regulatory Hurdles and the need for stringent clinical validation and conformity assessments for medical devices can prolong product development timelines and increase compliance costs. Limited Skilled Workforce trained in the nuances of 3D scanning, CAD design for orthotics, and additive manufacturing processes can impact production efficiency. Supply Chain Disruptions for specialized printing materials and components can also affect manufacturing continuity. Finally, Competition from Traditional Orthotic Manufacturing Methods and the established trust in conventional custom-made braces present ongoing competitive pressures.
Leading Players in the 3D Spinal Orthosis Market
- Boston Orthotics & Prosthetics
- Otto Bock
- Ossur
- Proteor
- Breg
- Hanger Clinic
- Blatchford
- Trulife
- Bauerfeind AG
- Deroyal Industries
- DJO Global
- Spinal Technology
Key Developments in 3D Spinal Orthosis Sector
- 2023 Q4: Launch of new lightweight and breathable materials for scoliosis braces, enhancing patient comfort and compliance.
- 2024 Q1: Strategic partnership announced between a leading orthotics provider and a 3D printing technology company to expand production capabilities.
- 2024 Q2: FDA clearance for a novel 3D printed TLSO brace with integrated sensor technology for enhanced monitoring.
- 2024 Q3: Acquisition of a specialized CAD software firm by a major orthotics manufacturer to streamline design processes.
- 2024 Q4: Successful completion of a large-scale clinical trial demonstrating improved outcomes with 3D printed LSO for chronic back pain.
- 2025 Q1: Introduction of advanced AI-driven design algorithms for faster and more accurate custom orthotic creation.
- 2025 Q2: Expansion of manufacturing facilities by a key player to meet increasing global demand for 3D spinal orthoses.
Strategic 3D Spinal Orthosis Market Outlook
The strategic outlook for the 3D spinal orthosis market is exceptionally positive, driven by continuous innovation and expanding applications. Future growth accelerators include the increasing adoption of personalized medicine and patient-centric care models, where 3D printing is a natural fit. The ongoing development of advanced biocompatible and sustainable materials will further enhance the value proposition of these orthoses. Strategic opportunities lie in expanding into emerging markets with growing healthcare infrastructure and a rising demand for advanced medical devices. Furthermore, the integration of digital health platforms for remote patient monitoring and data analysis presents a significant avenue for market expansion and enhanced patient engagement. The market's trajectory points towards greater integration of 3D printing throughout the entire orthotic care pathway, from diagnosis to rehabilitation.
3D Spinal Orthosis Segmentation
-
1. Application
- 1.1. Hospital
- 1.2. Clinic
-
2. Types
- 2.1. Scoliosis Brace
- 2.2. Thoracolumbosacral Orthosis Brace
- 2.3. Cervicothoracolumbosacral Orthosis Brace
- 2.4. Lumbosacral Orthosis Brace
3D Spinal Orthosis Segmentation By Geography
-
1. North America
- 1.1. United States
- 1.2. Canada
- 1.3. Mexico
-
2. South America
- 2.1. Brazil
- 2.2. Argentina
- 2.3. Rest of South America
-
3. Europe
- 3.1. United Kingdom
- 3.2. Germany
- 3.3. France
- 3.4. Italy
- 3.5. Spain
- 3.6. Russia
- 3.7. Benelux
- 3.8. Nordics
- 3.9. Rest of Europe
-
4. Middle East & Africa
- 4.1. Turkey
- 4.2. Israel
- 4.3. GCC
- 4.4. North Africa
- 4.5. South Africa
- 4.6. Rest of Middle East & Africa
-
5. Asia Pacific
- 5.1. China
- 5.2. India
- 5.3. Japan
- 5.4. South Korea
- 5.5. ASEAN
- 5.6. Oceania
- 5.7. Rest of Asia Pacific

3D Spinal Orthosis Regional Market Share
Geographic Coverage of 3D Spinal Orthosis
3D Spinal Orthosis REPORT HIGHLIGHTS
| Aspects | Details |
|---|---|
| Study Period | 2020-2034 |
| Base Year | 2025 |
| Estimated Year | 2026 |
| Forecast Period | 2026-2034 |
| Historical Period | 2020-2025 |
| Growth Rate | CAGR of 3.9% from 2020-2034 |
| Segmentation |
|
Table of Contents
- 1. Introduction
- 1.1. Research Scope
- 1.2. Market Segmentation
- 1.3. Research Objective
- 1.4. Definitions and Assumptions
- 2. Executive Summary
- 2.1. Market Snapshot
- 3. Market Dynamics
- 3.1. Market Drivers
- 3.2. Market Restrains
- 3.3. Market Trends
- 3.4. Market Opportunities
- 4. Market Factor Analysis
- 4.1. Porters Five Forces
- 4.1.1. Bargaining Power of Suppliers
- 4.1.2. Bargaining Power of Buyers
- 4.1.3. Threat of New Entrants
- 4.1.4. Threat of Substitutes
- 4.1.5. Competitive Rivalry
- 4.2. PESTEL analysis
- 4.3. BCG Analysis
- 4.3.1. Stars (High Growth, High Market Share)
- 4.3.2. Cash Cows (Low Growth, High Market Share)
- 4.3.3. Question Mark (High Growth, Low Market Share)
- 4.3.4. Dogs (Low Growth, Low Market Share)
- 4.4. Ansoff Matrix Analysis
- 4.5. Supply Chain Analysis
- 4.6. Regulatory Landscape
- 4.7. Current Market Potential and Opportunity Assessment (TAM–SAM–SOM Framework)
- 4.8. PMV Analyst Note
- 4.1. Porters Five Forces
- 5. Market Analysis, Insights and Forecast 2021-2033
- 5.1. Market Analysis, Insights and Forecast - by Application
- 5.1.1. Hospital
- 5.1.2. Clinic
- 5.2. Market Analysis, Insights and Forecast - by Types
- 5.2.1. Scoliosis Brace
- 5.2.2. Thoracolumbosacral Orthosis Brace
- 5.2.3. Cervicothoracolumbosacral Orthosis Brace
- 5.2.4. Lumbosacral Orthosis Brace
- 5.3. Market Analysis, Insights and Forecast - by Region
- 5.3.1. North America
- 5.3.2. South America
- 5.3.3. Europe
- 5.3.4. Middle East & Africa
- 5.3.5. Asia Pacific
- 5.1. Market Analysis, Insights and Forecast - by Application
- 6. Global 3D Spinal Orthosis Analysis, Insights and Forecast, 2021-2033
- 6.1. Market Analysis, Insights and Forecast - by Application
- 6.1.1. Hospital
- 6.1.2. Clinic
- 6.2. Market Analysis, Insights and Forecast - by Types
- 6.2.1. Scoliosis Brace
- 6.2.2. Thoracolumbosacral Orthosis Brace
- 6.2.3. Cervicothoracolumbosacral Orthosis Brace
- 6.2.4. Lumbosacral Orthosis Brace
- 6.1. Market Analysis, Insights and Forecast - by Application
- 7. North America 3D Spinal Orthosis Analysis, Insights and Forecast, 2020-2032
- 7.1. Market Analysis, Insights and Forecast - by Application
- 7.1.1. Hospital
- 7.1.2. Clinic
- 7.2. Market Analysis, Insights and Forecast - by Types
- 7.2.1. Scoliosis Brace
- 7.2.2. Thoracolumbosacral Orthosis Brace
- 7.2.3. Cervicothoracolumbosacral Orthosis Brace
- 7.2.4. Lumbosacral Orthosis Brace
- 7.1. Market Analysis, Insights and Forecast - by Application
- 8. South America 3D Spinal Orthosis Analysis, Insights and Forecast, 2020-2032
- 8.1. Market Analysis, Insights and Forecast - by Application
- 8.1.1. Hospital
- 8.1.2. Clinic
- 8.2. Market Analysis, Insights and Forecast - by Types
- 8.2.1. Scoliosis Brace
- 8.2.2. Thoracolumbosacral Orthosis Brace
- 8.2.3. Cervicothoracolumbosacral Orthosis Brace
- 8.2.4. Lumbosacral Orthosis Brace
- 8.1. Market Analysis, Insights and Forecast - by Application
- 9. Europe 3D Spinal Orthosis Analysis, Insights and Forecast, 2020-2032
- 9.1. Market Analysis, Insights and Forecast - by Application
- 9.1.1. Hospital
- 9.1.2. Clinic
- 9.2. Market Analysis, Insights and Forecast - by Types
- 9.2.1. Scoliosis Brace
- 9.2.2. Thoracolumbosacral Orthosis Brace
- 9.2.3. Cervicothoracolumbosacral Orthosis Brace
- 9.2.4. Lumbosacral Orthosis Brace
- 9.1. Market Analysis, Insights and Forecast - by Application
- 10. Middle East & Africa 3D Spinal Orthosis Analysis, Insights and Forecast, 2020-2032
- 10.1. Market Analysis, Insights and Forecast - by Application
- 10.1.1. Hospital
- 10.1.2. Clinic
- 10.2. Market Analysis, Insights and Forecast - by Types
- 10.2.1. Scoliosis Brace
- 10.2.2. Thoracolumbosacral Orthosis Brace
- 10.2.3. Cervicothoracolumbosacral Orthosis Brace
- 10.2.4. Lumbosacral Orthosis Brace
- 10.1. Market Analysis, Insights and Forecast - by Application
- 11. Asia Pacific 3D Spinal Orthosis Analysis, Insights and Forecast, 2020-2032
- 11.1. Market Analysis, Insights and Forecast - by Application
- 11.1.1. Hospital
- 11.1.2. Clinic
- 11.2. Market Analysis, Insights and Forecast - by Types
- 11.2.1. Scoliosis Brace
- 11.2.2. Thoracolumbosacral Orthosis Brace
- 11.2.3. Cervicothoracolumbosacral Orthosis Brace
- 11.2.4. Lumbosacral Orthosis Brace
- 11.1. Market Analysis, Insights and Forecast - by Application
- 12. Competitive Analysis
- 12.1. Company Profiles
- 12.1.1 Boston Orthotics & Prosthetics
- 12.1.1.1. Company Overview
- 12.1.1.2. Products
- 12.1.1.3. Company Financials
- 12.1.1.4. SWOT Analysis
- 12.1.2 Otto Bock
- 12.1.2.1. Company Overview
- 12.1.2.2. Products
- 12.1.2.3. Company Financials
- 12.1.2.4. SWOT Analysis
- 12.1.3 Ossur
- 12.1.3.1. Company Overview
- 12.1.3.2. Products
- 12.1.3.3. Company Financials
- 12.1.3.4. SWOT Analysis
- 12.1.4 Proteor
- 12.1.4.1. Company Overview
- 12.1.4.2. Products
- 12.1.4.3. Company Financials
- 12.1.4.4. SWOT Analysis
- 12.1.5 Breg
- 12.1.5.1. Company Overview
- 12.1.5.2. Products
- 12.1.5.3. Company Financials
- 12.1.5.4. SWOT Analysis
- 12.1.6 Hanger Clinic
- 12.1.6.1. Company Overview
- 12.1.6.2. Products
- 12.1.6.3. Company Financials
- 12.1.6.4. SWOT Analysis
- 12.1.7 Blatchford
- 12.1.7.1. Company Overview
- 12.1.7.2. Products
- 12.1.7.3. Company Financials
- 12.1.7.4. SWOT Analysis
- 12.1.8 Trulife
- 12.1.8.1. Company Overview
- 12.1.8.2. Products
- 12.1.8.3. Company Financials
- 12.1.8.4. SWOT Analysis
- 12.1.9 Bauerfeind AG
- 12.1.9.1. Company Overview
- 12.1.9.2. Products
- 12.1.9.3. Company Financials
- 12.1.9.4. SWOT Analysis
- 12.1.10 Deroyal Industries
- 12.1.10.1. Company Overview
- 12.1.10.2. Products
- 12.1.10.3. Company Financials
- 12.1.10.4. SWOT Analysis
- 12.1.11 DJO Global
- 12.1.11.1. Company Overview
- 12.1.11.2. Products
- 12.1.11.3. Company Financials
- 12.1.11.4. SWOT Analysis
- 12.1.12 Spinal Technology
- 12.1.12.1. Company Overview
- 12.1.12.2. Products
- 12.1.12.3. Company Financials
- 12.1.12.4. SWOT Analysis
- 12.1.1 Boston Orthotics & Prosthetics
- 12.2. Market Entropy
- 12.2.1 Company's Key Areas Served
- 12.2.2 Recent Developments
- 12.3. Company Market Share Analysis 2025
- 12.3.1 Top 5 Companies Market Share Analysis
- 12.3.2 Top 3 Companies Market Share Analysis
- 12.4. List of Potential Customers
- 13. Research Methodology
List of Figures
- Figure 1: Global 3D Spinal Orthosis Revenue Breakdown (undefined, %) by Region 2025 & 2033
- Figure 2: North America 3D Spinal Orthosis Revenue (undefined), by Application 2025 & 2033
- Figure 3: North America 3D Spinal Orthosis Revenue Share (%), by Application 2025 & 2033
- Figure 4: North America 3D Spinal Orthosis Revenue (undefined), by Types 2025 & 2033
- Figure 5: North America 3D Spinal Orthosis Revenue Share (%), by Types 2025 & 2033
- Figure 6: North America 3D Spinal Orthosis Revenue (undefined), by Country 2025 & 2033
- Figure 7: North America 3D Spinal Orthosis Revenue Share (%), by Country 2025 & 2033
- Figure 8: South America 3D Spinal Orthosis Revenue (undefined), by Application 2025 & 2033
- Figure 9: South America 3D Spinal Orthosis Revenue Share (%), by Application 2025 & 2033
- Figure 10: South America 3D Spinal Orthosis Revenue (undefined), by Types 2025 & 2033
- Figure 11: South America 3D Spinal Orthosis Revenue Share (%), by Types 2025 & 2033
- Figure 12: South America 3D Spinal Orthosis Revenue (undefined), by Country 2025 & 2033
- Figure 13: South America 3D Spinal Orthosis Revenue Share (%), by Country 2025 & 2033
- Figure 14: Europe 3D Spinal Orthosis Revenue (undefined), by Application 2025 & 2033
- Figure 15: Europe 3D Spinal Orthosis Revenue Share (%), by Application 2025 & 2033
- Figure 16: Europe 3D Spinal Orthosis Revenue (undefined), by Types 2025 & 2033
- Figure 17: Europe 3D Spinal Orthosis Revenue Share (%), by Types 2025 & 2033
- Figure 18: Europe 3D Spinal Orthosis Revenue (undefined), by Country 2025 & 2033
- Figure 19: Europe 3D Spinal Orthosis Revenue Share (%), by Country 2025 & 2033
- Figure 20: Middle East & Africa 3D Spinal Orthosis Revenue (undefined), by Application 2025 & 2033
- Figure 21: Middle East & Africa 3D Spinal Orthosis Revenue Share (%), by Application 2025 & 2033
- Figure 22: Middle East & Africa 3D Spinal Orthosis Revenue (undefined), by Types 2025 & 2033
- Figure 23: Middle East & Africa 3D Spinal Orthosis Revenue Share (%), by Types 2025 & 2033
- Figure 24: Middle East & Africa 3D Spinal Orthosis Revenue (undefined), by Country 2025 & 2033
- Figure 25: Middle East & Africa 3D Spinal Orthosis Revenue Share (%), by Country 2025 & 2033
- Figure 26: Asia Pacific 3D Spinal Orthosis Revenue (undefined), by Application 2025 & 2033
- Figure 27: Asia Pacific 3D Spinal Orthosis Revenue Share (%), by Application 2025 & 2033
- Figure 28: Asia Pacific 3D Spinal Orthosis Revenue (undefined), by Types 2025 & 2033
- Figure 29: Asia Pacific 3D Spinal Orthosis Revenue Share (%), by Types 2025 & 2033
- Figure 30: Asia Pacific 3D Spinal Orthosis Revenue (undefined), by Country 2025 & 2033
- Figure 31: Asia Pacific 3D Spinal Orthosis Revenue Share (%), by Country 2025 & 2033
List of Tables
- Table 1: Global 3D Spinal Orthosis Revenue undefined Forecast, by Application 2020 & 2033
- Table 2: Global 3D Spinal Orthosis Revenue undefined Forecast, by Types 2020 & 2033
- Table 3: Global 3D Spinal Orthosis Revenue undefined Forecast, by Region 2020 & 2033
- Table 4: Global 3D Spinal Orthosis Revenue undefined Forecast, by Application 2020 & 2033
- Table 5: Global 3D Spinal Orthosis Revenue undefined Forecast, by Types 2020 & 2033
- Table 6: Global 3D Spinal Orthosis Revenue undefined Forecast, by Country 2020 & 2033
- Table 7: United States 3D Spinal Orthosis Revenue (undefined) Forecast, by Application 2020 & 2033
- Table 8: Canada 3D Spinal Orthosis Revenue (undefined) Forecast, by Application 2020 & 2033
- Table 9: Mexico 3D Spinal Orthosis Revenue (undefined) Forecast, by Application 2020 & 2033
- Table 10: Global 3D Spinal Orthosis Revenue undefined Forecast, by Application 2020 & 2033
- Table 11: Global 3D Spinal Orthosis Revenue undefined Forecast, by Types 2020 & 2033
- Table 12: Global 3D Spinal Orthosis Revenue undefined Forecast, by Country 2020 & 2033
- Table 13: Brazil 3D Spinal Orthosis Revenue (undefined) Forecast, by Application 2020 & 2033
- Table 14: Argentina 3D Spinal Orthosis Revenue (undefined) Forecast, by Application 2020 & 2033
- Table 15: Rest of South America 3D Spinal Orthosis Revenue (undefined) Forecast, by Application 2020 & 2033
- Table 16: Global 3D Spinal Orthosis Revenue undefined Forecast, by Application 2020 & 2033
- Table 17: Global 3D Spinal Orthosis Revenue undefined Forecast, by Types 2020 & 2033
- Table 18: Global 3D Spinal Orthosis Revenue undefined Forecast, by Country 2020 & 2033
- Table 19: United Kingdom 3D Spinal Orthosis Revenue (undefined) Forecast, by Application 2020 & 2033
- Table 20: Germany 3D Spinal Orthosis Revenue (undefined) Forecast, by Application 2020 & 2033
- Table 21: France 3D Spinal Orthosis Revenue (undefined) Forecast, by Application 2020 & 2033
- Table 22: Italy 3D Spinal Orthosis Revenue (undefined) Forecast, by Application 2020 & 2033
- Table 23: Spain 3D Spinal Orthosis Revenue (undefined) Forecast, by Application 2020 & 2033
- Table 24: Russia 3D Spinal Orthosis Revenue (undefined) Forecast, by Application 2020 & 2033
- Table 25: Benelux 3D Spinal Orthosis Revenue (undefined) Forecast, by Application 2020 & 2033
- Table 26: Nordics 3D Spinal Orthosis Revenue (undefined) Forecast, by Application 2020 & 2033
- Table 27: Rest of Europe 3D Spinal Orthosis Revenue (undefined) Forecast, by Application 2020 & 2033
- Table 28: Global 3D Spinal Orthosis Revenue undefined Forecast, by Application 2020 & 2033
- Table 29: Global 3D Spinal Orthosis Revenue undefined Forecast, by Types 2020 & 2033
- Table 30: Global 3D Spinal Orthosis Revenue undefined Forecast, by Country 2020 & 2033
- Table 31: Turkey 3D Spinal Orthosis Revenue (undefined) Forecast, by Application 2020 & 2033
- Table 32: Israel 3D Spinal Orthosis Revenue (undefined) Forecast, by Application 2020 & 2033
- Table 33: GCC 3D Spinal Orthosis Revenue (undefined) Forecast, by Application 2020 & 2033
- Table 34: North Africa 3D Spinal Orthosis Revenue (undefined) Forecast, by Application 2020 & 2033
- Table 35: South Africa 3D Spinal Orthosis Revenue (undefined) Forecast, by Application 2020 & 2033
- Table 36: Rest of Middle East & Africa 3D Spinal Orthosis Revenue (undefined) Forecast, by Application 2020 & 2033
- Table 37: Global 3D Spinal Orthosis Revenue undefined Forecast, by Application 2020 & 2033
- Table 38: Global 3D Spinal Orthosis Revenue undefined Forecast, by Types 2020 & 2033
- Table 39: Global 3D Spinal Orthosis Revenue undefined Forecast, by Country 2020 & 2033
- Table 40: China 3D Spinal Orthosis Revenue (undefined) Forecast, by Application 2020 & 2033
- Table 41: India 3D Spinal Orthosis Revenue (undefined) Forecast, by Application 2020 & 2033
- Table 42: Japan 3D Spinal Orthosis Revenue (undefined) Forecast, by Application 2020 & 2033
- Table 43: South Korea 3D Spinal Orthosis Revenue (undefined) Forecast, by Application 2020 & 2033
- Table 44: ASEAN 3D Spinal Orthosis Revenue (undefined) Forecast, by Application 2020 & 2033
- Table 45: Oceania 3D Spinal Orthosis Revenue (undefined) Forecast, by Application 2020 & 2033
- Table 46: Rest of Asia Pacific 3D Spinal Orthosis Revenue (undefined) Forecast, by Application 2020 & 2033
Frequently Asked Questions
1. What is the projected Compound Annual Growth Rate (CAGR) of the 3D Spinal Orthosis?
The projected CAGR is approximately 3.9%.
2. Which companies are prominent players in the 3D Spinal Orthosis?
Key companies in the market include Boston Orthotics & Prosthetics, Otto Bock, Ossur, Proteor, Breg, Hanger Clinic, Blatchford, Trulife, Bauerfeind AG, Deroyal Industries, DJO Global, Spinal Technology.
3. What are the main segments of the 3D Spinal Orthosis?
The market segments include Application, Types.
4. Can you provide details about the market size?
The market size is estimated to be USD XXX N/A as of 2022.
5. What are some drivers contributing to market growth?
N/A
6. What are the notable trends driving market growth?
N/A
7. Are there any restraints impacting market growth?
N/A
8. Can you provide examples of recent developments in the market?
N/A
9. What pricing options are available for accessing the report?
Pricing options include single-user, multi-user, and enterprise licenses priced at USD 2900.00, USD 4350.00, and USD 5800.00 respectively.
10. Is the market size provided in terms of value or volume?
The market size is provided in terms of value, measured in N/A.
11. Are there any specific market keywords associated with the report?
Yes, the market keyword associated with the report is "3D Spinal Orthosis," which aids in identifying and referencing the specific market segment covered.
12. How do I determine which pricing option suits my needs best?
The pricing options vary based on user requirements and access needs. Individual users may opt for single-user licenses, while businesses requiring broader access may choose multi-user or enterprise licenses for cost-effective access to the report.
13. Are there any additional resources or data provided in the 3D Spinal Orthosis report?
While the report offers comprehensive insights, it's advisable to review the specific contents or supplementary materials provided to ascertain if additional resources or data are available.
14. How can I stay updated on further developments or reports in the 3D Spinal Orthosis?
To stay informed about further developments, trends, and reports in the 3D Spinal Orthosis, consider subscribing to industry newsletters, following relevant companies and organizations, or regularly checking reputable industry news sources and publications.
Methodology
Step 1 - Identification of Relevant Samples Size from Population Database


Step 2 - Approaches for Defining Global Market Size (Value, Volume* & Price*)

Note*: In applicable scenarios
Step 3 - Data Sources
Primary Research
- Web Analytics
- Survey Reports
- Research Institute
- Latest Research Reports
- Opinion Leaders
Secondary Research
- Annual Reports
- White Paper
- Latest Press Release
- Industry Association
- Paid Database
- Investor Presentations

Step 4 - Data Triangulation
Involves using different sources of information in order to increase the validity of a study
These sources are likely to be stakeholders in a program - participants, other researchers, program staff, other community members, and so on.
Then we put all data in single framework & apply various statistical tools to find out the dynamic on the market.
During the analysis stage, feedback from the stakeholder groups would be compared to determine areas of agreement as well as areas of divergence

