
Key Insights
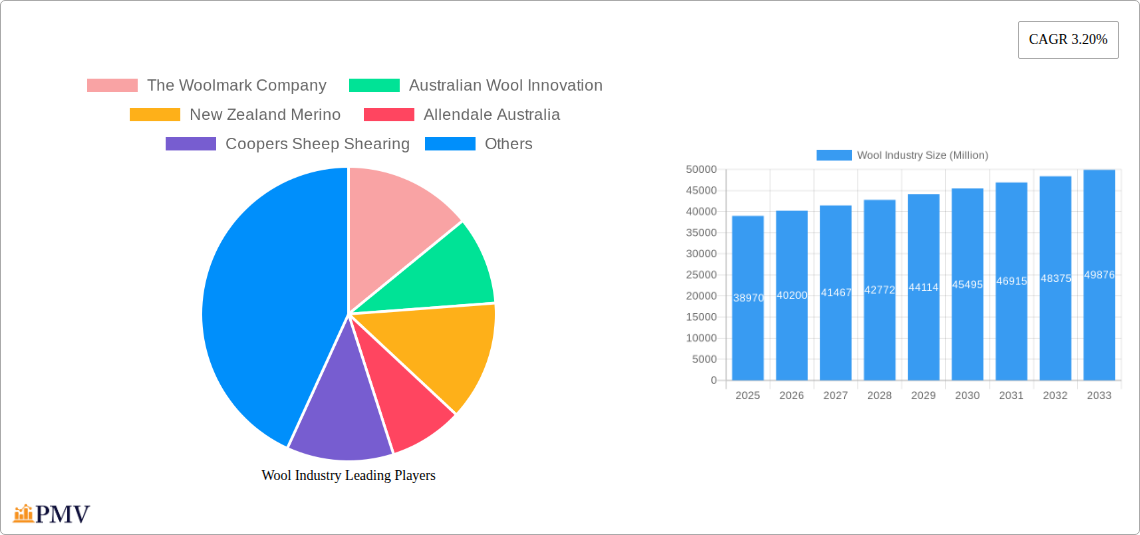
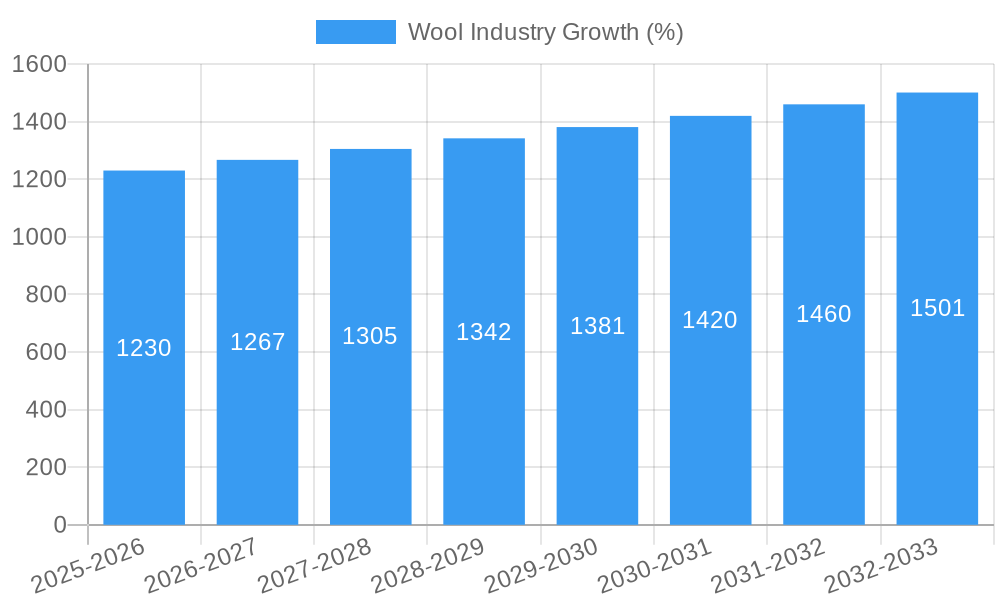
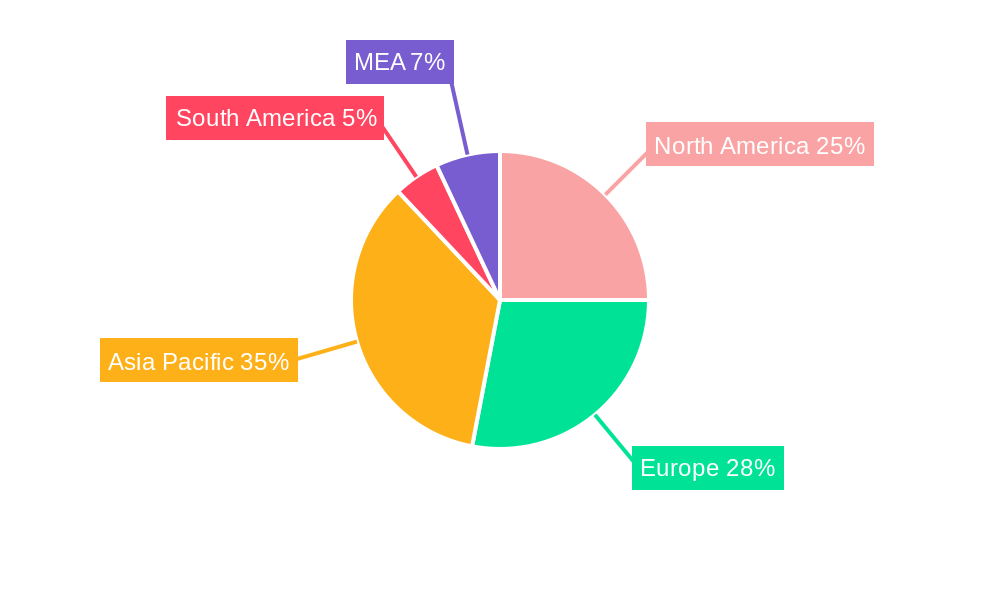
The global wool industry, valued at $38.97 billion in 2025, is projected to experience steady growth, exhibiting a Compound Annual Growth Rate (CAGR) of 3.20% from 2025 to 2033. This growth is driven by several key factors. Increasing demand for sustainable and natural fibers is fueling consumer preference for wool products in the textile and apparel sectors. The inherent properties of wool – breathability, warmth, and moisture-wicking capabilities – make it a desirable material for both clothing and home furnishings. Furthermore, innovations in wool processing and manufacturing are leading to the development of new wool blends and products, expanding market applications. The rise of eco-conscious consumers and brands actively promoting sustainable practices further bolsters the industry's prospects. Growth is particularly strong in the knitwear yarn and woven fabrics product segments, driven by ongoing fashion trends. While potential restraints include price volatility influenced by fluctuating sheep populations and raw material costs, the industry’s adaptability and focus on innovation are mitigating these challenges. Regional growth is expected to be diverse, with North America and Europe maintaining substantial market shares, while Asia-Pacific, particularly China and India, demonstrate significant growth potential due to increasing disposable incomes and rising demand for apparel and textiles.
The industry's segmentation reveals a strong performance across product types (knitwear yarn, woven fabrics) and end-use industries (textile and apparel, home furnishings, industrial applications). Companies like The Woolmark Company, Australian Wool Innovation, and New Zealand Merino play pivotal roles in driving innovation, marketing, and quality standards within the industry, influencing global supply chains and brand perception. The geographical distribution of the market across North America, Europe, Asia-Pacific, South America, and the Middle East and Africa reflects diverse levels of economic development, consumer preferences, and manufacturing capabilities. The forecast period (2025-2033) suggests continued market expansion, driven by the aforementioned factors, despite potential economic uncertainties. Strategic partnerships, advancements in technology, and a persistent focus on sustainability are expected to be critical in shaping the future of the wool industry.
Comprehensive Wool Industry Market Report: 2019-2033
This meticulously researched report provides a comprehensive analysis of the global wool industry, encompassing market size, growth projections, competitive dynamics, and future trends from 2019 to 2033. The study period covers the historical period (2019-2024), the base year (2025), and the forecast period (2025-2033), offering invaluable insights for industry stakeholders. The report leverages extensive primary and secondary research to deliver actionable intelligence for strategic decision-making within the wool market, valued at xx Million in 2025 and projected to reach xx Million by 2033.
Wool Industry Market Structure & Competitive Dynamics
This section analyzes the competitive landscape of the wool industry, examining market concentration, innovation, regulatory aspects, and industry trends. The market is characterized by a blend of large multinational companies and smaller niche players, with significant regional variations in concentration. The Woolmark Company, Australian Wool Innovation, and New Zealand Merino are key players shaping industry standards and driving innovation.
- Market Concentration: The global wool market exhibits moderate concentration, with the top 5 players holding an estimated xx% market share in 2025.
- Innovation Ecosystems: Significant investments in research and development by organizations like Australian Wool Innovation are driving innovations in wool processing, fiber technology, and sustainable practices.
- Regulatory Frameworks: Government regulations regarding animal welfare, environmental sustainability, and trade policies significantly impact the industry. Variations in these regulations across different countries create both opportunities and challenges.
- Product Substitutes: Synthetic fibers, such as polyester and acrylic, represent major substitutes for wool, impacting market share and pricing.
- End-User Trends: Growing demand for sustainable and ethically sourced materials is driving preference for wool in the apparel, home furnishings, and industrial sectors.
- M&A Activities: The last five years have witnessed xx M&A deals in the wool industry, with a total value of approximately xx Million. These deals primarily involved consolidation among smaller players or strategic acquisitions aimed at expanding geographical reach or product portfolios. For instance, the acquisition of [insert example, if available, otherwise remove this sentence] significantly impacted market dynamics.
Wool Industry Industry Trends & Insights
The wool industry is witnessing dynamic shifts driven by evolving consumer preferences, technological advancements, and economic factors. This section delves into these trends, highlighting key drivers and challenges. The global wool market is expected to experience a Compound Annual Growth Rate (CAGR) of xx% during the forecast period (2025-2033). This growth is fueled by increasing demand from emerging economies, a resurgence of interest in natural fibers, and innovations leading to improved wool quality and performance. Market penetration of wool in specific end-use sectors such as high-performance sportswear, exhibiting strong growth at xx%.
- Consumer demand for sustainable and eco-friendly products is a significant driver, fostering the use of recycled wool and promoting transparency in supply chains.
- Technological advancements in fiber processing and manufacturing are enabling the creation of innovative wool fabrics with enhanced properties such as water resistance, breathability, and durability.
- Fluctuations in raw material prices and global economic conditions impact the overall market growth and profitability.
- The competitive landscape is marked by both collaboration and competition, with companies strategically investing in research, marketing, and supply chain optimization.
Dominant Markets & Segments in Wool Industry
This section identifies the leading markets and segments within the wool industry. Based on our analysis, [Region/Country Name - insert most dominant region/country] represents the most dominant market for wool, driven by factors such as strong domestic consumption, favorable economic policies, well-established infrastructure, and robust manufacturing capabilities. Similarly, within the product type segment, [Knitwear/Yarn/Woven Fabrics - insert most dominant segment] shows a high demand due to [reason]. In the end-use industry, the [Textile and Apparel/Home Furnishings/Industrial - insert most dominant segment] sector is the largest consumer of wool.
- Key Drivers for the Dominant Region/Country:
- Favorable government policies supporting the textile and apparel industry.
- Robust infrastructure facilitating efficient production and distribution.
- Strong domestic consumption fueled by a growing middle class.
- Presence of skilled labor and advanced manufacturing technologies.
- Dominant Segment Analysis (Product Type): The dominance of [most dominant segment] is attributed to [detailed analysis of reasons]. This is reflected in [quantifiable data, e.g., market share, sales volume].
- Dominant Segment Analysis (End-Use Industry): The [most dominant end-use sector] shows dominance due to [reasons]. The increasing demand from this sector significantly contributes to the overall market growth, creating significant opportunities for manufacturers and suppliers.
Wool Industry Product Innovations
Recent innovations in the wool industry have focused on enhancing the performance and versatility of wool products. The development of advanced finishing techniques and blends with other fibers has led to the creation of high-performance fabrics that are water-resistant, breathable, and wrinkle-resistant. These innovations expand wool's applications into new sectors, such as sportswear and technical textiles. Technological advancements in fiber spinning and knitting processes are improving efficiency and reducing production costs. These product developments are improving market fit by catering to evolving consumer demands for high-quality, functional, and sustainable textiles.
Report Segmentation & Scope
This report segments the wool industry based on product type (Knitwear, Yarn, Woven Fabrics) and end-use industry (Textile and Apparel, Home Furnishings, Industrial). Each segment's market size, growth projections, and competitive dynamics are analyzed in detail.
Product Type Segmentation: Knitwear is expected to show a CAGR of xx%, yarn at xx%, and woven fabrics at xx% during the forecast period. Competition within each segment varies significantly, with varying levels of innovation and specialization.
End-Use Industry Segmentation: The Textile and Apparel segment is projected to dominate, followed by Home Furnishings and Industrial sectors. Competitive dynamics within each end-use segment are analyzed based on factors such as pricing strategies, brand reputation, and technological capabilities.
Key Drivers of Wool Industry Growth
Several factors contribute to the growth of the wool industry. Technological advancements resulting in improved fiber processing, increased efficiency, and new product applications are major drivers. Favorable government policies supporting the industry, along with increasing consumer preference for natural and sustainable fibers are also crucial. The growing demand from emerging economies, particularly in Asia, presents significant opportunities for expansion. Furthermore, the versatility of wool, enabling its use across diverse sectors like apparel, home furnishings, and industrial applications, boosts industry growth.
Challenges in the Wool Industry Sector
The wool industry faces challenges such as fluctuating raw material prices and intense competition from synthetic fibers. Supply chain complexities and environmental concerns regarding wool production add to the challenges. Regulatory hurdles and fluctuations in global economic conditions also exert significant pressure on profitability and market stability. These factors impact production costs, market access, and overall industry competitiveness.
Leading Players in the Wool Industry Market
- The Woolmark Company
- Australian Wool Innovation
- New Zealand Merino
- Allendale Australia
- Coopers Sheep Shearing
Key Developments in Wool Industry Sector
- 2022-Q4: Launch of a new sustainable wool processing technology by Australian Wool Innovation.
- 2023-Q1: [Insert key development if available]
- 2023-Q3: Merger between [Insert merger detail if available]
Strategic Wool Industry Market Outlook
The future of the wool industry appears promising, driven by increasing consumer demand for sustainable and high-quality textiles. Strategic opportunities lie in further developing sustainable practices throughout the supply chain, exploring new applications for wool in high-growth sectors, and investing in innovation to enhance product performance and versatility. Companies that can effectively address consumer preferences for ethical sourcing and environmentally responsible production will be best positioned for future success. Focusing on collaborations and research and development to address ongoing challenges is crucial for continued growth in this dynamic industry.
Wool Industry Segmentation
- 1. Production Analysis
- 2. Consumption Analysis
- 3. Import Market Analysis (Value & Volume)
- 4. Export Market Analysis (Value & Volume)
- 5. Price Trend Analysis
Wool Industry Segmentation By Geography
-
1. North America
- 1.1. United States
- 1.2. Mexico
-
2. Europe
- 2.1. Germany
- 2.2. Belgium
- 2.3. United Kingdom
- 2.4. Italy
- 2.5. Netherlands
- 2.6. Turkey
-
3. Asia Pacific
- 3.1. China
- 3.2. India
- 3.3. Japan
- 3.4. Australia
- 3.5. New Zealand
-
4. South America
- 4.1. Brazil
- 4.2. Argentina
-
5. Middle East and Africa
- 5.1. UAE
- 5.2. Saudi Arabia
- 5.3. Oman
- 5.4. Morocco
Wool Industry REPORT HIGHLIGHTS
| Aspects | Details |
|---|---|
| Study Period | 2019-2033 |
| Base Year | 2024 |
| Estimated Year | 2025 |
| Forecast Period | 2025-2033 |
| Historical Period | 2019-2024 |
| Growth Rate | CAGR of 3.20% from 2019-2033 |
| Segmentation |
|
Table of Contents
- 1. Introduction
- 1.1. Research Scope
- 1.2. Market Segmentation
- 1.3. Research Methodology
- 1.4. Definitions and Assumptions
- 2. Executive Summary
- 2.1. Introduction
- 3. Market Dynamics
- 3.1. Introduction
- 3.2. Market Drivers
- 3.2.1. ; Awareness About Health Benefits Associated With Pecan Consumption; Wide Application of Pecan
- 3.3. Market Restrains
- 3.3.1. ; Volatility in the Prices; Adverse Weather Conditions Affecting Yield
- 3.4. Market Trends
- 3.4.1. Institutional Initiatives Ensuring the Quality is Driving the Production
- 4. Market Factor Analysis
- 4.1. Porters Five Forces
- 4.2. Supply/Value Chain
- 4.3. PESTEL analysis
- 4.4. Market Entropy
- 4.5. Patent/Trademark Analysis
- 5. Global Wool Industry Analysis, Insights and Forecast, 2019-2031
- 5.1. Market Analysis, Insights and Forecast - by Production Analysis
- 5.2. Market Analysis, Insights and Forecast - by Consumption Analysis
- 5.3. Market Analysis, Insights and Forecast - by Import Market Analysis (Value & Volume)
- 5.4. Market Analysis, Insights and Forecast - by Export Market Analysis (Value & Volume)
- 5.5. Market Analysis, Insights and Forecast - by Price Trend Analysis
- 5.6. Market Analysis, Insights and Forecast - by Region
- 5.6.1. North America
- 5.6.2. Europe
- 5.6.3. Asia Pacific
- 5.6.4. South America
- 5.6.5. Middle East and Africa
- 5.1. Market Analysis, Insights and Forecast - by Production Analysis
- 6. North America Wool Industry Analysis, Insights and Forecast, 2019-2031
- 6.1. Market Analysis, Insights and Forecast - by Production Analysis
- 6.2. Market Analysis, Insights and Forecast - by Consumption Analysis
- 6.3. Market Analysis, Insights and Forecast - by Import Market Analysis (Value & Volume)
- 6.4. Market Analysis, Insights and Forecast - by Export Market Analysis (Value & Volume)
- 6.5. Market Analysis, Insights and Forecast - by Price Trend Analysis
- 6.1. Market Analysis, Insights and Forecast - by Production Analysis
- 7. Europe Wool Industry Analysis, Insights and Forecast, 2019-2031
- 7.1. Market Analysis, Insights and Forecast - by Production Analysis
- 7.2. Market Analysis, Insights and Forecast - by Consumption Analysis
- 7.3. Market Analysis, Insights and Forecast - by Import Market Analysis (Value & Volume)
- 7.4. Market Analysis, Insights and Forecast - by Export Market Analysis (Value & Volume)
- 7.5. Market Analysis, Insights and Forecast - by Price Trend Analysis
- 7.1. Market Analysis, Insights and Forecast - by Production Analysis
- 8. Asia Pacific Wool Industry Analysis, Insights and Forecast, 2019-2031
- 8.1. Market Analysis, Insights and Forecast - by Production Analysis
- 8.2. Market Analysis, Insights and Forecast - by Consumption Analysis
- 8.3. Market Analysis, Insights and Forecast - by Import Market Analysis (Value & Volume)
- 8.4. Market Analysis, Insights and Forecast - by Export Market Analysis (Value & Volume)
- 8.5. Market Analysis, Insights and Forecast - by Price Trend Analysis
- 8.1. Market Analysis, Insights and Forecast - by Production Analysis
- 9. South America Wool Industry Analysis, Insights and Forecast, 2019-2031
- 9.1. Market Analysis, Insights and Forecast - by Production Analysis
- 9.2. Market Analysis, Insights and Forecast - by Consumption Analysis
- 9.3. Market Analysis, Insights and Forecast - by Import Market Analysis (Value & Volume)
- 9.4. Market Analysis, Insights and Forecast - by Export Market Analysis (Value & Volume)
- 9.5. Market Analysis, Insights and Forecast - by Price Trend Analysis
- 9.1. Market Analysis, Insights and Forecast - by Production Analysis
- 10. Middle East and Africa Wool Industry Analysis, Insights and Forecast, 2019-2031
- 10.1. Market Analysis, Insights and Forecast - by Production Analysis
- 10.2. Market Analysis, Insights and Forecast - by Consumption Analysis
- 10.3. Market Analysis, Insights and Forecast - by Import Market Analysis (Value & Volume)
- 10.4. Market Analysis, Insights and Forecast - by Export Market Analysis (Value & Volume)
- 10.5. Market Analysis, Insights and Forecast - by Price Trend Analysis
- 10.1. Market Analysis, Insights and Forecast - by Production Analysis
- 11. North America Wool Industry Analysis, Insights and Forecast, 2019-2031
- 11.1. Market Analysis, Insights and Forecast - By Country/Sub-region
- 11.1.1 United States
- 11.1.2 Canada
- 11.1.3 Mexico
- 12. Europe Wool Industry Analysis, Insights and Forecast, 2019-2031
- 12.1. Market Analysis, Insights and Forecast - By Country/Sub-region
- 12.1.1 Germany
- 12.1.2 United Kingdom
- 12.1.3 France
- 12.1.4 Spain
- 12.1.5 Italy
- 12.1.6 Spain
- 12.1.7 Belgium
- 12.1.8 Netherland
- 12.1.9 Nordics
- 12.1.10 Rest of Europe
- 13. Asia Pacific Wool Industry Analysis, Insights and Forecast, 2019-2031
- 13.1. Market Analysis, Insights and Forecast - By Country/Sub-region
- 13.1.1 China
- 13.1.2 Japan
- 13.1.3 India
- 13.1.4 South Korea
- 13.1.5 Southeast Asia
- 13.1.6 Australia
- 13.1.7 Indonesia
- 13.1.8 Phillipes
- 13.1.9 Singapore
- 13.1.10 Thailandc
- 13.1.11 Rest of Asia Pacific
- 14. South America Wool Industry Analysis, Insights and Forecast, 2019-2031
- 14.1. Market Analysis, Insights and Forecast - By Country/Sub-region
- 14.1.1 Brazil
- 14.1.2 Argentina
- 14.1.3 Peru
- 14.1.4 Chile
- 14.1.5 Colombia
- 14.1.6 Ecuador
- 14.1.7 Venezuela
- 14.1.8 Rest of South America
- 15. MEA Wool Industry Analysis, Insights and Forecast, 2019-2031
- 15.1. Market Analysis, Insights and Forecast - By Country/Sub-region
- 15.1.1 United Arab Emirates
- 15.1.2 Saudi Arabia
- 15.1.3 South Africa
- 15.1.4 Rest of Middle East and Africa
- 16. Competitive Analysis
- 16.1. Global Market Share Analysis 2024
- 16.2. Company Profiles
- 16.2.1 The Woolmark Company
- 16.2.1.1. Overview
- 16.2.1.2. Products
- 16.2.1.3. SWOT Analysis
- 16.2.1.4. Recent Developments
- 16.2.1.5. Financials (Based on Availability)
- 16.2.2 Australian Wool Innovation
- 16.2.2.1. Overview
- 16.2.2.2. Products
- 16.2.2.3. SWOT Analysis
- 16.2.2.4. Recent Developments
- 16.2.2.5. Financials (Based on Availability)
- 16.2.3 New Zealand Merino
- 16.2.3.1. Overview
- 16.2.3.2. Products
- 16.2.3.3. SWOT Analysis
- 16.2.3.4. Recent Developments
- 16.2.3.5. Financials (Based on Availability)
- 16.2.4 Allendale Australia
- 16.2.4.1. Overview
- 16.2.4.2. Products
- 16.2.4.3. SWOT Analysis
- 16.2.4.4. Recent Developments
- 16.2.4.5. Financials (Based on Availability)
- 16.2.5 Coopers Sheep Shearing
- 16.2.5.1. Overview
- 16.2.5.2. Products
- 16.2.5.3. SWOT Analysis
- 16.2.5.4. Recent Developments
- 16.2.5.5. Financials (Based on Availability)
- 16.2.1 The Woolmark Company
List of Figures
- Figure 1: Global Wool Industry Revenue Breakdown (Million, %) by Region 2024 & 2032
- Figure 2: North America Wool Industry Revenue (Million), by Country 2024 & 2032
- Figure 3: North America Wool Industry Revenue Share (%), by Country 2024 & 2032
- Figure 4: Europe Wool Industry Revenue (Million), by Country 2024 & 2032
- Figure 5: Europe Wool Industry Revenue Share (%), by Country 2024 & 2032
- Figure 6: Asia Pacific Wool Industry Revenue (Million), by Country 2024 & 2032
- Figure 7: Asia Pacific Wool Industry Revenue Share (%), by Country 2024 & 2032
- Figure 8: South America Wool Industry Revenue (Million), by Country 2024 & 2032
- Figure 9: South America Wool Industry Revenue Share (%), by Country 2024 & 2032
- Figure 10: MEA Wool Industry Revenue (Million), by Country 2024 & 2032
- Figure 11: MEA Wool Industry Revenue Share (%), by Country 2024 & 2032
- Figure 12: North America Wool Industry Revenue (Million), by Production Analysis 2024 & 2032
- Figure 13: North America Wool Industry Revenue Share (%), by Production Analysis 2024 & 2032
- Figure 14: North America Wool Industry Revenue (Million), by Consumption Analysis 2024 & 2032
- Figure 15: North America Wool Industry Revenue Share (%), by Consumption Analysis 2024 & 2032
- Figure 16: North America Wool Industry Revenue (Million), by Import Market Analysis (Value & Volume) 2024 & 2032
- Figure 17: North America Wool Industry Revenue Share (%), by Import Market Analysis (Value & Volume) 2024 & 2032
- Figure 18: North America Wool Industry Revenue (Million), by Export Market Analysis (Value & Volume) 2024 & 2032
- Figure 19: North America Wool Industry Revenue Share (%), by Export Market Analysis (Value & Volume) 2024 & 2032
- Figure 20: North America Wool Industry Revenue (Million), by Price Trend Analysis 2024 & 2032
- Figure 21: North America Wool Industry Revenue Share (%), by Price Trend Analysis 2024 & 2032
- Figure 22: North America Wool Industry Revenue (Million), by Country 2024 & 2032
- Figure 23: North America Wool Industry Revenue Share (%), by Country 2024 & 2032
- Figure 24: Europe Wool Industry Revenue (Million), by Production Analysis 2024 & 2032
- Figure 25: Europe Wool Industry Revenue Share (%), by Production Analysis 2024 & 2032
- Figure 26: Europe Wool Industry Revenue (Million), by Consumption Analysis 2024 & 2032
- Figure 27: Europe Wool Industry Revenue Share (%), by Consumption Analysis 2024 & 2032
- Figure 28: Europe Wool Industry Revenue (Million), by Import Market Analysis (Value & Volume) 2024 & 2032
- Figure 29: Europe Wool Industry Revenue Share (%), by Import Market Analysis (Value & Volume) 2024 & 2032
- Figure 30: Europe Wool Industry Revenue (Million), by Export Market Analysis (Value & Volume) 2024 & 2032
- Figure 31: Europe Wool Industry Revenue Share (%), by Export Market Analysis (Value & Volume) 2024 & 2032
- Figure 32: Europe Wool Industry Revenue (Million), by Price Trend Analysis 2024 & 2032
- Figure 33: Europe Wool Industry Revenue Share (%), by Price Trend Analysis 2024 & 2032
- Figure 34: Europe Wool Industry Revenue (Million), by Country 2024 & 2032
- Figure 35: Europe Wool Industry Revenue Share (%), by Country 2024 & 2032
- Figure 36: Asia Pacific Wool Industry Revenue (Million), by Production Analysis 2024 & 2032
- Figure 37: Asia Pacific Wool Industry Revenue Share (%), by Production Analysis 2024 & 2032
- Figure 38: Asia Pacific Wool Industry Revenue (Million), by Consumption Analysis 2024 & 2032
- Figure 39: Asia Pacific Wool Industry Revenue Share (%), by Consumption Analysis 2024 & 2032
- Figure 40: Asia Pacific Wool Industry Revenue (Million), by Import Market Analysis (Value & Volume) 2024 & 2032
- Figure 41: Asia Pacific Wool Industry Revenue Share (%), by Import Market Analysis (Value & Volume) 2024 & 2032
- Figure 42: Asia Pacific Wool Industry Revenue (Million), by Export Market Analysis (Value & Volume) 2024 & 2032
- Figure 43: Asia Pacific Wool Industry Revenue Share (%), by Export Market Analysis (Value & Volume) 2024 & 2032
- Figure 44: Asia Pacific Wool Industry Revenue (Million), by Price Trend Analysis 2024 & 2032
- Figure 45: Asia Pacific Wool Industry Revenue Share (%), by Price Trend Analysis 2024 & 2032
- Figure 46: Asia Pacific Wool Industry Revenue (Million), by Country 2024 & 2032
- Figure 47: Asia Pacific Wool Industry Revenue Share (%), by Country 2024 & 2032
- Figure 48: South America Wool Industry Revenue (Million), by Production Analysis 2024 & 2032
- Figure 49: South America Wool Industry Revenue Share (%), by Production Analysis 2024 & 2032
- Figure 50: South America Wool Industry Revenue (Million), by Consumption Analysis 2024 & 2032
- Figure 51: South America Wool Industry Revenue Share (%), by Consumption Analysis 2024 & 2032
- Figure 52: South America Wool Industry Revenue (Million), by Import Market Analysis (Value & Volume) 2024 & 2032
- Figure 53: South America Wool Industry Revenue Share (%), by Import Market Analysis (Value & Volume) 2024 & 2032
- Figure 54: South America Wool Industry Revenue (Million), by Export Market Analysis (Value & Volume) 2024 & 2032
- Figure 55: South America Wool Industry Revenue Share (%), by Export Market Analysis (Value & Volume) 2024 & 2032
- Figure 56: South America Wool Industry Revenue (Million), by Price Trend Analysis 2024 & 2032
- Figure 57: South America Wool Industry Revenue Share (%), by Price Trend Analysis 2024 & 2032
- Figure 58: South America Wool Industry Revenue (Million), by Country 2024 & 2032
- Figure 59: South America Wool Industry Revenue Share (%), by Country 2024 & 2032
- Figure 60: Middle East and Africa Wool Industry Revenue (Million), by Production Analysis 2024 & 2032
- Figure 61: Middle East and Africa Wool Industry Revenue Share (%), by Production Analysis 2024 & 2032
- Figure 62: Middle East and Africa Wool Industry Revenue (Million), by Consumption Analysis 2024 & 2032
- Figure 63: Middle East and Africa Wool Industry Revenue Share (%), by Consumption Analysis 2024 & 2032
- Figure 64: Middle East and Africa Wool Industry Revenue (Million), by Import Market Analysis (Value & Volume) 2024 & 2032
- Figure 65: Middle East and Africa Wool Industry Revenue Share (%), by Import Market Analysis (Value & Volume) 2024 & 2032
- Figure 66: Middle East and Africa Wool Industry Revenue (Million), by Export Market Analysis (Value & Volume) 2024 & 2032
- Figure 67: Middle East and Africa Wool Industry Revenue Share (%), by Export Market Analysis (Value & Volume) 2024 & 2032
- Figure 68: Middle East and Africa Wool Industry Revenue (Million), by Price Trend Analysis 2024 & 2032
- Figure 69: Middle East and Africa Wool Industry Revenue Share (%), by Price Trend Analysis 2024 & 2032
- Figure 70: Middle East and Africa Wool Industry Revenue (Million), by Country 2024 & 2032
- Figure 71: Middle East and Africa Wool Industry Revenue Share (%), by Country 2024 & 2032
List of Tables
- Table 1: Global Wool Industry Revenue Million Forecast, by Region 2019 & 2032
- Table 2: Global Wool Industry Revenue Million Forecast, by Production Analysis 2019 & 2032
- Table 3: Global Wool Industry Revenue Million Forecast, by Consumption Analysis 2019 & 2032
- Table 4: Global Wool Industry Revenue Million Forecast, by Import Market Analysis (Value & Volume) 2019 & 2032
- Table 5: Global Wool Industry Revenue Million Forecast, by Export Market Analysis (Value & Volume) 2019 & 2032
- Table 6: Global Wool Industry Revenue Million Forecast, by Price Trend Analysis 2019 & 2032
- Table 7: Global Wool Industry Revenue Million Forecast, by Region 2019 & 2032
- Table 8: Global Wool Industry Revenue Million Forecast, by Country 2019 & 2032
- Table 9: United States Wool Industry Revenue (Million) Forecast, by Application 2019 & 2032
- Table 10: Canada Wool Industry Revenue (Million) Forecast, by Application 2019 & 2032
- Table 11: Mexico Wool Industry Revenue (Million) Forecast, by Application 2019 & 2032
- Table 12: Global Wool Industry Revenue Million Forecast, by Country 2019 & 2032
- Table 13: Germany Wool Industry Revenue (Million) Forecast, by Application 2019 & 2032
- Table 14: United Kingdom Wool Industry Revenue (Million) Forecast, by Application 2019 & 2032
- Table 15: France Wool Industry Revenue (Million) Forecast, by Application 2019 & 2032
- Table 16: Spain Wool Industry Revenue (Million) Forecast, by Application 2019 & 2032
- Table 17: Italy Wool Industry Revenue (Million) Forecast, by Application 2019 & 2032
- Table 18: Spain Wool Industry Revenue (Million) Forecast, by Application 2019 & 2032
- Table 19: Belgium Wool Industry Revenue (Million) Forecast, by Application 2019 & 2032
- Table 20: Netherland Wool Industry Revenue (Million) Forecast, by Application 2019 & 2032
- Table 21: Nordics Wool Industry Revenue (Million) Forecast, by Application 2019 & 2032
- Table 22: Rest of Europe Wool Industry Revenue (Million) Forecast, by Application 2019 & 2032
- Table 23: Global Wool Industry Revenue Million Forecast, by Country 2019 & 2032
- Table 24: China Wool Industry Revenue (Million) Forecast, by Application 2019 & 2032
- Table 25: Japan Wool Industry Revenue (Million) Forecast, by Application 2019 & 2032
- Table 26: India Wool Industry Revenue (Million) Forecast, by Application 2019 & 2032
- Table 27: South Korea Wool Industry Revenue (Million) Forecast, by Application 2019 & 2032
- Table 28: Southeast Asia Wool Industry Revenue (Million) Forecast, by Application 2019 & 2032
- Table 29: Australia Wool Industry Revenue (Million) Forecast, by Application 2019 & 2032
- Table 30: Indonesia Wool Industry Revenue (Million) Forecast, by Application 2019 & 2032
- Table 31: Phillipes Wool Industry Revenue (Million) Forecast, by Application 2019 & 2032
- Table 32: Singapore Wool Industry Revenue (Million) Forecast, by Application 2019 & 2032
- Table 33: Thailandc Wool Industry Revenue (Million) Forecast, by Application 2019 & 2032
- Table 34: Rest of Asia Pacific Wool Industry Revenue (Million) Forecast, by Application 2019 & 2032
- Table 35: Global Wool Industry Revenue Million Forecast, by Country 2019 & 2032
- Table 36: Brazil Wool Industry Revenue (Million) Forecast, by Application 2019 & 2032
- Table 37: Argentina Wool Industry Revenue (Million) Forecast, by Application 2019 & 2032
- Table 38: Peru Wool Industry Revenue (Million) Forecast, by Application 2019 & 2032
- Table 39: Chile Wool Industry Revenue (Million) Forecast, by Application 2019 & 2032
- Table 40: Colombia Wool Industry Revenue (Million) Forecast, by Application 2019 & 2032
- Table 41: Ecuador Wool Industry Revenue (Million) Forecast, by Application 2019 & 2032
- Table 42: Venezuela Wool Industry Revenue (Million) Forecast, by Application 2019 & 2032
- Table 43: Rest of South America Wool Industry Revenue (Million) Forecast, by Application 2019 & 2032
- Table 44: Global Wool Industry Revenue Million Forecast, by Country 2019 & 2032
- Table 45: United Arab Emirates Wool Industry Revenue (Million) Forecast, by Application 2019 & 2032
- Table 46: Saudi Arabia Wool Industry Revenue (Million) Forecast, by Application 2019 & 2032
- Table 47: South Africa Wool Industry Revenue (Million) Forecast, by Application 2019 & 2032
- Table 48: Rest of Middle East and Africa Wool Industry Revenue (Million) Forecast, by Application 2019 & 2032
- Table 49: Global Wool Industry Revenue Million Forecast, by Production Analysis 2019 & 2032
- Table 50: Global Wool Industry Revenue Million Forecast, by Consumption Analysis 2019 & 2032
- Table 51: Global Wool Industry Revenue Million Forecast, by Import Market Analysis (Value & Volume) 2019 & 2032
- Table 52: Global Wool Industry Revenue Million Forecast, by Export Market Analysis (Value & Volume) 2019 & 2032
- Table 53: Global Wool Industry Revenue Million Forecast, by Price Trend Analysis 2019 & 2032
- Table 54: Global Wool Industry Revenue Million Forecast, by Country 2019 & 2032
- Table 55: United States Wool Industry Revenue (Million) Forecast, by Application 2019 & 2032
- Table 56: Mexico Wool Industry Revenue (Million) Forecast, by Application 2019 & 2032
- Table 57: Global Wool Industry Revenue Million Forecast, by Production Analysis 2019 & 2032
- Table 58: Global Wool Industry Revenue Million Forecast, by Consumption Analysis 2019 & 2032
- Table 59: Global Wool Industry Revenue Million Forecast, by Import Market Analysis (Value & Volume) 2019 & 2032
- Table 60: Global Wool Industry Revenue Million Forecast, by Export Market Analysis (Value & Volume) 2019 & 2032
- Table 61: Global Wool Industry Revenue Million Forecast, by Price Trend Analysis 2019 & 2032
- Table 62: Global Wool Industry Revenue Million Forecast, by Country 2019 & 2032
- Table 63: Germany Wool Industry Revenue (Million) Forecast, by Application 2019 & 2032
- Table 64: Belgium Wool Industry Revenue (Million) Forecast, by Application 2019 & 2032
- Table 65: United Kingdom Wool Industry Revenue (Million) Forecast, by Application 2019 & 2032
- Table 66: Italy Wool Industry Revenue (Million) Forecast, by Application 2019 & 2032
- Table 67: Netherlands Wool Industry Revenue (Million) Forecast, by Application 2019 & 2032
- Table 68: Turkey Wool Industry Revenue (Million) Forecast, by Application 2019 & 2032
- Table 69: Global Wool Industry Revenue Million Forecast, by Production Analysis 2019 & 2032
- Table 70: Global Wool Industry Revenue Million Forecast, by Consumption Analysis 2019 & 2032
- Table 71: Global Wool Industry Revenue Million Forecast, by Import Market Analysis (Value & Volume) 2019 & 2032
- Table 72: Global Wool Industry Revenue Million Forecast, by Export Market Analysis (Value & Volume) 2019 & 2032
- Table 73: Global Wool Industry Revenue Million Forecast, by Price Trend Analysis 2019 & 2032
- Table 74: Global Wool Industry Revenue Million Forecast, by Country 2019 & 2032
- Table 75: China Wool Industry Revenue (Million) Forecast, by Application 2019 & 2032
- Table 76: India Wool Industry Revenue (Million) Forecast, by Application 2019 & 2032
- Table 77: Japan Wool Industry Revenue (Million) Forecast, by Application 2019 & 2032
- Table 78: Australia Wool Industry Revenue (Million) Forecast, by Application 2019 & 2032
- Table 79: New Zealand Wool Industry Revenue (Million) Forecast, by Application 2019 & 2032
- Table 80: Global Wool Industry Revenue Million Forecast, by Production Analysis 2019 & 2032
- Table 81: Global Wool Industry Revenue Million Forecast, by Consumption Analysis 2019 & 2032
- Table 82: Global Wool Industry Revenue Million Forecast, by Import Market Analysis (Value & Volume) 2019 & 2032
- Table 83: Global Wool Industry Revenue Million Forecast, by Export Market Analysis (Value & Volume) 2019 & 2032
- Table 84: Global Wool Industry Revenue Million Forecast, by Price Trend Analysis 2019 & 2032
- Table 85: Global Wool Industry Revenue Million Forecast, by Country 2019 & 2032
- Table 86: Brazil Wool Industry Revenue (Million) Forecast, by Application 2019 & 2032
- Table 87: Argentina Wool Industry Revenue (Million) Forecast, by Application 2019 & 2032
- Table 88: Global Wool Industry Revenue Million Forecast, by Production Analysis 2019 & 2032
- Table 89: Global Wool Industry Revenue Million Forecast, by Consumption Analysis 2019 & 2032
- Table 90: Global Wool Industry Revenue Million Forecast, by Import Market Analysis (Value & Volume) 2019 & 2032
- Table 91: Global Wool Industry Revenue Million Forecast, by Export Market Analysis (Value & Volume) 2019 & 2032
- Table 92: Global Wool Industry Revenue Million Forecast, by Price Trend Analysis 2019 & 2032
- Table 93: Global Wool Industry Revenue Million Forecast, by Country 2019 & 2032
- Table 94: UAE Wool Industry Revenue (Million) Forecast, by Application 2019 & 2032
- Table 95: Saudi Arabia Wool Industry Revenue (Million) Forecast, by Application 2019 & 2032
- Table 96: Oman Wool Industry Revenue (Million) Forecast, by Application 2019 & 2032
- Table 97: Morocco Wool Industry Revenue (Million) Forecast, by Application 2019 & 2032
Frequently Asked Questions
1. What is the projected Compound Annual Growth Rate (CAGR) of the Wool Industry?
The projected CAGR is approximately 3.20%.
2. Which companies are prominent players in the Wool Industry?
Key companies in the market include The Woolmark Company , Australian Wool Innovation , New Zealand Merino , Allendale Australia , Coopers Sheep Shearing.
3. What are the main segments of the Wool Industry?
The market segments include Production Analysis, Consumption Analysis, Import Market Analysis (Value & Volume), Export Market Analysis (Value & Volume), Price Trend Analysis.
4. Can you provide details about the market size?
The market size is estimated to be USD 38.97 Million as of 2022.
5. What are some drivers contributing to market growth?
; Awareness About Health Benefits Associated With Pecan Consumption; Wide Application of Pecan.
6. What are the notable trends driving market growth?
Institutional Initiatives Ensuring the Quality is Driving the Production.
7. Are there any restraints impacting market growth?
; Volatility in the Prices; Adverse Weather Conditions Affecting Yield.
8. Can you provide examples of recent developments in the market?
N/A
9. What pricing options are available for accessing the report?
Pricing options include single-user, multi-user, and enterprise licenses priced at USD 4750, USD 5250, and USD 8750 respectively.
10. Is the market size provided in terms of value or volume?
The market size is provided in terms of value, measured in Million.
11. Are there any specific market keywords associated with the report?
Yes, the market keyword associated with the report is "Wool Industry," which aids in identifying and referencing the specific market segment covered.
12. How do I determine which pricing option suits my needs best?
The pricing options vary based on user requirements and access needs. Individual users may opt for single-user licenses, while businesses requiring broader access may choose multi-user or enterprise licenses for cost-effective access to the report.
13. Are there any additional resources or data provided in the Wool Industry report?
While the report offers comprehensive insights, it's advisable to review the specific contents or supplementary materials provided to ascertain if additional resources or data are available.
14. How can I stay updated on further developments or reports in the Wool Industry?
To stay informed about further developments, trends, and reports in the Wool Industry, consider subscribing to industry newsletters, following relevant companies and organizations, or regularly checking reputable industry news sources and publications.
Methodology
Step 1 - Identification of Relevant Samples Size from Population Database


Step 2 - Approaches for Defining Global Market Size (Value, Volume* & Price*)

Note*: In applicable scenarios
Step 3 - Data Sources
Primary Research
- Web Analytics
- Survey Reports
- Research Institute
- Latest Research Reports
- Opinion Leaders
Secondary Research
- Annual Reports
- White Paper
- Latest Press Release
- Industry Association
- Paid Database
- Investor Presentations

Step 4 - Data Triangulation
Involves using different sources of information in order to increase the validity of a study
These sources are likely to be stakeholders in a program - participants, other researchers, program staff, other community members, and so on.
Then we put all data in single framework & apply various statistical tools to find out the dynamic on the market.
During the analysis stage, feedback from the stakeholder groups would be compared to determine areas of agreement as well as areas of divergence


