
Key Insights
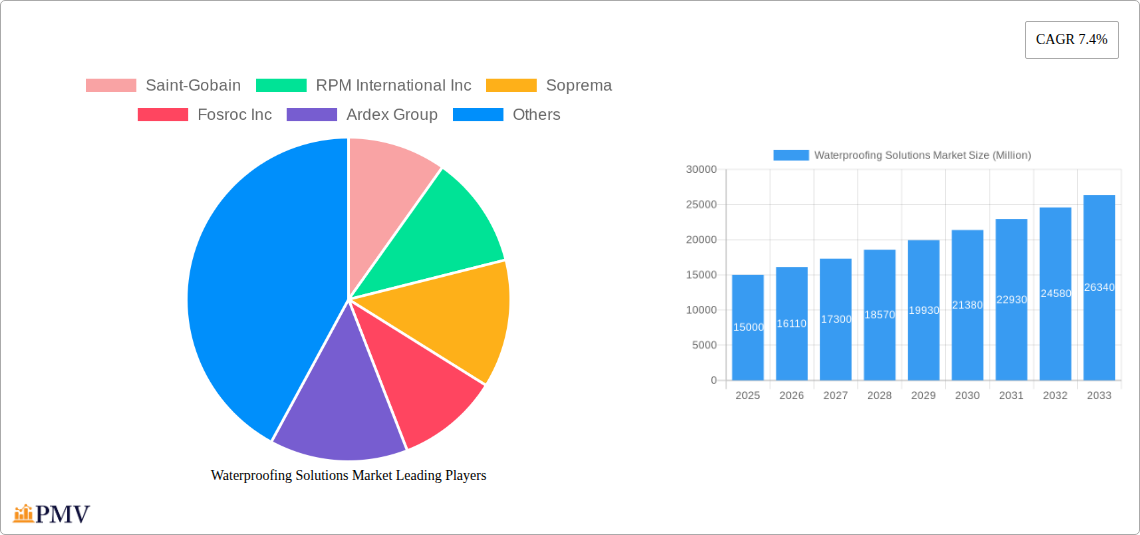
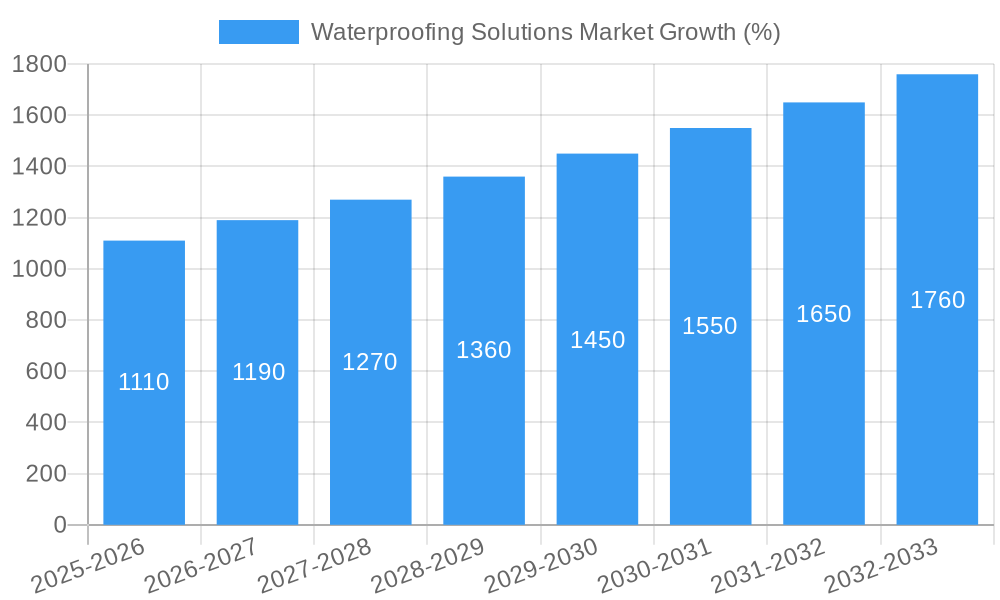
The global waterproofing solutions market is experiencing robust growth, projected to reach a substantial size with a Compound Annual Growth Rate (CAGR) of 7.4% from 2025 to 2033. This expansion is driven by several key factors. The increasing prevalence of extreme weather events, including heavier rainfall and flooding, is fueling demand for effective waterproofing solutions across residential, commercial, and industrial sectors. Furthermore, stringent building codes and regulations in many regions mandate the use of high-quality waterproofing materials to ensure structural integrity and longevity. Growth is also spurred by the ongoing expansion of the global infrastructure sector, particularly in developing economies, leading to increased construction activity and demand for effective waterproofing solutions. The rising adoption of sustainable and eco-friendly waterproofing materials is another significant trend shaping market dynamics. Manufacturers are increasingly investing in research and development to produce solutions with reduced environmental impact, such as those using recycled materials or incorporating low-VOC formulations. This trend is driven by growing environmental awareness and stricter environmental regulations. However, fluctuating raw material prices and economic downturns pose challenges to market growth.
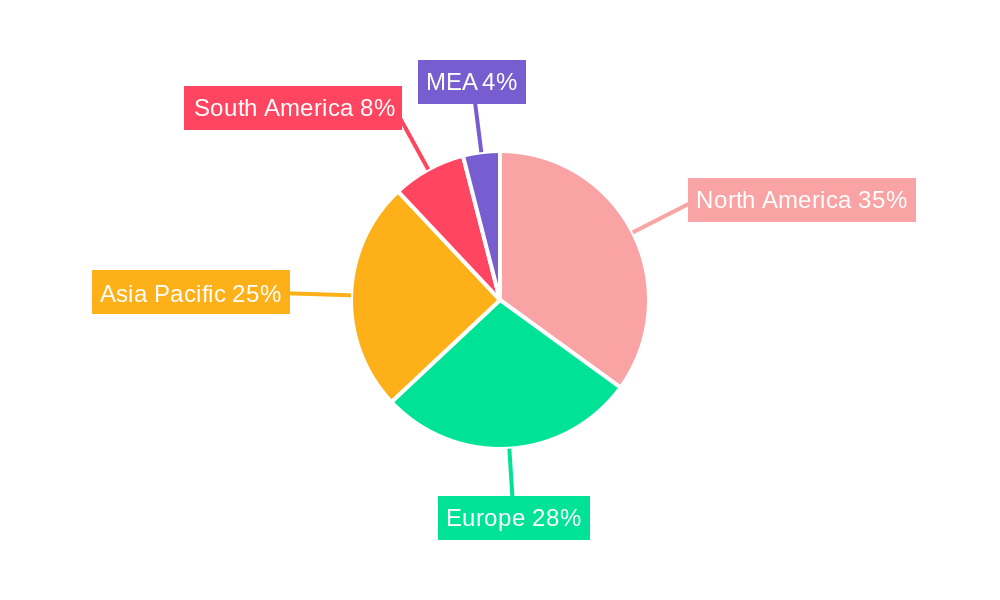
Market segmentation reveals significant opportunities across various end-use sectors and product types. The residential segment, driven by new home construction and renovation projects, represents a substantial portion of the market. However, the commercial and industrial segments are also exhibiting strong growth, propelled by the construction of large-scale commercial buildings and industrial facilities requiring robust waterproofing solutions. Among product types, membranes dominate due to their superior waterproofing capabilities and versatility. However, coatings, sealants, and adhesives also represent significant market segments, each catering to specific application needs. Geographically, North America and Europe currently hold significant market shares, but the Asia-Pacific region is expected to witness the fastest growth over the forecast period, driven by rapid urbanization and infrastructure development in countries like China and India. Key players in the market, including Saint-Gobain, RPM International Inc., Soprema, and Sika AG, are strategically focusing on product innovation, expansion into new markets, and acquisitions to maintain their competitive edge.
Waterproofing Solutions Market: A Comprehensive Report (2019-2033)
This in-depth report provides a comprehensive analysis of the global waterproofing solutions market, offering invaluable insights for industry stakeholders, investors, and researchers. Covering the period from 2019 to 2033, with a base year of 2025 and a forecast period of 2025-2033, this report meticulously examines market dynamics, trends, and future prospects. The market is expected to reach xx Million by 2033, exhibiting a CAGR of xx% during the forecast period. This report incorporates data from the historical period (2019-2024) and leverages rigorous research methodologies to provide reliable and actionable intelligence.
Waterproofing Solutions Market Structure & Competitive Dynamics
The global waterproofing solutions market is characterized by a moderately concentrated landscape, with a few major players holding significant market share. Key players such as Saint-Gobain, RPM International Inc, Soprema, and Sika AG compete intensely, driving innovation and shaping market dynamics. The market structure is influenced by factors such as technological advancements, regulatory frameworks (e.g., building codes focusing on energy efficiency and sustainability), and the availability of product substitutes (e.g., alternative building materials). End-user trends, particularly towards sustainable and high-performance buildings, are significantly impacting market demand. Mergers and acquisitions (M&A) activities have been prominent, influencing market consolidation and shaping competitive landscapes. Recent M&A deals, such as Sika's acquisition of MBCC Group in May 2023 (valued at xx Million), demonstrate the strategic importance of expanding product portfolios and market reach within the waterproofing solutions sector. Market share analysis reveals that the top 5 players collectively account for approximately xx% of the global market. The report also delves into the innovation ecosystem, analyzing the role of research and development (R&D) investments, partnerships, and collaborations in driving product innovation and market expansion.
Waterproofing Solutions Market Industry Trends & Insights
The global waterproofing solutions market is experiencing robust growth, driven by several key factors. The increasing construction activities across the globe, particularly in developing economies, are fueling demand for waterproofing solutions. The rising prevalence of extreme weather events, including increased rainfall and flooding, underscores the critical need for effective waterproofing in buildings and infrastructure. Technological advancements in waterproofing materials, such as the development of high-performance membranes and self-healing coatings, are enhancing product efficacy and expanding application possibilities. Consumer preferences are shifting towards sustainable and eco-friendly waterproofing solutions, leading to the increased adoption of materials with lower environmental impact. The market is also witnessing a trend towards specialized waterproofing solutions tailored to specific applications and end-use sectors. Competitive dynamics play a crucial role, with major players investing heavily in R&D, marketing, and strategic acquisitions to gain market share. The market penetration of innovative waterproofing technologies, such as spray-applied polyurethane foam, is gradually increasing, driven by its superior performance and ease of application. This report analyzes these trends in detail, providing a comprehensive understanding of the market's evolution and future prospects.
Dominant Markets & Segments in Waterproofing Solutions Market
The Asia-Pacific region is currently the dominant market for waterproofing solutions, driven by rapid urbanization, robust infrastructure development, and increasing investments in construction projects. Within the end-use sectors, the infrastructure segment holds a significant market share due to extensive government investments in infrastructure projects globally. The residential segment also exhibits robust growth, propelled by rising disposable incomes and increased homeownership rates in various countries. Among sub-products, membranes hold the largest market share, driven by their superior waterproofing capabilities and versatility.
Key Drivers for Asia-Pacific Dominance:
- Rapid urbanization and infrastructure development.
- Favorable government policies promoting construction activities.
- Rising disposable incomes and increased housing demand.
Key Drivers for Infrastructure Segment Dominance:
- Extensive investments in infrastructure projects globally.
- Growing need for robust waterproofing in bridges, tunnels, and other structures.
- Stringent building codes and regulations emphasizing infrastructure durability.
Key Drivers for Membranes Segment Dominance:
- Superior waterproofing performance and durability.
- Wide range of applications across various end-use sectors.
- Increasing demand for high-performance building materials.
Waterproofing Solutions Market Product Innovations
Recent innovations in waterproofing solutions focus on enhancing performance, sustainability, and ease of application. This includes the development of self-healing membranes, breathable coatings, and bio-based sealants. These advancements cater to the growing demand for sustainable and environmentally friendly products while addressing the challenges of increased weather extremes and stricter building codes. The market is witnessing the emergence of smart waterproofing systems integrated with sensors and monitoring technologies, improving the efficiency and effectiveness of waterproofing solutions. This evolution emphasizes a move towards proactive maintenance and long-term performance.
Report Segmentation & Scope
This report segments the waterproofing solutions market based on end-use sector (Commercial, Industrial and Institutional, Infrastructure, Residential) and sub-product (Membranes, Coatings, Sealants, Adhesives). Each segment is analyzed in detail, providing insights into its market size, growth projections, and competitive dynamics. The report offers detailed market size estimations for each segment during the historical, base, and forecast periods. The competitive landscape within each segment is explored, highlighting key players, their strategies, and market share. Growth projections for each segment are based on an assessment of market drivers, trends, and challenges.
Key Drivers of Waterproofing Solutions Market Growth
The waterproofing solutions market is propelled by several key factors: increasing urbanization and infrastructure development leading to a surge in construction activities; growing demand for energy-efficient and sustainable buildings; stringent building codes emphasizing water resistance; and rising incidences of extreme weather events necessitating improved waterproofing solutions. Technological advancements in waterproofing materials further contribute to market expansion.
Challenges in the Waterproofing Solutions Market Sector
The waterproofing solutions market faces certain challenges, including fluctuations in raw material prices, increasing competition, stringent environmental regulations, and potential supply chain disruptions. These factors influence product costs, profitability, and market competitiveness. Additionally, the technical complexity of waterproofing projects and the need for skilled labor can pose implementation challenges.
Leading Players in the Waterproofing Solutions Market
- Saint-Gobain (Saint-Gobain)
- RPM International Inc (RPM International Inc)
- Soprema (Soprema)
- Fosroc Inc (Fosroc Inc)
- Ardex Group (Ardex Group)
- MAPEI S p A (MAPEI S p A)
- Sika AG (Sika AG)
- Keshun Waterproof Technology Co ltd
- Standard Industries Inc (Standard Industries Inc)
- Oriental Yuhong
Key Developments in Waterproofing Solutions Market Sector
- May 2023: Oriental Yuhong signed a strategic cooperation agreement with Hebei Aorun Shunda Group, expanding its research capabilities in waterproofing membranes and thermal insulation coatings.
- May 2023: Sika acquired the MBCC Group, significantly expanding its portfolio of waterproofing solutions and market presence.
- March 2023: Oriental Yuhong initiated a strategic cooperation agreement with Luoyang Longfeng Construction Investment Co., Ltd., further strengthening its position in the building products market.
Strategic Waterproofing Solutions Market Outlook
The future of the waterproofing solutions market looks promising, driven by sustained growth in the construction industry, increasing urbanization, and rising demand for sustainable and high-performance building materials. Strategic opportunities exist for companies that can innovate in sustainable materials, develop advanced waterproofing technologies, and offer integrated solutions catering to specific market needs. The focus on resilient infrastructure and climate change adaptation will further propel market growth, creating opportunities for companies specializing in advanced waterproofing systems.
Waterproofing Solutions Market Segmentation
-
1. End Use Sector
- 1.1. Commercial
- 1.2. Industrial and Institutional
- 1.3. Infrastructure
- 1.4. Residential
-
2. Sub Product
-
2.1. Chemicals
-
2.1.1. By Technology
- 2.1.1.1. Epoxy-based
- 2.1.1.2. Polyurethane-based
- 2.1.1.3. Water-based
- 2.1.1.4. Other Technologies
-
2.1.1. By Technology
-
2.2. Membranes
- 2.2.1. Cold Liquid Applied
- 2.2.2. Fully Adhered Sheet
- 2.2.3. Hot Liquid Applied
- 2.2.4. Loose Laid Sheet
-
2.1. Chemicals
Waterproofing Solutions Market Segmentation By Geography
-
1. North America
- 1.1. United States
- 1.2. Canada
- 1.3. Mexico
-
2. South America
- 2.1. Brazil
- 2.2. Argentina
- 2.3. Rest of South America
-
3. Europe
- 3.1. United Kingdom
- 3.2. Germany
- 3.3. France
- 3.4. Italy
- 3.5. Spain
- 3.6. Russia
- 3.7. Benelux
- 3.8. Nordics
- 3.9. Rest of Europe
-
4. Middle East & Africa
- 4.1. Turkey
- 4.2. Israel
- 4.3. GCC
- 4.4. North Africa
- 4.5. South Africa
- 4.6. Rest of Middle East & Africa
-
5. Asia Pacific
- 5.1. China
- 5.2. India
- 5.3. Japan
- 5.4. South Korea
- 5.5. ASEAN
- 5.6. Oceania
- 5.7. Rest of Asia Pacific
Waterproofing Solutions Market REPORT HIGHLIGHTS
| Aspects | Details |
|---|---|
| Study Period | 2019-2033 |
| Base Year | 2024 |
| Estimated Year | 2025 |
| Forecast Period | 2025-2033 |
| Historical Period | 2019-2024 |
| Growth Rate | CAGR of 7.4% from 2019-2033 |
| Segmentation |
|
Table of Contents
- 1. Introduction
- 1.1. Research Scope
- 1.2. Market Segmentation
- 1.3. Research Methodology
- 1.4. Definitions and Assumptions
- 2. Executive Summary
- 2.1. Introduction
- 3. Market Dynamics
- 3.1. Introduction
- 3.2. Market Drivers
- 3.2.1. ; Banning/ Limiting Use of Plastics used in packaging applications
- 3.3. Market Restrains
- 3.3.1. ; Harmful Amines in Dyes; Paperless Green Initiatives
- 3.4. Market Trends
- 3.4.1. OTHER KEY INDUSTRY TRENDS COVERED IN THE REPORT
- 4. Market Factor Analysis
- 4.1. Porters Five Forces
- 4.2. Supply/Value Chain
- 4.3. PESTEL analysis
- 4.4. Market Entropy
- 4.5. Patent/Trademark Analysis
- 5. Global Waterproofing Solutions Market Analysis, Insights and Forecast, 2019-2031
- 5.1. Market Analysis, Insights and Forecast - by End Use Sector
- 5.1.1. Commercial
- 5.1.2. Industrial and Institutional
- 5.1.3. Infrastructure
- 5.1.4. Residential
- 5.2. Market Analysis, Insights and Forecast - by Sub Product
- 5.2.1. Chemicals
- 5.2.1.1. By Technology
- 5.2.1.1.1. Epoxy-based
- 5.2.1.1.2. Polyurethane-based
- 5.2.1.1.3. Water-based
- 5.2.1.1.4. Other Technologies
- 5.2.1.1. By Technology
- 5.2.2. Membranes
- 5.2.2.1. Cold Liquid Applied
- 5.2.2.2. Fully Adhered Sheet
- 5.2.2.3. Hot Liquid Applied
- 5.2.2.4. Loose Laid Sheet
- 5.2.1. Chemicals
- 5.3. Market Analysis, Insights and Forecast - by Region
- 5.3.1. North America
- 5.3.2. South America
- 5.3.3. Europe
- 5.3.4. Middle East & Africa
- 5.3.5. Asia Pacific
- 5.1. Market Analysis, Insights and Forecast - by End Use Sector
- 6. North America Waterproofing Solutions Market Analysis, Insights and Forecast, 2019-2031
- 6.1. Market Analysis, Insights and Forecast - by End Use Sector
- 6.1.1. Commercial
- 6.1.2. Industrial and Institutional
- 6.1.3. Infrastructure
- 6.1.4. Residential
- 6.2. Market Analysis, Insights and Forecast - by Sub Product
- 6.2.1. Chemicals
- 6.2.1.1. By Technology
- 6.2.1.1.1. Epoxy-based
- 6.2.1.1.2. Polyurethane-based
- 6.2.1.1.3. Water-based
- 6.2.1.1.4. Other Technologies
- 6.2.1.1. By Technology
- 6.2.2. Membranes
- 6.2.2.1. Cold Liquid Applied
- 6.2.2.2. Fully Adhered Sheet
- 6.2.2.3. Hot Liquid Applied
- 6.2.2.4. Loose Laid Sheet
- 6.2.1. Chemicals
- 6.1. Market Analysis, Insights and Forecast - by End Use Sector
- 7. South America Waterproofing Solutions Market Analysis, Insights and Forecast, 2019-2031
- 7.1. Market Analysis, Insights and Forecast - by End Use Sector
- 7.1.1. Commercial
- 7.1.2. Industrial and Institutional
- 7.1.3. Infrastructure
- 7.1.4. Residential
- 7.2. Market Analysis, Insights and Forecast - by Sub Product
- 7.2.1. Chemicals
- 7.2.1.1. By Technology
- 7.2.1.1.1. Epoxy-based
- 7.2.1.1.2. Polyurethane-based
- 7.2.1.1.3. Water-based
- 7.2.1.1.4. Other Technologies
- 7.2.1.1. By Technology
- 7.2.2. Membranes
- 7.2.2.1. Cold Liquid Applied
- 7.2.2.2. Fully Adhered Sheet
- 7.2.2.3. Hot Liquid Applied
- 7.2.2.4. Loose Laid Sheet
- 7.2.1. Chemicals
- 7.1. Market Analysis, Insights and Forecast - by End Use Sector
- 8. Europe Waterproofing Solutions Market Analysis, Insights and Forecast, 2019-2031
- 8.1. Market Analysis, Insights and Forecast - by End Use Sector
- 8.1.1. Commercial
- 8.1.2. Industrial and Institutional
- 8.1.3. Infrastructure
- 8.1.4. Residential
- 8.2. Market Analysis, Insights and Forecast - by Sub Product
- 8.2.1. Chemicals
- 8.2.1.1. By Technology
- 8.2.1.1.1. Epoxy-based
- 8.2.1.1.2. Polyurethane-based
- 8.2.1.1.3. Water-based
- 8.2.1.1.4. Other Technologies
- 8.2.1.1. By Technology
- 8.2.2. Membranes
- 8.2.2.1. Cold Liquid Applied
- 8.2.2.2. Fully Adhered Sheet
- 8.2.2.3. Hot Liquid Applied
- 8.2.2.4. Loose Laid Sheet
- 8.2.1. Chemicals
- 8.1. Market Analysis, Insights and Forecast - by End Use Sector
- 9. Middle East & Africa Waterproofing Solutions Market Analysis, Insights and Forecast, 2019-2031
- 9.1. Market Analysis, Insights and Forecast - by End Use Sector
- 9.1.1. Commercial
- 9.1.2. Industrial and Institutional
- 9.1.3. Infrastructure
- 9.1.4. Residential
- 9.2. Market Analysis, Insights and Forecast - by Sub Product
- 9.2.1. Chemicals
- 9.2.1.1. By Technology
- 9.2.1.1.1. Epoxy-based
- 9.2.1.1.2. Polyurethane-based
- 9.2.1.1.3. Water-based
- 9.2.1.1.4. Other Technologies
- 9.2.1.1. By Technology
- 9.2.2. Membranes
- 9.2.2.1. Cold Liquid Applied
- 9.2.2.2. Fully Adhered Sheet
- 9.2.2.3. Hot Liquid Applied
- 9.2.2.4. Loose Laid Sheet
- 9.2.1. Chemicals
- 9.1. Market Analysis, Insights and Forecast - by End Use Sector
- 10. Asia Pacific Waterproofing Solutions Market Analysis, Insights and Forecast, 2019-2031
- 10.1. Market Analysis, Insights and Forecast - by End Use Sector
- 10.1.1. Commercial
- 10.1.2. Industrial and Institutional
- 10.1.3. Infrastructure
- 10.1.4. Residential
- 10.2. Market Analysis, Insights and Forecast - by Sub Product
- 10.2.1. Chemicals
- 10.2.1.1. By Technology
- 10.2.1.1.1. Epoxy-based
- 10.2.1.1.2. Polyurethane-based
- 10.2.1.1.3. Water-based
- 10.2.1.1.4. Other Technologies
- 10.2.1.1. By Technology
- 10.2.2. Membranes
- 10.2.2.1. Cold Liquid Applied
- 10.2.2.2. Fully Adhered Sheet
- 10.2.2.3. Hot Liquid Applied
- 10.2.2.4. Loose Laid Sheet
- 10.2.1. Chemicals
- 10.1. Market Analysis, Insights and Forecast - by End Use Sector
- 11. North America Waterproofing Solutions Market Analysis, Insights and Forecast, 2019-2031
- 11.1. Market Analysis, Insights and Forecast - By Country/Sub-region
- 11.1.1 United States
- 11.1.2 Canada
- 11.1.3 Mexico
- 12. Europe Waterproofing Solutions Market Analysis, Insights and Forecast, 2019-2031
- 12.1. Market Analysis, Insights and Forecast - By Country/Sub-region
- 12.1.1 Germany
- 12.1.2 France
- 12.1.3 Italy
- 12.1.4 United Kingdom
- 12.1.5 Netherlands
- 12.1.6 Rest of Europe
- 13. Asia Pacific Waterproofing Solutions Market Analysis, Insights and Forecast, 2019-2031
- 13.1. Market Analysis, Insights and Forecast - By Country/Sub-region
- 13.1.1 China
- 13.1.2 Japan
- 13.1.3 India
- 13.1.4 South Korea
- 13.1.5 Taiwan
- 13.1.6 Australia
- 13.1.7 Rest of Asia-Pacific
- 14. South America Waterproofing Solutions Market Analysis, Insights and Forecast, 2019-2031
- 14.1. Market Analysis, Insights and Forecast - By Country/Sub-region
- 14.1.1 Brazil
- 14.1.2 Argentina
- 14.1.3 Rest of South America
- 15. MEA Waterproofing Solutions Market Analysis, Insights and Forecast, 2019-2031
- 15.1. Market Analysis, Insights and Forecast - By Country/Sub-region
- 15.1.1 Middle East
- 15.1.2 Africa
- 16. Competitive Analysis
- 16.1. Global Market Share Analysis 2024
- 16.2. Company Profiles
- 16.2.1 Saint-Gobain
- 16.2.1.1. Overview
- 16.2.1.2. Products
- 16.2.1.3. SWOT Analysis
- 16.2.1.4. Recent Developments
- 16.2.1.5. Financials (Based on Availability)
- 16.2.2 RPM International Inc
- 16.2.2.1. Overview
- 16.2.2.2. Products
- 16.2.2.3. SWOT Analysis
- 16.2.2.4. Recent Developments
- 16.2.2.5. Financials (Based on Availability)
- 16.2.3 Soprema
- 16.2.3.1. Overview
- 16.2.3.2. Products
- 16.2.3.3. SWOT Analysis
- 16.2.3.4. Recent Developments
- 16.2.3.5. Financials (Based on Availability)
- 16.2.4 Fosroc Inc
- 16.2.4.1. Overview
- 16.2.4.2. Products
- 16.2.4.3. SWOT Analysis
- 16.2.4.4. Recent Developments
- 16.2.4.5. Financials (Based on Availability)
- 16.2.5 Ardex Group
- 16.2.5.1. Overview
- 16.2.5.2. Products
- 16.2.5.3. SWOT Analysis
- 16.2.5.4. Recent Developments
- 16.2.5.5. Financials (Based on Availability)
- 16.2.6 MAPEI S p A
- 16.2.6.1. Overview
- 16.2.6.2. Products
- 16.2.6.3. SWOT Analysis
- 16.2.6.4. Recent Developments
- 16.2.6.5. Financials (Based on Availability)
- 16.2.7 Sika AG
- 16.2.7.1. Overview
- 16.2.7.2. Products
- 16.2.7.3. SWOT Analysis
- 16.2.7.4. Recent Developments
- 16.2.7.5. Financials (Based on Availability)
- 16.2.8 Keshun Waterproof Technology Co ltd
- 16.2.8.1. Overview
- 16.2.8.2. Products
- 16.2.8.3. SWOT Analysis
- 16.2.8.4. Recent Developments
- 16.2.8.5. Financials (Based on Availability)
- 16.2.9 Standard Industries Inc
- 16.2.9.1. Overview
- 16.2.9.2. Products
- 16.2.9.3. SWOT Analysis
- 16.2.9.4. Recent Developments
- 16.2.9.5. Financials (Based on Availability)
- 16.2.10 Oriental Yuhong
- 16.2.10.1. Overview
- 16.2.10.2. Products
- 16.2.10.3. SWOT Analysis
- 16.2.10.4. Recent Developments
- 16.2.10.5. Financials (Based on Availability)
- 16.2.1 Saint-Gobain
List of Figures
- Figure 1: Global Waterproofing Solutions Market Revenue Breakdown (Million, %) by Region 2024 & 2032
- Figure 2: Global Waterproofing Solutions Market Volume Breakdown (K Tons, %) by Region 2024 & 2032
- Figure 3: North America Waterproofing Solutions Market Revenue (Million), by Country 2024 & 2032
- Figure 4: North America Waterproofing Solutions Market Volume (K Tons), by Country 2024 & 2032
- Figure 5: North America Waterproofing Solutions Market Revenue Share (%), by Country 2024 & 2032
- Figure 6: North America Waterproofing Solutions Market Volume Share (%), by Country 2024 & 2032
- Figure 7: Europe Waterproofing Solutions Market Revenue (Million), by Country 2024 & 2032
- Figure 8: Europe Waterproofing Solutions Market Volume (K Tons), by Country 2024 & 2032
- Figure 9: Europe Waterproofing Solutions Market Revenue Share (%), by Country 2024 & 2032
- Figure 10: Europe Waterproofing Solutions Market Volume Share (%), by Country 2024 & 2032
- Figure 11: Asia Pacific Waterproofing Solutions Market Revenue (Million), by Country 2024 & 2032
- Figure 12: Asia Pacific Waterproofing Solutions Market Volume (K Tons), by Country 2024 & 2032
- Figure 13: Asia Pacific Waterproofing Solutions Market Revenue Share (%), by Country 2024 & 2032
- Figure 14: Asia Pacific Waterproofing Solutions Market Volume Share (%), by Country 2024 & 2032
- Figure 15: South America Waterproofing Solutions Market Revenue (Million), by Country 2024 & 2032
- Figure 16: South America Waterproofing Solutions Market Volume (K Tons), by Country 2024 & 2032
- Figure 17: South America Waterproofing Solutions Market Revenue Share (%), by Country 2024 & 2032
- Figure 18: South America Waterproofing Solutions Market Volume Share (%), by Country 2024 & 2032
- Figure 19: MEA Waterproofing Solutions Market Revenue (Million), by Country 2024 & 2032
- Figure 20: MEA Waterproofing Solutions Market Volume (K Tons), by Country 2024 & 2032
- Figure 21: MEA Waterproofing Solutions Market Revenue Share (%), by Country 2024 & 2032
- Figure 22: MEA Waterproofing Solutions Market Volume Share (%), by Country 2024 & 2032
- Figure 23: North America Waterproofing Solutions Market Revenue (Million), by End Use Sector 2024 & 2032
- Figure 24: North America Waterproofing Solutions Market Volume (K Tons), by End Use Sector 2024 & 2032
- Figure 25: North America Waterproofing Solutions Market Revenue Share (%), by End Use Sector 2024 & 2032
- Figure 26: North America Waterproofing Solutions Market Volume Share (%), by End Use Sector 2024 & 2032
- Figure 27: North America Waterproofing Solutions Market Revenue (Million), by Sub Product 2024 & 2032
- Figure 28: North America Waterproofing Solutions Market Volume (K Tons), by Sub Product 2024 & 2032
- Figure 29: North America Waterproofing Solutions Market Revenue Share (%), by Sub Product 2024 & 2032
- Figure 30: North America Waterproofing Solutions Market Volume Share (%), by Sub Product 2024 & 2032
- Figure 31: North America Waterproofing Solutions Market Revenue (Million), by Country 2024 & 2032
- Figure 32: North America Waterproofing Solutions Market Volume (K Tons), by Country 2024 & 2032
- Figure 33: North America Waterproofing Solutions Market Revenue Share (%), by Country 2024 & 2032
- Figure 34: North America Waterproofing Solutions Market Volume Share (%), by Country 2024 & 2032
- Figure 35: South America Waterproofing Solutions Market Revenue (Million), by End Use Sector 2024 & 2032
- Figure 36: South America Waterproofing Solutions Market Volume (K Tons), by End Use Sector 2024 & 2032
- Figure 37: South America Waterproofing Solutions Market Revenue Share (%), by End Use Sector 2024 & 2032
- Figure 38: South America Waterproofing Solutions Market Volume Share (%), by End Use Sector 2024 & 2032
- Figure 39: South America Waterproofing Solutions Market Revenue (Million), by Sub Product 2024 & 2032
- Figure 40: South America Waterproofing Solutions Market Volume (K Tons), by Sub Product 2024 & 2032
- Figure 41: South America Waterproofing Solutions Market Revenue Share (%), by Sub Product 2024 & 2032
- Figure 42: South America Waterproofing Solutions Market Volume Share (%), by Sub Product 2024 & 2032
- Figure 43: South America Waterproofing Solutions Market Revenue (Million), by Country 2024 & 2032
- Figure 44: South America Waterproofing Solutions Market Volume (K Tons), by Country 2024 & 2032
- Figure 45: South America Waterproofing Solutions Market Revenue Share (%), by Country 2024 & 2032
- Figure 46: South America Waterproofing Solutions Market Volume Share (%), by Country 2024 & 2032
- Figure 47: Europe Waterproofing Solutions Market Revenue (Million), by End Use Sector 2024 & 2032
- Figure 48: Europe Waterproofing Solutions Market Volume (K Tons), by End Use Sector 2024 & 2032
- Figure 49: Europe Waterproofing Solutions Market Revenue Share (%), by End Use Sector 2024 & 2032
- Figure 50: Europe Waterproofing Solutions Market Volume Share (%), by End Use Sector 2024 & 2032
- Figure 51: Europe Waterproofing Solutions Market Revenue (Million), by Sub Product 2024 & 2032
- Figure 52: Europe Waterproofing Solutions Market Volume (K Tons), by Sub Product 2024 & 2032
- Figure 53: Europe Waterproofing Solutions Market Revenue Share (%), by Sub Product 2024 & 2032
- Figure 54: Europe Waterproofing Solutions Market Volume Share (%), by Sub Product 2024 & 2032
- Figure 55: Europe Waterproofing Solutions Market Revenue (Million), by Country 2024 & 2032
- Figure 56: Europe Waterproofing Solutions Market Volume (K Tons), by Country 2024 & 2032
- Figure 57: Europe Waterproofing Solutions Market Revenue Share (%), by Country 2024 & 2032
- Figure 58: Europe Waterproofing Solutions Market Volume Share (%), by Country 2024 & 2032
- Figure 59: Middle East & Africa Waterproofing Solutions Market Revenue (Million), by End Use Sector 2024 & 2032
- Figure 60: Middle East & Africa Waterproofing Solutions Market Volume (K Tons), by End Use Sector 2024 & 2032
- Figure 61: Middle East & Africa Waterproofing Solutions Market Revenue Share (%), by End Use Sector 2024 & 2032
- Figure 62: Middle East & Africa Waterproofing Solutions Market Volume Share (%), by End Use Sector 2024 & 2032
- Figure 63: Middle East & Africa Waterproofing Solutions Market Revenue (Million), by Sub Product 2024 & 2032
- Figure 64: Middle East & Africa Waterproofing Solutions Market Volume (K Tons), by Sub Product 2024 & 2032
- Figure 65: Middle East & Africa Waterproofing Solutions Market Revenue Share (%), by Sub Product 2024 & 2032
- Figure 66: Middle East & Africa Waterproofing Solutions Market Volume Share (%), by Sub Product 2024 & 2032
- Figure 67: Middle East & Africa Waterproofing Solutions Market Revenue (Million), by Country 2024 & 2032
- Figure 68: Middle East & Africa Waterproofing Solutions Market Volume (K Tons), by Country 2024 & 2032
- Figure 69: Middle East & Africa Waterproofing Solutions Market Revenue Share (%), by Country 2024 & 2032
- Figure 70: Middle East & Africa Waterproofing Solutions Market Volume Share (%), by Country 2024 & 2032
- Figure 71: Asia Pacific Waterproofing Solutions Market Revenue (Million), by End Use Sector 2024 & 2032
- Figure 72: Asia Pacific Waterproofing Solutions Market Volume (K Tons), by End Use Sector 2024 & 2032
- Figure 73: Asia Pacific Waterproofing Solutions Market Revenue Share (%), by End Use Sector 2024 & 2032
- Figure 74: Asia Pacific Waterproofing Solutions Market Volume Share (%), by End Use Sector 2024 & 2032
- Figure 75: Asia Pacific Waterproofing Solutions Market Revenue (Million), by Sub Product 2024 & 2032
- Figure 76: Asia Pacific Waterproofing Solutions Market Volume (K Tons), by Sub Product 2024 & 2032
- Figure 77: Asia Pacific Waterproofing Solutions Market Revenue Share (%), by Sub Product 2024 & 2032
- Figure 78: Asia Pacific Waterproofing Solutions Market Volume Share (%), by Sub Product 2024 & 2032
- Figure 79: Asia Pacific Waterproofing Solutions Market Revenue (Million), by Country 2024 & 2032
- Figure 80: Asia Pacific Waterproofing Solutions Market Volume (K Tons), by Country 2024 & 2032
- Figure 81: Asia Pacific Waterproofing Solutions Market Revenue Share (%), by Country 2024 & 2032
- Figure 82: Asia Pacific Waterproofing Solutions Market Volume Share (%), by Country 2024 & 2032
List of Tables
- Table 1: Global Waterproofing Solutions Market Revenue Million Forecast, by Region 2019 & 2032
- Table 2: Global Waterproofing Solutions Market Volume K Tons Forecast, by Region 2019 & 2032
- Table 3: Global Waterproofing Solutions Market Revenue Million Forecast, by End Use Sector 2019 & 2032
- Table 4: Global Waterproofing Solutions Market Volume K Tons Forecast, by End Use Sector 2019 & 2032
- Table 5: Global Waterproofing Solutions Market Revenue Million Forecast, by Sub Product 2019 & 2032
- Table 6: Global Waterproofing Solutions Market Volume K Tons Forecast, by Sub Product 2019 & 2032
- Table 7: Global Waterproofing Solutions Market Revenue Million Forecast, by Region 2019 & 2032
- Table 8: Global Waterproofing Solutions Market Volume K Tons Forecast, by Region 2019 & 2032
- Table 9: Global Waterproofing Solutions Market Revenue Million Forecast, by Country 2019 & 2032
- Table 10: Global Waterproofing Solutions Market Volume K Tons Forecast, by Country 2019 & 2032
- Table 11: United States Waterproofing Solutions Market Revenue (Million) Forecast, by Application 2019 & 2032
- Table 12: United States Waterproofing Solutions Market Volume (K Tons) Forecast, by Application 2019 & 2032
- Table 13: Canada Waterproofing Solutions Market Revenue (Million) Forecast, by Application 2019 & 2032
- Table 14: Canada Waterproofing Solutions Market Volume (K Tons) Forecast, by Application 2019 & 2032
- Table 15: Mexico Waterproofing Solutions Market Revenue (Million) Forecast, by Application 2019 & 2032
- Table 16: Mexico Waterproofing Solutions Market Volume (K Tons) Forecast, by Application 2019 & 2032
- Table 17: Global Waterproofing Solutions Market Revenue Million Forecast, by Country 2019 & 2032
- Table 18: Global Waterproofing Solutions Market Volume K Tons Forecast, by Country 2019 & 2032
- Table 19: Germany Waterproofing Solutions Market Revenue (Million) Forecast, by Application 2019 & 2032
- Table 20: Germany Waterproofing Solutions Market Volume (K Tons) Forecast, by Application 2019 & 2032
- Table 21: France Waterproofing Solutions Market Revenue (Million) Forecast, by Application 2019 & 2032
- Table 22: France Waterproofing Solutions Market Volume (K Tons) Forecast, by Application 2019 & 2032
- Table 23: Italy Waterproofing Solutions Market Revenue (Million) Forecast, by Application 2019 & 2032
- Table 24: Italy Waterproofing Solutions Market Volume (K Tons) Forecast, by Application 2019 & 2032
- Table 25: United Kingdom Waterproofing Solutions Market Revenue (Million) Forecast, by Application 2019 & 2032
- Table 26: United Kingdom Waterproofing Solutions Market Volume (K Tons) Forecast, by Application 2019 & 2032
- Table 27: Netherlands Waterproofing Solutions Market Revenue (Million) Forecast, by Application 2019 & 2032
- Table 28: Netherlands Waterproofing Solutions Market Volume (K Tons) Forecast, by Application 2019 & 2032
- Table 29: Rest of Europe Waterproofing Solutions Market Revenue (Million) Forecast, by Application 2019 & 2032
- Table 30: Rest of Europe Waterproofing Solutions Market Volume (K Tons) Forecast, by Application 2019 & 2032
- Table 31: Global Waterproofing Solutions Market Revenue Million Forecast, by Country 2019 & 2032
- Table 32: Global Waterproofing Solutions Market Volume K Tons Forecast, by Country 2019 & 2032
- Table 33: China Waterproofing Solutions Market Revenue (Million) Forecast, by Application 2019 & 2032
- Table 34: China Waterproofing Solutions Market Volume (K Tons) Forecast, by Application 2019 & 2032
- Table 35: Japan Waterproofing Solutions Market Revenue (Million) Forecast, by Application 2019 & 2032
- Table 36: Japan Waterproofing Solutions Market Volume (K Tons) Forecast, by Application 2019 & 2032
- Table 37: India Waterproofing Solutions Market Revenue (Million) Forecast, by Application 2019 & 2032
- Table 38: India Waterproofing Solutions Market Volume (K Tons) Forecast, by Application 2019 & 2032
- Table 39: South Korea Waterproofing Solutions Market Revenue (Million) Forecast, by Application 2019 & 2032
- Table 40: South Korea Waterproofing Solutions Market Volume (K Tons) Forecast, by Application 2019 & 2032
- Table 41: Taiwan Waterproofing Solutions Market Revenue (Million) Forecast, by Application 2019 & 2032
- Table 42: Taiwan Waterproofing Solutions Market Volume (K Tons) Forecast, by Application 2019 & 2032
- Table 43: Australia Waterproofing Solutions Market Revenue (Million) Forecast, by Application 2019 & 2032
- Table 44: Australia Waterproofing Solutions Market Volume (K Tons) Forecast, by Application 2019 & 2032
- Table 45: Rest of Asia-Pacific Waterproofing Solutions Market Revenue (Million) Forecast, by Application 2019 & 2032
- Table 46: Rest of Asia-Pacific Waterproofing Solutions Market Volume (K Tons) Forecast, by Application 2019 & 2032
- Table 47: Global Waterproofing Solutions Market Revenue Million Forecast, by Country 2019 & 2032
- Table 48: Global Waterproofing Solutions Market Volume K Tons Forecast, by Country 2019 & 2032
- Table 49: Brazil Waterproofing Solutions Market Revenue (Million) Forecast, by Application 2019 & 2032
- Table 50: Brazil Waterproofing Solutions Market Volume (K Tons) Forecast, by Application 2019 & 2032
- Table 51: Argentina Waterproofing Solutions Market Revenue (Million) Forecast, by Application 2019 & 2032
- Table 52: Argentina Waterproofing Solutions Market Volume (K Tons) Forecast, by Application 2019 & 2032
- Table 53: Rest of South America Waterproofing Solutions Market Revenue (Million) Forecast, by Application 2019 & 2032
- Table 54: Rest of South America Waterproofing Solutions Market Volume (K Tons) Forecast, by Application 2019 & 2032
- Table 55: Global Waterproofing Solutions Market Revenue Million Forecast, by Country 2019 & 2032
- Table 56: Global Waterproofing Solutions Market Volume K Tons Forecast, by Country 2019 & 2032
- Table 57: Middle East Waterproofing Solutions Market Revenue (Million) Forecast, by Application 2019 & 2032
- Table 58: Middle East Waterproofing Solutions Market Volume (K Tons) Forecast, by Application 2019 & 2032
- Table 59: Africa Waterproofing Solutions Market Revenue (Million) Forecast, by Application 2019 & 2032
- Table 60: Africa Waterproofing Solutions Market Volume (K Tons) Forecast, by Application 2019 & 2032
- Table 61: Global Waterproofing Solutions Market Revenue Million Forecast, by End Use Sector 2019 & 2032
- Table 62: Global Waterproofing Solutions Market Volume K Tons Forecast, by End Use Sector 2019 & 2032
- Table 63: Global Waterproofing Solutions Market Revenue Million Forecast, by Sub Product 2019 & 2032
- Table 64: Global Waterproofing Solutions Market Volume K Tons Forecast, by Sub Product 2019 & 2032
- Table 65: Global Waterproofing Solutions Market Revenue Million Forecast, by Country 2019 & 2032
- Table 66: Global Waterproofing Solutions Market Volume K Tons Forecast, by Country 2019 & 2032
- Table 67: United States Waterproofing Solutions Market Revenue (Million) Forecast, by Application 2019 & 2032
- Table 68: United States Waterproofing Solutions Market Volume (K Tons) Forecast, by Application 2019 & 2032
- Table 69: Canada Waterproofing Solutions Market Revenue (Million) Forecast, by Application 2019 & 2032
- Table 70: Canada Waterproofing Solutions Market Volume (K Tons) Forecast, by Application 2019 & 2032
- Table 71: Mexico Waterproofing Solutions Market Revenue (Million) Forecast, by Application 2019 & 2032
- Table 72: Mexico Waterproofing Solutions Market Volume (K Tons) Forecast, by Application 2019 & 2032
- Table 73: Global Waterproofing Solutions Market Revenue Million Forecast, by End Use Sector 2019 & 2032
- Table 74: Global Waterproofing Solutions Market Volume K Tons Forecast, by End Use Sector 2019 & 2032
- Table 75: Global Waterproofing Solutions Market Revenue Million Forecast, by Sub Product 2019 & 2032
- Table 76: Global Waterproofing Solutions Market Volume K Tons Forecast, by Sub Product 2019 & 2032
- Table 77: Global Waterproofing Solutions Market Revenue Million Forecast, by Country 2019 & 2032
- Table 78: Global Waterproofing Solutions Market Volume K Tons Forecast, by Country 2019 & 2032
- Table 79: Brazil Waterproofing Solutions Market Revenue (Million) Forecast, by Application 2019 & 2032
- Table 80: Brazil Waterproofing Solutions Market Volume (K Tons) Forecast, by Application 2019 & 2032
- Table 81: Argentina Waterproofing Solutions Market Revenue (Million) Forecast, by Application 2019 & 2032
- Table 82: Argentina Waterproofing Solutions Market Volume (K Tons) Forecast, by Application 2019 & 2032
- Table 83: Rest of South America Waterproofing Solutions Market Revenue (Million) Forecast, by Application 2019 & 2032
- Table 84: Rest of South America Waterproofing Solutions Market Volume (K Tons) Forecast, by Application 2019 & 2032
- Table 85: Global Waterproofing Solutions Market Revenue Million Forecast, by End Use Sector 2019 & 2032
- Table 86: Global Waterproofing Solutions Market Volume K Tons Forecast, by End Use Sector 2019 & 2032
- Table 87: Global Waterproofing Solutions Market Revenue Million Forecast, by Sub Product 2019 & 2032
- Table 88: Global Waterproofing Solutions Market Volume K Tons Forecast, by Sub Product 2019 & 2032
- Table 89: Global Waterproofing Solutions Market Revenue Million Forecast, by Country 2019 & 2032
- Table 90: Global Waterproofing Solutions Market Volume K Tons Forecast, by Country 2019 & 2032
- Table 91: United Kingdom Waterproofing Solutions Market Revenue (Million) Forecast, by Application 2019 & 2032
- Table 92: United Kingdom Waterproofing Solutions Market Volume (K Tons) Forecast, by Application 2019 & 2032
- Table 93: Germany Waterproofing Solutions Market Revenue (Million) Forecast, by Application 2019 & 2032
- Table 94: Germany Waterproofing Solutions Market Volume (K Tons) Forecast, by Application 2019 & 2032
- Table 95: France Waterproofing Solutions Market Revenue (Million) Forecast, by Application 2019 & 2032
- Table 96: France Waterproofing Solutions Market Volume (K Tons) Forecast, by Application 2019 & 2032
- Table 97: Italy Waterproofing Solutions Market Revenue (Million) Forecast, by Application 2019 & 2032
- Table 98: Italy Waterproofing Solutions Market Volume (K Tons) Forecast, by Application 2019 & 2032
- Table 99: Spain Waterproofing Solutions Market Revenue (Million) Forecast, by Application 2019 & 2032
- Table 100: Spain Waterproofing Solutions Market Volume (K Tons) Forecast, by Application 2019 & 2032
- Table 101: Russia Waterproofing Solutions Market Revenue (Million) Forecast, by Application 2019 & 2032
- Table 102: Russia Waterproofing Solutions Market Volume (K Tons) Forecast, by Application 2019 & 2032
- Table 103: Benelux Waterproofing Solutions Market Revenue (Million) Forecast, by Application 2019 & 2032
- Table 104: Benelux Waterproofing Solutions Market Volume (K Tons) Forecast, by Application 2019 & 2032
- Table 105: Nordics Waterproofing Solutions Market Revenue (Million) Forecast, by Application 2019 & 2032
- Table 106: Nordics Waterproofing Solutions Market Volume (K Tons) Forecast, by Application 2019 & 2032
- Table 107: Rest of Europe Waterproofing Solutions Market Revenue (Million) Forecast, by Application 2019 & 2032
- Table 108: Rest of Europe Waterproofing Solutions Market Volume (K Tons) Forecast, by Application 2019 & 2032
- Table 109: Global Waterproofing Solutions Market Revenue Million Forecast, by End Use Sector 2019 & 2032
- Table 110: Global Waterproofing Solutions Market Volume K Tons Forecast, by End Use Sector 2019 & 2032
- Table 111: Global Waterproofing Solutions Market Revenue Million Forecast, by Sub Product 2019 & 2032
- Table 112: Global Waterproofing Solutions Market Volume K Tons Forecast, by Sub Product 2019 & 2032
- Table 113: Global Waterproofing Solutions Market Revenue Million Forecast, by Country 2019 & 2032
- Table 114: Global Waterproofing Solutions Market Volume K Tons Forecast, by Country 2019 & 2032
- Table 115: Turkey Waterproofing Solutions Market Revenue (Million) Forecast, by Application 2019 & 2032
- Table 116: Turkey Waterproofing Solutions Market Volume (K Tons) Forecast, by Application 2019 & 2032
- Table 117: Israel Waterproofing Solutions Market Revenue (Million) Forecast, by Application 2019 & 2032
- Table 118: Israel Waterproofing Solutions Market Volume (K Tons) Forecast, by Application 2019 & 2032
- Table 119: GCC Waterproofing Solutions Market Revenue (Million) Forecast, by Application 2019 & 2032
- Table 120: GCC Waterproofing Solutions Market Volume (K Tons) Forecast, by Application 2019 & 2032
- Table 121: North Africa Waterproofing Solutions Market Revenue (Million) Forecast, by Application 2019 & 2032
- Table 122: North Africa Waterproofing Solutions Market Volume (K Tons) Forecast, by Application 2019 & 2032
- Table 123: South Africa Waterproofing Solutions Market Revenue (Million) Forecast, by Application 2019 & 2032
- Table 124: South Africa Waterproofing Solutions Market Volume (K Tons) Forecast, by Application 2019 & 2032
- Table 125: Rest of Middle East & Africa Waterproofing Solutions Market Revenue (Million) Forecast, by Application 2019 & 2032
- Table 126: Rest of Middle East & Africa Waterproofing Solutions Market Volume (K Tons) Forecast, by Application 2019 & 2032
- Table 127: Global Waterproofing Solutions Market Revenue Million Forecast, by End Use Sector 2019 & 2032
- Table 128: Global Waterproofing Solutions Market Volume K Tons Forecast, by End Use Sector 2019 & 2032
- Table 129: Global Waterproofing Solutions Market Revenue Million Forecast, by Sub Product 2019 & 2032
- Table 130: Global Waterproofing Solutions Market Volume K Tons Forecast, by Sub Product 2019 & 2032
- Table 131: Global Waterproofing Solutions Market Revenue Million Forecast, by Country 2019 & 2032
- Table 132: Global Waterproofing Solutions Market Volume K Tons Forecast, by Country 2019 & 2032
- Table 133: China Waterproofing Solutions Market Revenue (Million) Forecast, by Application 2019 & 2032
- Table 134: China Waterproofing Solutions Market Volume (K Tons) Forecast, by Application 2019 & 2032
- Table 135: India Waterproofing Solutions Market Revenue (Million) Forecast, by Application 2019 & 2032
- Table 136: India Waterproofing Solutions Market Volume (K Tons) Forecast, by Application 2019 & 2032
- Table 137: Japan Waterproofing Solutions Market Revenue (Million) Forecast, by Application 2019 & 2032
- Table 138: Japan Waterproofing Solutions Market Volume (K Tons) Forecast, by Application 2019 & 2032
- Table 139: South Korea Waterproofing Solutions Market Revenue (Million) Forecast, by Application 2019 & 2032
- Table 140: South Korea Waterproofing Solutions Market Volume (K Tons) Forecast, by Application 2019 & 2032
- Table 141: ASEAN Waterproofing Solutions Market Revenue (Million) Forecast, by Application 2019 & 2032
- Table 142: ASEAN Waterproofing Solutions Market Volume (K Tons) Forecast, by Application 2019 & 2032
- Table 143: Oceania Waterproofing Solutions Market Revenue (Million) Forecast, by Application 2019 & 2032
- Table 144: Oceania Waterproofing Solutions Market Volume (K Tons) Forecast, by Application 2019 & 2032
- Table 145: Rest of Asia Pacific Waterproofing Solutions Market Revenue (Million) Forecast, by Application 2019 & 2032
- Table 146: Rest of Asia Pacific Waterproofing Solutions Market Volume (K Tons) Forecast, by Application 2019 & 2032
Frequently Asked Questions
1. What is the projected Compound Annual Growth Rate (CAGR) of the Waterproofing Solutions Market?
The projected CAGR is approximately 7.4%.
2. Which companies are prominent players in the Waterproofing Solutions Market?
Key companies in the market include Saint-Gobain, RPM International Inc, Soprema, Fosroc Inc, Ardex Group, MAPEI S p A, Sika AG, Keshun Waterproof Technology Co ltd, Standard Industries Inc, Oriental Yuhong.
3. What are the main segments of the Waterproofing Solutions Market?
The market segments include End Use Sector, Sub Product.
4. Can you provide details about the market size?
The market size is estimated to be USD XX Million as of 2022.
5. What are some drivers contributing to market growth?
; Banning/ Limiting Use of Plastics used in packaging applications.
6. What are the notable trends driving market growth?
OTHER KEY INDUSTRY TRENDS COVERED IN THE REPORT.
7. Are there any restraints impacting market growth?
; Harmful Amines in Dyes; Paperless Green Initiatives.
8. Can you provide examples of recent developments in the market?
May 2023: Oriental Yuhong signed a strategic cooperation agreement with Hebei Aorun Shunda Group to collaborate on multi-dimensional research in the fields of waterproofing membranes and thermal insulation coatings, among other solutions.May 2023: Sika, a global leader in construction chemicals, acquired the MBCC Group, including its waterproofing solutions, anchors & grouts, flooring resins, repair & rehabilitation chemicals, and other businesses, with the exception of its concrete admixture operations in Europe, North America, Australia, and New Zealand.March 2023: To further develop its portfolio of building products, including waterproofing solutions, Oriental Yuhong initiated a strategic cooperation agreement with Luoyang Longfeng Construction Investment Co., Ltd. This agreement is expected to result in the exchange of resources in the field of construction materials.
9. What pricing options are available for accessing the report?
Pricing options include single-user, multi-user, and enterprise licenses priced at USD 3800, USD 4500, and USD 5800 respectively.
10. Is the market size provided in terms of value or volume?
The market size is provided in terms of value, measured in Million and volume, measured in K Tons.
11. Are there any specific market keywords associated with the report?
Yes, the market keyword associated with the report is "Waterproofing Solutions Market," which aids in identifying and referencing the specific market segment covered.
12. How do I determine which pricing option suits my needs best?
The pricing options vary based on user requirements and access needs. Individual users may opt for single-user licenses, while businesses requiring broader access may choose multi-user or enterprise licenses for cost-effective access to the report.
13. Are there any additional resources or data provided in the Waterproofing Solutions Market report?
While the report offers comprehensive insights, it's advisable to review the specific contents or supplementary materials provided to ascertain if additional resources or data are available.
14. How can I stay updated on further developments or reports in the Waterproofing Solutions Market?
To stay informed about further developments, trends, and reports in the Waterproofing Solutions Market, consider subscribing to industry newsletters, following relevant companies and organizations, or regularly checking reputable industry news sources and publications.
Methodology
Step 1 - Identification of Relevant Samples Size from Population Database


Step 2 - Approaches for Defining Global Market Size (Value, Volume* & Price*)

Note*: In applicable scenarios
Step 3 - Data Sources
Primary Research
- Web Analytics
- Survey Reports
- Research Institute
- Latest Research Reports
- Opinion Leaders
Secondary Research
- Annual Reports
- White Paper
- Latest Press Release
- Industry Association
- Paid Database
- Investor Presentations

Step 4 - Data Triangulation
Involves using different sources of information in order to increase the validity of a study
These sources are likely to be stakeholders in a program - participants, other researchers, program staff, other community members, and so on.
Then we put all data in single framework & apply various statistical tools to find out the dynamic on the market.
During the analysis stage, feedback from the stakeholder groups would be compared to determine areas of agreement as well as areas of divergence


